
Market Synopsis 02022015
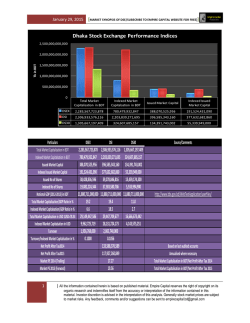
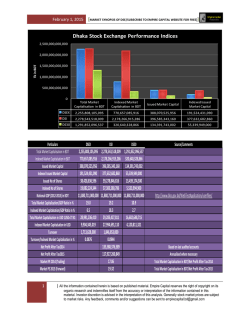
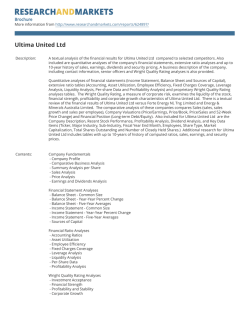
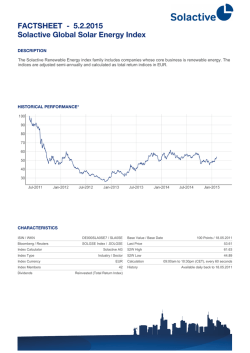
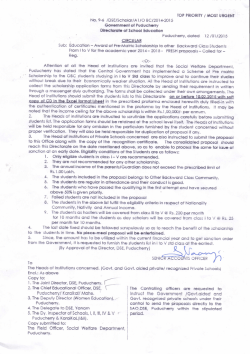
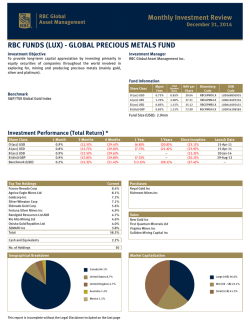
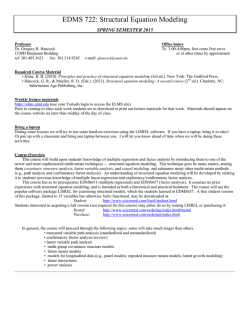
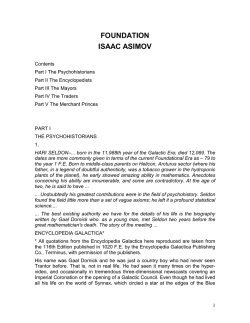
February 2, 2015
[MARKET SYNOPSIS OF DSE/SUBSCRIBE TO EMPIRE CAPITAL WEBSITE FOR FREE]]
Dhaka Stock Exchange Performance Indices
2,500,000,000,000
Tk in BDT
2,000,000,000,000
1,500,000,000,000
1,000,000,000,000
500,000,000,000
0
Total Market
Capitalisation in BDT
Indexed Market
Capitalsation in BDT
Issued Market Capital
Indexed Issued
Market Capital
DSEX
2,246,220,056,330
765,902,462,906
388,070,525,956
191,524,431,090
DSI
2,268,514,195,495
2,169,659,378,120
396,585,343,160
377,632,682,860
DS30
1,282,005,010,785
317,799,067,374
134,391,743,002
55,339,949,000
Particulars
Total Market Capitalisation in BDT
Indexed Market Capitalsation in BDT
Issued Market Capital
Indexed Issued Market Capital
Issued No of Shares
Indexed No of Shares
National GDP (2012-2013) in BDT
Total Market Capitalisation/GDP Ratio in %
Indexed Market Capitalsation/GDP Ratio in %
Total Market Capitalisation in USD 1USD=77.81
Indexed Market Capitalsation in USD
Turnover
Turnover/Indexed Market Capitalisation in %
Net Profit After Tax2014
Net Profit After Tax2015
Market PE 2014 (Trailing)
Market PE 2015 (Forward)
1
DSEX
DSI
DS30
2,246,220,056,330
765,902,462,906
388,070,525,956
191,524,431,090
38,428,836,596
19,082,224,344
11,880,711,000,000
18.9
6.4
28,868,012,548
9,843,239,467
2,061,912,000
0.1054
2,268,514,195,495
2,169,659,378,120
396,585,343,160
377,632,682,860
39,278,846,816
37,383,580,786
11,880,711,000,000
19.1
18.3
29,154,532,778
27,884,068,605
2,269,459,000
0.1160
133,588,376,589
117,927,260,849
16.98
19.24
1,282,005,010,785
317,799,067,374
134,391,743,002
55,339,949,000
13,439,174,300
5,533,994,900
11,880,711,000,000
10.8
2.7
16,476,095,756
4,084,295,944
Source/Comments
http://www.bbs.gov.bd/WebTestApplication/userfiles/
Based on last audited accounts
Annualised where necessary
Total Market Capitalisation in BDT/Net Profit After Tax 2014
Total Market Capitalisation in BDT/Net Profit After Tax 2015
| All the information contained herein is based on published material. Empire Capital reserves the right of copyright on its
organic research and indemnifies itself from the accuracy or interpretation of the information contained in this
material. Investor discretion is advised in the interpretation of this analysis. Generally stock market prices are subject
to market risks. Any feedback, comments and/or suggestions can be sent to [email protected]
February 2, 2015
SECTOR
YDAY MARKET CAP
Bank
Cement
Ceramic
Engineering
Financial Institutions
Food & Allied
Fuel and Power
Insurance
IT Sector
Jute
Miscellaneous
Pharma & Chemicals
Service & Real Estate
Tannery
Telecommunication
Textile
Travel & Leisure
Paper and Printing
TOTAL EQUITY MARKET CAP
MARKET CAP
399,714,028,668
194,423,091,420
21,668,140,525
98,228,022,049
136,264,003,919
238,782,064,148
307,873,210,461
77,873,009,687
5,723,735,948
769,357,800
58,764,225,395
318,624,566,202
19,208,975,317
23,539,744,461
455,924,010,886
77,636,898,752
26,216,233,161
456,000,000
2,461,689,318,800
INDEX
DSEX
DSES
DS30
TOTAL MARKET CAPITALIZATION
2
[MARKET SYNOPSIS OF DSE/SUBSCRIBE TO EMPIRE CAPITAL WEBSITE FOR FREE]]
399,886,519,660
190,954,012,056
21,610,451,496
96,730,206,396
136,630,573,178
234,702,188,412
305,535,438,079
76,960,260,882
5,726,721,658
749,402,500
58,763,328,156
318,343,509,542
19,106,703,069
23,487,611,190
455,714,453,083
79,142,530,384
25,758,866,761
442,700,000
2,450,245,476,503
% CHANGE MARKET CAP% OF TOTAL MARKET CAPYDAY TURNOVER(in mn) TURNOVER(in mn)
0.04%
-1.78%
-0.27%
-1.52%
0.27%
-1.71%
-0.76%
-1.17%
0.05%
-2.59%
0.00%
-0.09%
-0.53%
-0.22%
-0.05%
1.94%
-1.74%
-2.92%
-0.46%
16.32%
7.79%
0.88%
3.95%
5.58%
9.58%
12.47%
3.14%
0.23%
0.03%
2.40%
12.99%
0.78%
0.96%
18.60%
3.23%
1.05%
0.02%
100.00%
189.066
107.571
26.953
168
93.492
79.532
240.719
24.106
100.288
0.759
75.911
194.331
70.077
5.911
72.053
254.303
21
10.556
1734.628
253.471
98.737
26.285
212.626
162.1
130.493
315.871
30.264
73.719
0.905
86.846
214.852
67.207
20.104
124.12
236.35
27.072
7.962
2088.984
% CHANGE TURNOVER
34.06%
-8.21%
-2.48%
26.56%
73.38%
64.08%
31.22%
25.55%
-26.49%
19.24%
14.41%
10.56%
-4.10%
240.11%
72.26%
-7.06%
28.91%
-24.57%
20.43%
YESTERDAY
TODAY
% CHANGE
4654.95482
4618.43083
-0.7846%
1099.45732
1091.27505
-0.7442%
1732.54522
1705.62102
-1.5540%
3140826.931
3127861.333
-0.41%
| All the information contained herein is based on published material. Empire Capital reserves the right of copyright on its
organic research and indemnifies itself from the accuracy or interpretation of the information contained in this
material. Investor discretion is advised in the interpretation of this analysis. Generally stock market prices are subject
to market risks. Any feedback, comments and/or suggestions can be sent to [email protected]
February 2, 2015
[MARKET SYNOPSIS OF DSE/SUBSCRIBE TO EMPIRE CAPITAL WEBSITE FOR FREE]]
Market Capitalisation Composition
Market Turnover Composition
3
| All the information contained herein is based on published material. Empire Capital reserves the right of copyright on its
organic research and indemnifies itself from the accuracy or interpretation of the information contained in this
material. Investor discretion is advised in the interpretation of this analysis. Generally stock market prices are subject
to market risks. Any feedback, comments and/or suggestions can be sent to [email protected]
February 2, 2015
[MARKET SYNOPSIS OF DSE/SUBSCRIBE TO EMPIRE CAPITAL WEBSITE FOR FREE]]
Sector
Bank
Cement
Ceramic
Engineering
Financial Institutions
Food & Allied
Fuel and Power
Insurance
IT Sector
Jute
Miscellaneous
Pharma & Chemicals
Service & Real Estate
Tannery
Telecommunication
Textile
Travel & Leisure
Paper and Printing
Total Market Cap.(DSEX)
Total Market Cap.(DSI)
Total Market Cap.(DS30)
Turnover
372,346,837,207
372,346,836,903
93,486,152,425
190,954,016,996
190,954,016,996
166,348,489,720
19,549,323,349
19,790,305,547
80,088,265,290
80,449,005,315
30,693,327,390
135,575,560,224
136,423,454,116
15,711,430,928
203,978,012,411
213,450,388,831
199,569,072,540
258,698,430,423
259,049,610,492
195,708,216,397
73,022,134,350
74,278,101,841
23,944,833,128
5,032,542,205
5,032,542,177
253,572,000
730,082,000
58,675,055,064
58,740,516,598
14,894,808,059
278,190,814,614
285,317,256,175
44,785,384,575
13,739,736,849
13,739,736,818
23,279,713,800
23,476,825,800
455,714,453,088
455,714,453,088
455,714,453,088
54,294,184,462
55,727,821,249
18,764,138,536
22,384,704,000
22,850,541,548
22,384,704,000
442,700,000
442,700,000
-
% Turnover of TMC(DSEX) % Turnover of TMC(DSI) % Turnover of TMC(DS30)
253.471
0.0681%
0.0681%
0.2711%
98.737
0.0517%
0.0517%
0.0594%
26.285
0.1345%
0.1328%
0.0000%
212.626
0.2655%
0.2643%
0.6927%
162.1
0.1196%
0.1188%
1.0317%
130.493
0.0640%
0.0611%
0.0654%
315.871
0.1221%
0.1219%
0.1614%
30.264
0.0414%
0.0407%
0.1264%
73.719
1.4648%
1.4648%
0.0000%
0.905
0.3569%
0.1240%
0.0000%
86.846
0.1480%
0.1478%
0.5831%
214.852
0.0772%
0.0753%
0.4797%
67.207
0.4891%
0.4891%
0.0000%
20.104
0.0864%
0.0856%
0.0000%
124.12
0.0272%
0.0272%
0.0272%
236.35
0.4353%
0.4241%
1.2596%
27.072
0.1209%
0.1185%
0.1209%
7.962
1.7985%
1.7985%
0.0000%
Sector
Bank
Cement
Ceramic
Engineering
Financial Institutions
Food & Allied
Fuel and Power
Insurance
IT Sector
Jute
Miscellaneous
Pharma & Chemicals
Service & Real Estate
Tannery
Telecommunication
Textile
Travel & Leisure
Paper and Printing
Indexed Market Cap.(DSEX) Indexed Market Cap.(DSI) Indexed Market Cap.(DS30) Turnover
195,519,219,681
372,208,882,995
45,683,002,459
82,195,975,142
179,883,691,996
73,596,561,456
5,174,715,834
19,790,305,547
30,137,728,561
66,564,865,843
10,993,503,087
59,374,677,511
132,312,241,818
5,020,176,265
42,855,543,155
212,723,207,543
35,436,323,952
73,179,615,907
239,016,688,189
57,483,591,347
32,505,744,461
60,145,155,243
8,350,786,025
3,694,056,339
4,554,516,921
93,821,640
730,082,000
16,861,302,414
55,962,669,383
11,766,898,341
106,081,279,169
279,197,738,486
5,993,000,303
4,995,566,805
13,739,736,818
8,706,830,286
23,476,825,800
47,946,084,587
447,051,045,253
47,946,084,587
24,612,137,000
45,815,745,149
8,717,945,313
6,811,194,240
10,358,106,062
6,811,194,240
151,359,130
442,700,000
-
% Turnover of IMC(DSEX) % Turnover of IMC(DSI) % Turnover of IMC(DS30)
253.471
0.1296%
0.0681%
0.5548%
98.737
0.1201%
0.0549%
0.1342%
26.285
0.5080%
0.1328%
0.0000%
212.626
0.7055%
0.3194%
1.9341%
162.1
0.2730%
0.1225%
3.2290%
130.493
0.3045%
0.0613%
0.3682%
315.871
0.4316%
0.1322%
0.5495%
30.264
0.0931%
0.0503%
0.3624%
73.719
1.9956%
1.6186%
0.0000%
0.905
0.9646%
0.1240%
0.0000%
86.846
0.5151%
0.1552%
0.7381%
214.852
0.2025%
0.0770%
3.5850%
67.207
1.3453%
0.4891%
0.0000%
20.104
0.2309%
0.0856%
0.0000%
124.12
0.2589%
0.0278%
0.2589%
236.35
0.9603%
0.5159%
2.7111%
27.072
0.3975%
0.2614%
0.3975%
7.962
5.2603%
1.7985%
0.0000%
4
| All the information contained herein is based on published material. Empire Capital reserves the right of copyright on its
organic research and indemnifies itself from the accuracy or interpretation of the information contained in this
material. Investor discretion is advised in the interpretation of this analysis. Generally stock market prices are subject
to market risks. Any feedback, comments and/or suggestions can be sent to [email protected]
February 2, 2015
Sector
Bank
Cement
Ceramic
Engineering
Financial Institutions
Food & Allied
Fuel and Power
General Insurance
IT Sector
Jute
Miscellaneous
Pharma & Chemicals
Service & Real Estate
Tannery
Telecommunication
Textile
Travel & Leisure
[MARKET SYNOPSIS OF DSE/SUBSCRIBE TO EMPIRE CAPITAL WEBSITE FOR FREE]]
Sectoral PE
10.00
33.93
32.12
24.34
14.59
30.51
10.84
10.98
18.71
198.59
29.04
22.10
38.42
23.52
21.11
13.08
14.33
Market Capitalisation Negative Earnings excluded
399,886,519,660 ICBIBNK
190,954,012,056
21,610,451,496 SPCERAMICS,
96,730,206,396 AZIZ PIPES, KAY&QUE,
136,630,573,178 ILFSL, MIDASFIN
234,702,188,412 CVOPRL, FINEFOODS, GEMINISEA, MEGHCONMILK, RAHIMAFOOD, ZEAL BANGLA
305,535,438,079
34,687,473,358
5,726,721,658 INTECH
749,402,500 JUTESPIN
58,763,328,156
318,343,509,542 IMAMBUTTON
19,106,703,069
23,487,611,190
455,714,453,083
79,142,530,384 DULAMIACOT, SONARGAON, MODERNDYE
25,758,866,761
TOP 10 GAINERS BASED ON YCP AND CLOSE PRICE
Instr Code
AIBL1STIMF
BERGERPBL
8THICB
DUTCHBANGL
ICB
RUPALIINS
AAMRATECH
GREENDELMF
MBL1STMF
GLAXOSMITH
YCP
TOP 10 LOSERS BASED ON YCP AND CLOSE PRICE
Instr Code
MODERNDYE
RAHIMAFOOD
SHURWID
SPCL
NFML
PRAGATILIF
NORTHERN
EASTRNLUB
NITOLINS
CVOPRL
YCP
5
High
5.1
1392.2
64
94.8
1320.8
19.8
37.1
4.2
4.2
1476.8
Low
5.6
1435
66.1
98.5
1365
20.4
38.7
4.5
4.3
1515
High
86.5
34.2
24.8
195.2
29.1
90.6
239.4
371.8
24.8
485.2
CLOSE
5.2
1419
62.3
93.9
1315
19
36.6
4.2
4.2
1466.6
Low
86
35
24.6
197
29.2
91
239
380
24.3
486.1
5.6
1432.8
65.8
97.4
1356
20.3
38
4.3
4.3
1509.2
CLOSE
80
31.2
23
177.7
27.3
85.1
223
351
22.9
458.9
81
32.1
23.4
184.6
27.6
86
227.3
353.3
23.6
462.2
%CHG
9.804
2.916
2.813
2.743
2.665
2.525
2.426
2.381
2.381
2.194
%CHG
-6.358
-6.14
-5.645
-5.43
-5.155
-5.077
-5.054
-4.976
-4.839
-4.74
| All the information contained herein is based on published material. Empire Capital reserves the right of copyright on its
organic research and indemnifies itself from the accuracy or interpretation of the information contained in this
material. Investor discretion is advised in the interpretation of this analysis. Generally stock market prices are subject
to market risks. Any feedback, comments and/or suggestions can be sent to [email protected]
February 2, 2015
[MARKET SYNOPSIS OF DSE/SUBSCRIBE TO EMPIRE CAPITAL WEBSITE FOR FREE]]
Lowest Forward PE Companies
Forward PE
GENNEXT( Generation Next Fashions Limited
5.23
FAMILYTEX( Familytex (BD) Limited )
5.69
SOUTHEASTB( Southeast Bank )
5.94
TRUSTBANK( Trust Bank Limited )
6.28
ABBANK( AB Bank Limited )
6.93
UNITEDAIR( United Airways (BD) Ltd.
7.01
ASIAPACINS( Asia Pacific General Insurance Co. Ltd. )
7.35
STANDARINS( Standard Insurance Limited )
7.39
IFIC( IFIC Bank )
7.43
UTTARAFIN( Uttara Finance )
7.64
Highest Forward PE Comapnies
ECABLES( Eastern Cables )
Forward PE
1683.24
ATLASBANG( Atlas Bangladesh )
559.61
MONNOSTAF( Monno Jute Stafflers )
251.91
BAYLEASING( Bay Leasing & Investment Limited )
238.20
BEACONPHAR( Beacon Pharmaceuticals Limited )
159.73
SONALIANSH( Sonali Aansh )
156.53
GEMINISEA( Gemini Sea Food )
156.52
BXSYNTH( Beximco Synthetics )
138.11
RENWICKJA( Renwick Jajneswar & Co (Bd) )
121.22
EASTRNLUB( Eastern Lubricants )
113.28
Highest Dividend Yield Companies
Dividend Yield
RSRMSTEEL( Ratanpur Steel Re-Rolling Mills Limited )
9.43%
FIRSTSBANK( First Security Islami Bank Limited )
9.26%
DHAKABANK
8.67%
SIBL( Social Islami Bank Limited )
8.57%
DHAKAINS( Dhaka Insurance Limited )
8.44%
SOUTHEASTB( Southeast Bank )
8.21%
STANDBANKL( Standard Bank Limited )
8.13%
PRIMEFIN( Prime Finance & Investment Ltd. )
7.98%
PHOENIXFIN( Phoenix Finance and Investments Ltd. )
7.97%
DELTASPINN( Delta Spinners Ltd. )
7.81%
6
| All the information contained herein is based on published material. Empire Capital reserves the right of copyright on its
organic research and indemnifies itself from the accuracy or interpretation of the information contained in this
material. Investor discretion is advised in the interpretation of this analysis. Generally stock market prices are subject
to market risks. Any feedback, comments and/or suggestions can be sent to [email protected]
February 2, 2015
[MARKET SYNOPSIS OF DSE/SUBSCRIBE TO EMPIRE CAPITAL WEBSITE FOR FREE]]
TOP TEN CHEAPEST STOCK BASED ON FORWARD PE RELATIVE TO SECTORAL PE
NAME OF THE COMPANY
BATASHOE( Bata Shoe )
PRIMEINSUR( PRIME INSURACE )
GP( Grameenphone Ltd. )
METROSPIN( Metro Spinning
GHAIL( Golden Harvest Agro Industries Ltd. )
ORIONINFU( Orion Infusion Ltd. )
BEXIMCO( BEXIMCO )
RAKCERAMIC( RAK Ceramics (Bangladesh) Limited )
FUWANGCER( Fu-Wang Ceramic )
APEXFOODS( Apex Foods )
Realtive to Sector PE most undervalued stocks
Column1
BANK
CEMENT
EBL( Eastern Bank )
PREMIERCEM( Premier Cement Mills Limited )
EXIMBANK( Export Import (Exim) Bank of Bangladesh )
HEIDELBCEM( Heidelberg Cement Bd. )
FIRSTSBANK( First Security Islami Bank Limited )
MEGHNACEM( Meghna Cement )
CERAMIC
ENGINEERING
RAKCERAMIC( RAK Ceramics (Bangladesh) Limited )
NPOLYMAR( National Polymer )
FUWANGCER( Fu-Wang Ceramic )
BSRMSTEEL( BSRM Steels Limited )
GOLDENSON( Golden Son Ltd. )
FINANCIAL INSTITUITION
FOOD AND ALLIED
ISLAMICFIN( Islamic Finance & Investment Ltd. )
BATBC( BATBC )
BDFINANCE( Bangladesh Finance and Investment Co.Ltd )
APEXFOODS( Apex Foods )
FASFIN( FAS Finance & Investment Limited )
RDFOOD( Rangpur Dairy & Food Products Ltd. )
FUEL AND POWER
GENERAL INSURANCE
PADMAOIL( Padma Oil Co. )
PRIMEINSUR( PRIME INSURACE )
SPPCL (Summit Purbanchol Power Company Limited )
MERCINS( Mercantile Insurance Co. Ltd. )
BEDL( Barakatullah Electro Dynamics Ltd. )
SONARBAINS( Sonar Bangla Insurance Ltd. )
IT SECTOR
MISCELLANEOUS
BDCOM( BDCOM Online Ltd. )
BERGERPBL( Berger Paints Bangladesh Ltd. )
DAFODILCOM( Daffodil Computers Ltd. )
SINOBANGLA( Sinobangla Industries )
INTECH( In Tech Online Ltd. )
ARAMIT( Aramit )
PHARMA AND CHEMICALS
SERVICE AND REAL ESTATE
MARICO( Marico Bangladesh Limited )
SAMORITA( Samorita Hospital )
ACTIVEFINE( Active Fine Chemicals Limited )
EHL( Eastern Housing )
SALVOCHEM( Salvo Chemical Industry Limited )
TANNERY
TELECOMMUNICATION
APEXADELFT( Apex Adelchi Footwear Ltd. )
GP( Grameenphone Ltd. )
BATASHOE( Bata Shoe )
TEXTILE
TRAVEL AND LEISURE
RNSPIN( R.N. Spinning Mills Limited )
BDSERVICE( Bangladesh Services Ltd. )
SAIHAMCOT( Saiham Cotton Mills Limited )
UNITEDAIR( United Airways (BD) Ltd.
PTL( Paramount Textile Limited )
7
| All the information contained herein is based on published material. Empire Capital reserves the right of copyright on its
organic research and indemnifies itself from the accuracy or interpretation of the information contained in this
material. Investor discretion is advised in the interpretation of this analysis. Generally stock market prices are subject
to market risks. Any feedback, comments and/or suggestions can be sent to [email protected]
February 2, 2015
[MARKET SYNOPSIS OF DSE/SUBSCRIBE TO EMPIRE CAPITAL WEBSITE FOR FREE]]
NOTES
DSE Indices as per „DSE Bangladesh Index Methodology‟ designed and developed by S&P Dow Jones Indices Dhaka Stock Exchange Indices
The Dhaka Stock Exchange presently computes two indices, DSE Broad Index (DSEX) and DSE 30 Index (DS30). None of the DSE Indi ces
include mutual funds, debentures and bonds. DSEX and DS30 Index
Introduction of DSE Indices
The Dhaka Stock Exchange Limited introduced DSE Broad Index (“DSEX”) and DSE 30 Index (“DS30”) as per „DSE Bangladesh Index
Methodology‟ designed and developed by S&P Dow Jones Indices with effect from January 28, 2013.” DSEX” is the Broad Index of the
Exchange (Benchmark Index) which reflects around 97% of the total equity market capitalization.DS30 constructed with 30 leading companies
which can be said as investable Index of the Exchange. “DS30” reflects around 51% of the total equity market capitalization. The criteria taken
into consideration in construction of these Indices are:
Market Capitalization
DS30 - Eligible stocks must have a float-adjusted market capitalization above 500 million BDT as of the rebalancing reference date.
DSEX - Eligible stocks must have a float-adjusted market capitalization above 100 million BDT. Additionally, if a current index constituent falls
below the 100 million BDT threshold, but is no less than 70 million BDT, then the stock remains in the index provi ded it also meets the other
inclusion criteria.
Float-Adjustment: A stock‟s weight in an index is determined by its float-adjusted market capitalization.
Liquidity
DS30- Stocks must have a minimum three-month average daily value traded (ADVT) of 5 million BDT as of the rebalancing reference date.
Liquidity criteria can be reduced to 3 million BDT in certain circumstance to ensure there are enough constituents in the ind ex. At each semiannual rebalancing, if a current index constituent falls below 5 million BDT but is no less than 3 million BDT then the stock remains in the index
provided it also meets the other eligibility criteria.
DSEX - Stocks must have a minimum six-month ADVT of 1 million BDT as of the rebalancing reference date. At each annual rebalancing, if a
current index constituent falls below 1 million BDT, but is no less than 0.7 million BDT, then the stock remains in the index provided it also
meets the other eligibility criteria. In addition, all eligible stocks for the DSE indices are required to trade at least half of normal trading days
each month for the three months prior to the rebalancing reference date.
Financial Viability
DS30 - Stocks must be profitable as measured by positive net income over the latest 12-month period, as of the rebalancing reference date. The
figure is calculated by adding the latest four quarters of net income reported for the company.
DSEX - Financial viability is not required for index membership.
Sector Classification
All listed DSE stocks are classified according to the DSE Industry Classification system. The number of constituents in Banks, Financial
Institutions, Insurance sector and Real Estate Sub-sector of Service & Real Estate sector is capped at 5 each and 10 combined for the DS30
Index.
Sector diversification rule is not applied to the DSEX.
Base Date
The base dates of the DSE 30 Index (DS30) and The DSE Broad Index (DSEX) are January 17, 2008.
Base Value
DSE 30 Index (DS30): The base value is 1000 for DS30 Index. The DSE Broad Index (DSEX): The DSE Broad index has a base value of 2951.91 on
Jan 17th 2008 which was the index value of the DSE General Index on this date. The new index is a broad market index and is d esigned to refect
the broad market performance. Starting the base value at 2951.91 the performance of the two indices has been linked and we maintain the
continuity of the performance of the benchmark. The two indices are very close in design and we can build on the history of the older index
which goes back to 2001.
“Interim IPO additions to the DSE Broad Index
8
| All the information contained herein is based on published material. Empire Capital reserves the right of copyright on its
organic research and indemnifies itself from the accuracy or interpretation of the information contained in this
material. Investor discretion is advised in the interpretation of this analysis. Generally stock market prices are subject
to market risks. Any feedback, comments and/or suggestions can be sent to [email protected]
February 2, 2015
[MARKET SYNOPSIS OF DSE/SUBSCRIBE TO EMPIRE CAPITAL WEBSITE FOR FREE]]
(DSEX) take place quarterly on the third Thursday of April, July and October. To be considered eligible for inclusion, an IPO must fall within the
top half of the ranked companies, by float-adjusted market capitalization and have at least one month of sufficient liquidity at each quarterly
observation date”. After ranking the companies in accordance with “DSE Bangladesh Index Methodology” designed &developed by S&P Dow
Jones Indices, following one (1) company was qualified for inclusion in the DSEX with effect from October 20, 2013.
1 Familytex (BD) Limited
As a result, the total numbers of constituents in DSEX stands at 207 (Two Hundred and Seven).
On January 16, 2014 new 23 companies were included to the DSEX and existing 4 companies were excluded. The new 23 companies that were
included to the DSEX are Fareast Finance, Eastern Cables, Renwick Jajneswar, National Tubes, Bengal Windsor Thermoplastics, Bangladesh
Building Systems, AMCL (Pran), Rahim Textile, Ambee Pharma, The Ibn Sina, Libra Infusions, Global Heavy Chemicals, JMI Syring es & Medical
Devices, Central Pharmaceuticals, Hakkani Pulp & Paper, Samorita Hospital, Information Services Network, Purabi General Insurance, Pragati
Insurance, Prime Insurance, Sunlife Insurance, Usmania Glass and Berger Paints. On the other hand, existing four companies th at lost their
eligibility to retain their position in the index are Kay & Que, Midas Finance, CVO Petrochemical and Rahima Food. As a result, the total
numbers of constituents in DSEX stands at 226 (Two Hundred and twenty Six).
Similarly on January 16, 2014 in the DS30, four new companies were added to the index. They are United Commercial Bank Ltd., Delta Life
Insurance Ltd, Orion Pharma Ltd and Renata Ltd.
The existing four companies that were excluded from the index are Beximco Ltd, Khulna Power Company Ltd, Square Textiles Ltd and
Southeast Bank Ltd as they failed to meet their criteria to stay in the index.
9
| All the information contained herein is based on published material. Empire Capital reserves the right of copyright on its
organic research and indemnifies itself from the accuracy or interpretation of the information contained in this
material. Investor discretion is advised in the interpretation of this analysis. Generally stock market prices are subject
to market risks. Any feedback, comments and/or suggestions can be sent to [email protected]


© Copyright 2026