
Understanding the role of Aeolian Processes and Physical Sorting
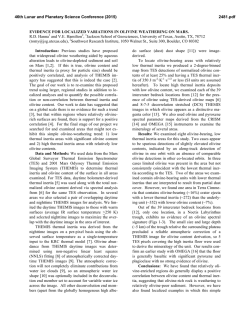
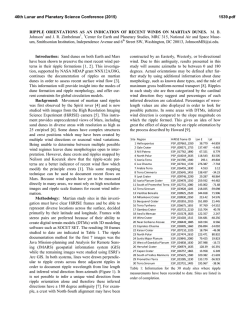
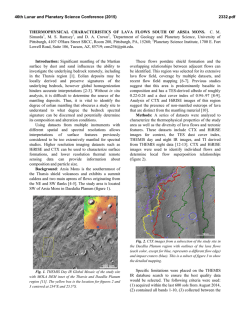
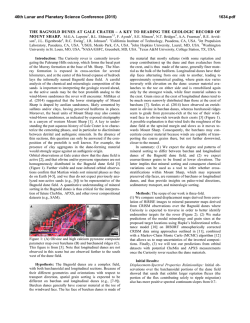
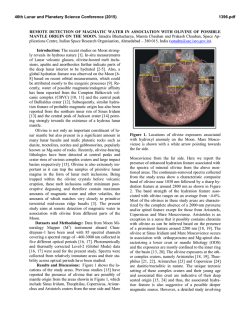
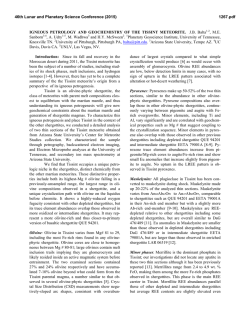
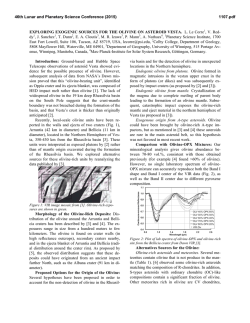
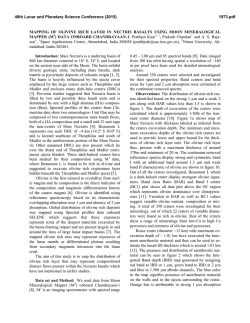
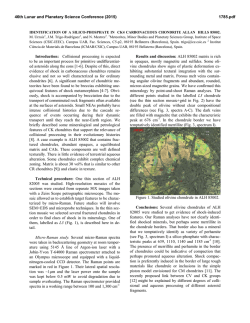
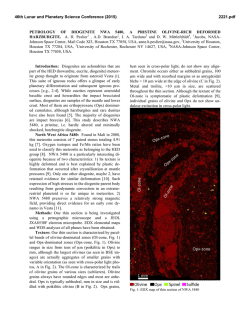
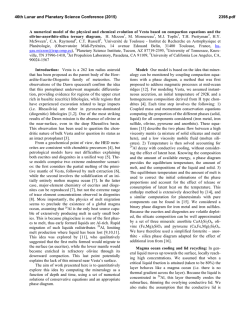
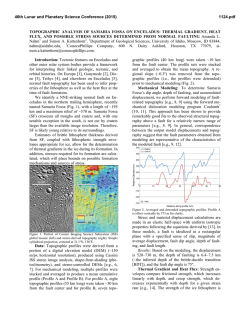
46th Lunar and Planetary Science Conference (2015)
1068.pdf
Understanding the role of aeolian processes and physical sorting on Martian surface compositions through analysis of
spectrally and thermophysically heterogeneous dune fields. Cong Pan and A. Deanne Rogers, Stony Brook University,
Department of Geosciences, 255 Earth and Space Science Building, Stony Brook, New York, 11794-2100,
[email protected].
Introduction: The composition and particle size
distributions within aeolian dunes on Earth are a function of source rock composition(s), communition during transport and chemical weathering, and aeolian
sorting mechanisms [1-2]. The original crystal size and
composition of source rock(s) first determine the grain
size and composition of sediments derived from those
rocks. Preferential comminution and chemical alteration can change the composition of those sediments (as
a function of grain size) during transport. Finally, aeolian sorting of particles leads to preferential enrichment of specific materials in certain gran-size fractions
(e.g. [3-4]). Grain size, grain shape and density are
major factors controlling the aeolian sorting (e.g. [56]). Grain sizes are commonly segregated in dunes,
with coarse-grained ripples crests and fine-grained
troughs. On Earth, three studies of spatial variations of
chemical composition within eolian environments
showed that MgO and/or FeO of fine grains are enriched over coarse grains as a result of comminution
and sorting [7-9]. On Mars, the “El Dorado” dune field
analyzed by the Spirit rover is characterized by olivineenriched coarse grains and pyroxene-enriched fine
grains [10]. Here, we use orbital measurements to examine the compositional and thermophysical heterogeneity within martian dune fields, in an effort to understand whether there are compositional trends with particle size that may place constraints on the source rock
compositions, sediment transport history and aeolian
sorting.
Data and Methods: We have used Thermal Emission Imaging System (THEMIS) and Compact Reconnaissance Imaging Spectrometer for Mars (CRISM)
images to examine composition, THEMIS to derive
thermal inertia, and high resolution visible images
(CTX, HiRISE) to study dune morphology.
Decorrelation stretch (DCS) images covering sand
dunes on the floor of impact craters were first used to
locate compositionally heterogeneous dune fields (indicated by color variations within the stretch). Next,
these compositional variations of THEMIS daytime
images were mapped quantitatively by spectral unit
mapping (similar to the methods of [11]) using scenederived olivine-poor and laboratory olivine emissivity
spectra as endmembers. Then, THEMIS and CRISM
spectral averages were extracted from compositionally
distinct areas within the dune field. THEMIS nighttime
thermal inertia images [12] were used to extract ther-
mal inertia values for compositionally distinct regions
within the field. Last, THEMIS daytime (olivine abundance map) and nighttime images were co-registered to
perform pixel to pixel analysis between olivine abundance and thermal inertia. Density slicing based on
thermal inertia values was used to highlight the spatial
variations of thermal and olivine abundance.
Results: Six out of 27 dune fields within impact
craters located between 45°N, 42°E to -14.3°N, 60°E
were observed to have heterogeneous composition and
thermal inertia in this study. TES albedo of these dunes
ranges from 0.1 to 0.15 [13] and TES dust cover index
range from 0.97 to 0.98 [14], suggesting active removal of dust cover. A sand dune located at 44.26°E,
42.16°N is shown here for example. From CTX imagery (Figure 1), we observe larger size and greater areal
coverage of ripple and crescents in the northeastern
part of the dune (large ripple part), whereas the rest of
the dune (small ripple part) is smooth covering smaller
size of ripple and crescents, suggesting particle size
differences within the dune field. The thermal inertia of
the large ripple portion is higher than the small ripple
portion, indicating a decrease of effective particle size
in small ripple portion (Figure 2). Olivine is enriched
in large ripple part while poor in the small ripple portion (Figure 3). The CRISM mafic parameter browse
image also shows stronger olivine index values in the
large ripple part (Figure 4) and no hydrated minerals
were detected. The density slice map (Figure 5) confirms the large ripple part has higher thermal inertia
than the small ripple part. The positive correlation between thermal inertia and olivine abundance (Figure 5
and Table 1) indicates that with the increase of particle size, the olivine abundance increases.
Discussion and Summary: Our results suggest a
positive relationship between olivine abundance and
particle size within the dune fields studied. The high
thermal inertia (larger particle size) portion of the dune
exhibits higher olivine abundance and distinct ripple
forms, whereas the lower thermal inertia portion of the
dune field is relatively olivine poor and morphologically smooth. It is consistent with the observation in “El
Dorado” on Mars [10] that olivine was enriched in the
coarse grains. However, this trend is opposite of what
were observed by [7-9] on Earth.
No hydrated minerals were found within the dune
fields, suggesting chemical weathering has limited effect to the trends. One possibility of the variation of
46th Lunar and Planetary Science Conference (2015)
composition may be heterogeneity of sand source that
specific grain sizes from different basalt composition
were available within the saltation distance of dune.
Alternatively, the sediment sources are from a single
source that contains large olivine pheoncrysts within a
finely crystalline matrix.
References: [1]Blatt, H. et al, 1980, New Jersey.
[2] Boggs, 1995, New Jersey. [3]Weltje, G.J. and Eynatten H., (2004)Sedimentary Geology, 171(1-4), 111.[4]Tolosana-delgado, R. and Eynatten, H. ,
(2009)Math Geosci, 41(8), 869-886. [5] Anderson,
R.S. and Bunas, K.L. (1993) Nature, 365(4480), 740–
745. [6]Makse, H.A. (2000) Eur.Phys.J.E, 1(2-3),
127–135. [7] Mangold N. et al. (2011)EPSL, 310,
233-243. [8] Nesbitt H. W. and Young G.M. (1996)
Sedimentology, 43(2), 341-358. [9] Xu Z et al. (2011)
,J.Geogr.Sci. 21(6), 1062-1076. [10]Sullivan R. et al.
(2008) JGR, 113(E6), E06S07. [11] Bandfield, J.L. et
al. (2000) JGR, 105(E5), 9573–9587. [12] Fergason,
R.L. et al., (2006)JGR, 111, E12004. [13] Christensen
P.R. et al. (2001)JGR, 106(E10), 23823-23871. [14]
Ruff, S.W. and Christensen P.R. (2002)JGR, 107(E12),
23823-23871
1068.pdf
high thermal inertia whereas the small ripple part
shows low thermal inertia.
Figure 3. Color stretch map of THEMIS derived
olivine abundance (A) and spectra of large ripple and
small ripple parts of the dune (B). There is olivine
abundance decrease from the large ripple part to the
small ripple part.
Figure 4. CRISM mafic index map (A) and spectra
of large ripple and small ripple parts of the dune (B).
The stronger index values and stronger absorption near
~1.2µm of large ripple part refer higher olivine abundace or particle size difference.
Table 1. Average olivine abundance of each thermal inertia range.
Color
in Fig. 5
Figure 1. CTX shows geomorphology variation
within an intracrater dune field located at 44.26°E,
42.16°N. B and C show the size variations of ripple
and crescents.
Figure 2. Color stretch map of THEMIS thermal
inertia of the dune field. The large ripple part shows
TI range
TI avg
unit: JM-2s-0.5K-1
Fo60 abun
avg (%)
blue
150-160
155.72
6.48
green
160-170
165.62
7.95
cyan
170-180
175.36
10.42
yellow
180-190
185.27
12.96
purple
190-200
197.12
18.79
red
200-220
208.2
19.69
Figure 5. Density sliced THEMIS thermal inertia
image (A) and scatter plot of thermal inertia vs. olivine
abundance (B). The plot shows that with the increase
of thermal inertia (particle size), the olivine abundance
increases.
© Copyright 2026