
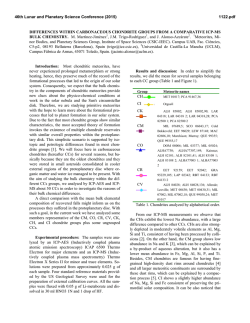
Carbonaceous aerosols recorded in a southeastern Tibetan glacier
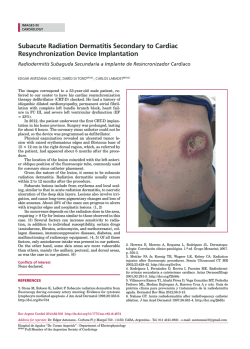
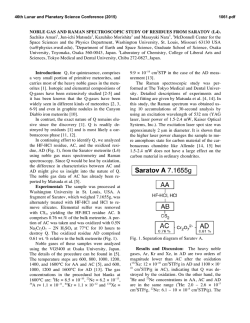
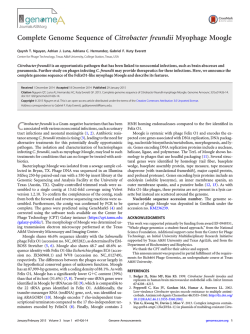
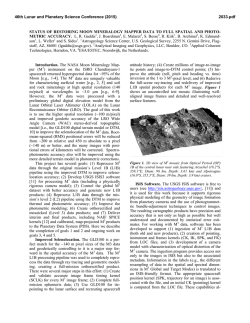
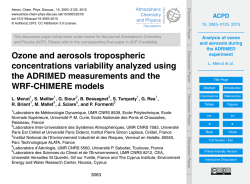
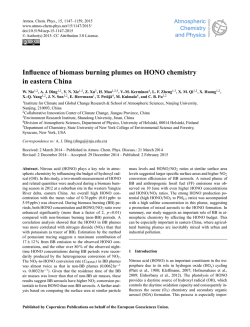
Atmos. Chem. Phys., 15, 1191–1204, 2015
www.atmos-chem-phys.net/15/1191/2015/
doi:10.5194/acp-15-1191-2015
© Author(s) 2015. CC Attribution 3.0 License.
Carbonaceous aerosols recorded in a southeastern Tibetan
glacier: analysis of temporal variations and model estimates
of sources and radiative forcing
M. Wang1,2 , B. Xu1 , J. Cao3 , X. Tie3,4 , H. Wang2 , R. Zhang5,2 , Y. Qian2 , P. J. Rasch2 , S. Zhao3 , G. Wu1 , H. Zhao1 ,
D. R. Joswiak1 , J. Li1 , and Y. Xie1
1 Key
Laboratory of Tibetan Environment Changes and Land Surface Processes, Institute of Tibetan Plateau Research,
Chinese Academy of Sciences, Beijing 100101, China
2 Atmospheric Sciences and Global Change Division, Pacific Northwest National Laboratory (PNNL), Richland, WA 99352,
USA
3 State Key Laboratory of Loess and Quaternary Geology, Institute of Earth Environment, Chinese Academy of Sciences,
Beijing 100085, China
4 National Center for Atmospheric Research, Boulder, CO, 80303, USA
5 Key Laboratory for Semi-Arid Climate Change of the Ministry of Education, College of Atmospheric Sciences, Lanzhou
University, Lanzhou 730000, Gansu, China
Correspondence to: M. Wang ([email protected])
Received: 30 May 2014 – Published in Atmos. Chem. Phys. Discuss.: 31 July 2014
Revised: 17 December 2014 – Accepted: 20 December 2014 – Published: 2 February 2015
Abstract. High temporal resolution measurements of black
carbon (BC) and organic carbon (OC) covering the time period of 1956–2006 in an ice core over the southeastern Tibetan Plateau show a distinct seasonal dependence of BC
and OC with higher respective concentrations but a lower
OC / BC ratio in the non-monsoon season than during the
summer monsoon. We use a global aerosol-climate model,
in which BC emitted from different source regions can be
explicitly tracked, to quantify BC source–receptor relationships between four Asian source regions and the southeastern Tibetan Plateau as a receptor. The model results show
that South Asia has the largest contribution to the presentday (1996–2005) mean BC deposition at the ice-core drilling
site during the non-monsoon season (October to May) (81 %)
and all year round (74 %), followed by East Asia (14 % to the
non-monsoon mean and 21 % to the annual mean). The icecore record also indicates stable and relatively low BC and
OC deposition fluxes from the late 1950s to 1980, followed
by an overall increase to recent years. This trend is consistent with the BC and OC emission inventories and the fuel
consumption of South Asia (as the primary contributor to annual mean BC deposition). Moreover, the increasing trend of
the OC / BC ratio since the early 1990s indicates a growing
contribution of coal combustion and/or biomass burning to
the emissions. The estimated radiative forcing induced by
BC and OC impurities in snow has increased since 1980,
suggesting an increasing potential influence of carbonaceous
aerosols on the Tibetan glacier melting and the availability
of water resources in the surrounding regions. Our study indicates that more attention to OC is merited because of its
non-negligible light absorption and the recent rapid increases
evident in the ice-core record.
1
Introduction
Carbonaceous aerosol, released from fossil fuel, biofuel
and/or biomass combustion, contains both black carbon (BC,
a.k.a. elemental carbon, EC), a strong light absorber, and organic carbon (OC), which also absorbs the near infrared, but
more weakly than BC (Kirchstetter et al., 2004; Bond and
Bergstrom, 2006). Often mixed with other aerosol species,
BC impacts human health, crop yields and regional climate
(Auffhammer et al., 2006; Tie et al., 2009), and is believed to
Published by Copernicus Publications on behalf of the European Geosciences Union.
1192
M. Wang et al.: Carbonaceous aerosols recorded in a southeastern Tibetan glacier
be the second strongest climate warming forcing agent after
carbon dioxide (Jacobson, 2001; IPCC, 2013).
Because of their high population density and relatively
low combustion efficiency, developing countries in South
and East Asia such as India and China are hotspots of carbonaceous aerosol emissions (Ramanathan and Carmichael,
2008). During the cold and dry winter season, haze (heavily loaded with carbonaceous aerosols) builds up over South
Asia, and exerts profound influences on regional radiative forcing (Ramanathan et al., 2007; Ramanathan and
Carmichael, 2008), hydrologic cycles (Menon et al., 2002;
Ramanathan et al., 2005), and likely Himalaya–Tibetan
glacier melting that could be accelerated by the absorption
of sunlight induced by BC in the air and deposited on the
ice and snow surfaces (Ramanathan et al., 2007; Hansen
and Nazarenko, 2004), although BC deposited in snow and
glaciers at some locations may not significantly affect the energy balance (Ming et al., 2013; Kaspari et al., 2014).
Due to the lack of long-term observations of emissions
and concentrations of atmospheric carbonaceous aerosols, it
is difficult to evaluate the effects of BC and OC on historical regional climate and environment before the satellite era.
Some studies have evaluated historical anthropogenic emissions based on the consumption of fossil fuels and biofuels (Novakov et al., 2003; Ito and Penner, 2005; Bond et
al., 2007; Fernandes et al., 2007). While fossil fuel is the
major energy source in the urban areas of South Asia and
East Asia, biomass combustion, such as fuel wood, agricultural residue and dung cake, is prevalent in rural areas (Revelle, 1976; Venkataraman et al., 2010; Streets and Waldhoff,
1998). Biomass burning has been considered as the major
source of black carbon emissions (Reddy and Venkataraman, 2002; Venkataraman et al., 2005). However, as reliable
biomass consumption data are hard to obtain, estimates of
BC and OC emissions from biomass burning are ambiguous
and incomplete.
Measurements of carbonaceous aerosol concentrations in
glacier ice are an ideal means of reconstructing historical
emissions and revealing long-term trends of anthropogenic
aerosol impacts on local climate. Greenland ice-core measurements were previously used to reconstruct the North
American BC emission history and its effects on surface radiative forcing back to the 1880s (McConnell et al., 2007).
Himalayan ice cores retrieved from the Tibetan Plateau have
revealed the mixed historical emissions from South Asia,
Central Asia and the Middle East, and have also been used
to evaluate radiative forcing from BC in snow (Ming et al.,
2008; Kaspari et al., 2011). Using the Snow, Ice, and Aerosol
Radiative (SNICAR) model, Flanner et al. (2007) estimated
an instantaneous regional forcing exceeding 20 W m−2 by
BC in snow/glaciers over the Tibetan Plateau during the
spring season.
By using five ice-core records, Xu et al. (2009a) elucidated an important contribution of BC to the retreat of Tibetan glaciers in addition to greenhouse gases. Due to the
Atmos. Chem. Phys., 15, 1191–1204, 2015
short atmospheric lifetime of carbonaceous aerosols compared to greenhouse gases, emission reductions may be an
effective way to mitigate their warming effects. Thus, it is
particularly important to identify the source regions and the
source types of carbonaceous aerosols observed in Tibetan
glaciers. Xu et al. (2009a) suggested that BC deposited on
the Tibetan Plateau was broadly from Europe and Asia. However, they did not perform in-depth analysis on emissions
from more specific source regions and the source types. In
this study, we use the ice core retrieved from the southeastern
Tibetan Plateau, also known as the Zuoqiupu ice core in Xu et
al. (2009a), to reconstruct the history of atmospheric deposition of carbonaceous aerosols in this glacier, and to characterize emissions and source–receptor relationships with the help
of a global climate model in which BC emitted from different
source regions can be explicitly tracked. We also estimate the
respective contributions from BC and OC to radiative forcing
in the Zuoqiupu glacier using the ice-core measurements and
the SNICAR model.
2
2.1
Methods
Measurements of carbonaceous aerosols in ice cores
Zuoqiupu glacier is in the southeastern Kangri Karpo Mountains, located on the southeastern margin of the Tibetan
Plateau (Fig. 1). In 2007, an ice core of 97 m in depth (9.5 cm
in diameter) was retrieved within the accumulation zone of
Zuoqiupu glacier at 96.92◦ E, 29.21◦ N, 5600 m a.s.l. The ice
core was kept frozen and transported to laboratory facilities
at the Institute of Tibetan Plateau Research (Lhasa branch)
for analysis. The annual accumulation of snow/ice at the
drilling site was around 2 m on average. The oxygen isotope
(δ 18 O) samples were cut at 10 cm internals, and BC and OC
samples at 10–25 cm, resulting in 18 and 9 samples per year
on average, respectively. Thus, this ice core provided a high
temporal resolution of δ 18 O and BC and OC concentrations.
BC and OC concentrations were measured by using a Desert
Research Institute (DRI) Model 2001 thermal/optical carbon
analyzer following the IMPROVE TOR protocol (Chow et
al., 1993; Chow and Watson 2002; Cao et al., 2008). Note
that, according to the thermal/optical measurement method,
the analytical result is technically called “EC”. Herein we
use “BC” to be consistent with the notation in our model
simulations and in the literature. The reported OC concentrations from the ice-core measurements can only account for
the water-insoluble part of OC in the ice samples because
most of the water-soluble part cannot be captured by the
filter-based method applied to liquid samples (melted from
the ice). Further details on the analysis methods, ice-core dating and calculation of BC and OC seasonal deposition fluxes
can be found in Xu et al. (2009a).
www.atmos-chem-phys.net/15/1191/2015/
M. Wang et al.: Carbonaceous aerosols recorded in a southeastern Tibetan glacier
1193
Figure 1. Site location of Zuoqiupu glacier (top): black circle represents the location of Zuoqiupu glacier, and warm colors indicate high
elevations over the Tibetan Plateau. Detailed elevation contours of the Zuoqiupu glacier are shown in the bottom panel. Red circle marks the
ice-core drilling site.
2.2
Model and experimental setup
We use the Community Atmosphere Model version 5
(CAM5; Neale et al., 2012) to help understand the emissions,
transport and dry/wet deposition of carbonaceous aerosols
in the atmosphere. In the default three-mode modal aerosol
scheme of CAM5 used for this study, BC and primary OC
are emitted into an accumulation size mode, where they immediately mix with co-existing hygroscopic species such as
sulfate and sea salt (Liu et al., 2012). Hygroscopic aerosol
particles in the accumulation mode are subject to wet removal by precipitation. Recent model improvements to the
representation of aerosol transport and wet removal in CAM5
by H. Wang et al. (2013) have substantially improved the
model prediction of global distribution of aerosols, particularly over remote regions away from major sources. To minimize the model biases in simulating meteorological conditions and, particularly, circulations that are critical to aerosol
transport, we configure the CAM5 model to run in an ofwww.atmos-chem-phys.net/15/1191/2015/
fline mode (Ma et al., 2013) with wind, temperature, surface fluxes and pressure fields constrained by observations.
However, cloud/precipitation fields and interactions between
aerosol and clouds are allowed to evolve freely. A source tagging technique has recently been implemented in the CAM5
model to allow for explicit tracking of aerosols emitted from
individual source regions and, therefore, to assist in quantitatively characterizing source–receptor relationships (Wang
et al., 2014). This tagging technique along with the CAM5
model is used in the present study to do source attribution for
carbonaceous aerosols deposited onto the Zuoqiupu glacier.
We conducted an 11-year (1995–2005) CAM5 simulation
on a horizontal grid spacing of 1.9◦ × 2.5◦ and 56 vertical levels, with prescribed sea surface temperatures and sea
ice distribution. Reanalysis products from NASA’s ModernEra Retrospective Analysis for Research and Applications
(MERRA) (Rienecker et al., 2011) are used to constrain
the meteorological fields of CAM5. For aerosols (includ-
Atmos. Chem. Phys., 15, 1191–1204, 2015
1194
M. Wang et al.: Carbonaceous aerosols recorded in a southeastern Tibetan glacier
ing OC, BC and other important species), we use the year2000 monthly mean emissions described by Lamarque et
al. (2010) that have been used in many global climate models for present-day climate simulations, included in the fifth
assessment report (AR5) by the Intergovernmental Panel on
Climate Change (IPCC). The monthly mean emissions are
repeatedly used for each year in the 11-year simulation. Note
that we do not intend to design the model experiment to
simulate the whole historical record of BC in the ice core,
but rather for a period of time to demonstrate the impact
of meteorology (and the associated transport and removal of
aerosols) on the seasonal dependence of BC deposition in the
target region and the lack of a longer-term trend in deposition
without considering the temporal variation of emissions.
As the ice-core drilling site was located in a remote and
elevated area over the southeastern Tibetan Plateau, local
emissions are minimal. Deposition of carbonaceous aerosols
is most likely contributed by the non-local major emission
sources (e.g., distributions of mean BC emissions during
non-monsoon and monsoon seasons shown in Fig. 2) in
South Asia and East Asia. These two regions, along with
Southeast Asia and Central Asia, are identified as the potential source contributors. Thus, BC emissions from the four
regions and the rest of the world are explicitly tracked in the
CAM5 simulation.
3
3.1
Results and discussion
Seasonal dependence of carbonaceous aerosols
BC and OC concentrations in the Zuoqiupu ice core both exhibit statistically significant seasonal variations corresponding to the stable oxygen isotope variability, which shows high
values during the winter and low values during the summer (Xu et al., 2009a). As shown in Fig. 3, concentrations
of BC and OC have distinct differences between the summer monsoon and non-monsoon seasons. Seasonally varying emissions and meteorological conditions that determine
the transport pathways of BC and OC emitted from major
sources, removal during the transport, and local precipitation
rate, can cause the seasonal variations of BC and OC in ice
at the sampling site. The seasonal dependence of BC and OC
in ice cores is consistent with available observations of atmospheric aerosols on the southern slope of the Himalayas and
the southeastern Tibetan Plateau, where the high concentration of carbonaceous aerosols during the cold and dry season
suggested an association with the South Asian haze (Cong et
al., 2009; Marinoni et al., 2010; Kaspari et al., 2011; S. Zhao
et al., 2013; Z. Zhao et al., 2013). The consistency between
the seasonal dependence of airborne BC and OC concentrations and the seasonal variation of ice-core measurements indicates that seasonal differences in precipitation rates at the
sampling location are less likely to be the determining factor. Our model results (details discussed in Sect. 3.2) suggest
Atmos. Chem. Phys., 15, 1191–1204, 2015
that the seasonal dependence of BC deposition flux in the
target region could be mainly due to meteorological conditions that determine the transport pathways (and associated
wet removal processes during the transport). The small seasonal contrasts in BC emissions from the major source regions (see Table 1) that are used in the model simulation do
not seem to be able to explain the large seasonal difference
in BC deposition, although the BC emissions are known to
have large uncertainties.
Our further analysis shows that the ratio of OC to BC
also has clear seasonal dependence. In Fig. 3, the slope of
the fitted line to measured OC vs. BC concentrations during
monsoon season is ∼ 6.3, which is twice the slope for nonmonsoon season (∼ 3.2). The analysis of covariance (ANCOVA) for slope differences of single linear regressions of
OC against BC between monsoon and non-monsoon seasons
indicates that the seasonal dependence of the relationship between the concentrations of OC and BC is significant (at the
0.05 significance level). This also agrees with measurements
derived from the ice core drilled from the Palong-Zanbu No.
4 glacier (Xu et al., 2009b) and in atmospheric samples collected from Lulang, southeastern Tibetan Plateau (Z. Zhao
et al., 2013). The seasonal dependence of the OC / BC ratio can possibly be derived from the seasonal sources of
carbonaceous particles, circulation strength, transport pathways, and/or atmospheric deposition processes. Compared
to the respective BC and OC concentrations, the seasonal
dependence of the OC / BC ratio is less straightforward to
understand. Circulation patterns together with wet removal
processes still determine the transport pathways of emissions from major BC and OC source regions to the sampling
site, which however are less likely to change the OC / BC
ratio from certain sources. Therefore, it is more plausible
due to seasonally dependent contributions from source regions and/or emission sectors (including fuel types, quantity,
and combustion conditions). Cao et al. (2005) found that the
average OC / BC ratios measured from plumes of residential biomass burning and coal combustion are substantially
higher than from vehicle exhaust. The higher OC / BC ratio
during summer monsoon might indicate more contributions
from biomass and/or coal burning than fossil fuel combustion.
3.2
Source attribution
To attribute the source of BC at the drilling site (as a receptor
region) quantitatively, we use the CAM5 model with the BC
source tagging capability to conduct an 11-year simulation,
with the last 10 years (1996–2005) used for analysis. The
surrounding area is divided into four source regions (see Table 1 and Fig. 4): South Asia, East Asia, Southeast Asia and
Central Asia. BC emissions from each of the four regions and
the rest of the world are explicitly tracked, so that the fractional contributions by emissions from the individual source
regions to BC deposition in the receptor region can be explicwww.atmos-chem-phys.net/15/1191/2015/
M. Wang et al.: Carbonaceous aerosols recorded in a southeastern Tibetan glacier
1195
Figure 2. 10-year (1996–2005) mean wind vectors (denoted by arrows) at 500 hPa (a, b) and the surface (c, d) during the summer monsoon
(June–September; (a, c)) and non-monsoon seasons, October–May, (b, d) from MERRA reanalysis data sets used to drive the CAM5 simulation. 500 hPa geopotential height (units: 10 m) contours with an interval of 60 m and mean sea-level pressure (units: hPa) contours with an
interval of 4 hPa are superimposed on panels (a, b) and (c, d), respectively. The background colors show mean BC emission rates based on
the IPCC present-day scenario for the corresponding months. The small black box marks the model grid cell in which the ice-core drilling
site resides.
Table 1. Source regions (South Asia, East Asia, Southeast Asia, and Central Asia) and corresponding monthly mean BC emissions (Tg a−1 )
and fractional contributions (%) to BC deposition flux at the Zuoqiupu site in monsoon (June–September), non-monsoon (October–May),
and all months during 1996–2005.
Source regions
Latitude
Longitude
South Asia
East Asia
Southeast Asia
Central Asia
5–35◦ N
15–50◦ N
0–15◦ N
35–50◦ N
50–95◦ E
95–150◦ E
95–130◦ E
50–95◦ E
Monsoon
Contribution
38.51
56.24
0.05
2.62
itly calculated. Figure 4 shows the spatial distribution of fractional contribution from the four source regions. BC deposition at the drilling site (indicated by the black box in Fig. 4),
which has a consistent seasonal dependence (i.e., more during the non-monsoon season; Fig. 5) with ice-core measurements, is predominately (over 95 %) from South Asia and
East Asia. The seasonal dependence of BC deposition is also
consistent with a recent regional climate modeling study on
www.atmos-chem-phys.net/15/1191/2015/
Non-monsoon
Emission
0.65
1.75
0.28
0.11
Contribution
81.26
13.91
0.16
0.86
Emission
0.74
1.90
0.33
0.09
Annual
Contribution
74.48
20.66
0.15
1.14
Emission
0.71
1.85
0.31
0.10
BC deposition on the Himalayan snow cover from 1998 to
2008 (Ménégoz et al., 2014).
The 10-year (1996–2005) average wind fields (at the surface and 500 hPa from MERRA reanalysis data sets), as
shown in Fig. 2, indicate distinct circulation patterns during
the summer monsoon (June–September) and non-monsoon
(October–May) seasons, which in part determine the seasonal dependence of transport of aerosols emitted from the
Atmos. Chem. Phys., 15, 1191–1204, 2015
1196
M. Wang et al.: Carbonaceous aerosols recorded in a southeastern Tibetan glacier
80
Monsoon
Non-monsoon
70
OC (ng g-1)
60
50
OC = 6.31BC - 3.41
R = 0.72
40
30
20
OC = 3.17BC + 0.29
R = 0.69
10
0
0
2
4
6
8
10
BC (ng g-1)
12
14
16
18
Figure 3. Scatterplots for yearly monsoon and non-monsoon mean
OC and BC concentrations during 1956–2006, obtained from the
ice-core measurements, and corresponding linear regressions.
different major sources. During the non-monsoon season, a
strong westerly dominates the transport from west to east at
all levels. Emissions from northern India and Central Asia
can have an influence on BC in the direct downwind receptor region over the southeastern Tibetan Plateau. During the
summer monsoon season, the westerly moves northward, and
the monsoon flow from the Bay of Bengal at the surface and
middle levels (e.g., 500 hPa), coupled with the monsoon from
the Indochina peninsula and the South China Sea, exert an influence on BC in the receptor area. The strong monsoon precipitation removes BC from the atmosphere during the transport. The high Himalayas can partly block the further transport of emissions from South Asia to the Tibetan Plateau, although small local topographical features such as the Yarlung
Tsangpo River valley can provide a gate for the pollution
to enter the inner Tibetan Plateau (Cao et al., 2010). Elevated emissions from the west (or the northern part of South
Asia) can take the pathways at middle and upper levels, but
they have minimal contribution to deposition. Therefore, BC
emissions from East Asia play a relatively more important
role in affecting deposition at the Zuoqiupu site during the
monsoon season.
The fractional contributions to 10-year mean BC deposition at the drilling site from the four tagged regions are
summarized in Table 1. Results show that South Asia is the
dominant contributor (∼ 81 %) during the non-monsoon season with ∼ 14 % from East Asia, while the contribution of
East Asia (∼ 56 %) is larger than that of South Asia (∼ 39 %)
during the monsoon season. For the annual mean BC deposition, South Asia (∼ 75 %) is the biggest contributor, followed by East Asia (∼ 21 %). Emissions from the Central
Asia and Southeast Asia regions have much smaller contributions (< 3 %) for all seasons. These results agree well with
the short-term source attribution study by Lu et al. (2012)
Atmos. Chem. Phys., 15, 1191–1204, 2015
using the Hybrid Single-Particle Lagrangian Integrated Trajectory (HYSPLIT) model.
For comparison, seasonal and annual mean BC emissions
from the individual tagged source regions are also included
in Table 1. Apparently, the contrast in strengths of regional
emissions alone cannot explain their relative contributions to
BC deposition at the sampling site, and the small seasonal
variations in emissions are unlikely to be the cause of seasonal dependence of source attribution. Note that the BC
emission inventory (Lamarque et al., 2010) used in CAM5
does not consider seasonal variations in anthropogenic emissions, which is likely to have introduced biases in the quantitative model estimates of seasonal dependence of contributions, but the relative importance of source regions should be
robust.
3.3
Interannual variations and long-term trend
Based on annual snow accumulation and BC and OC concentrations derived from the ice-core record, the annual BC and
OC deposition fluxes can be estimated, which are then used
to examine the interannual variations and long-term trend
in the fluxes and the ratio of OC / BC, as well as the relationship with emissions from the major contributor. As illustrated in Fig. 6, from the late 1950s to 1980, the BC and OC
fluxes in the Zuoqiupu ice core are relatively low and stable
in comparison to those after 1980. During the period 1956
to 1979, average fluxes are 9.1 and 28.7 mg m−2 a−1 for BC
and OC, respectively. Both BC and OC fluxes began to show
increasing trends from the early 1980s. These trends continued in the early 1990s, but started to drop in the mid-1990s,
reaching a minimum in 2002 followed by a rapid increase.
In 2006, BC and OC fluxes are 19.2 and 93.9 mg m−2 a−1 ,
respectively, which are 2 and 3 times the respective average
fluxes before 1980. The 5-year average OC / BC flux ratio is
steady before 1990; however, it shows a continual increase
afterwards and has been higher than the average value (3.2)
for the period of 1956–1979 since the mid-1990s (Fig. 6).
The 10-year CAM5 model simulation, in which annual emissions are fixed but meteorological conditions vary, shows no
increasing trend in BC and OC deposition fluxes (BC deposition shown in Fig. 5), indicating that the increasing trend
seen in the observations was not due to changes in meteorology.
As shown in the CAM5 model simulation, the annual
mean atmospheric deposition of BC over the southeastern Tibetan Plateau is mostly contributed by emissions from South
Asia, particularly in the non-monsoon season. The BC and
OC deposition fluxes derived from the ice-core measurements may reflect changes in South Asian emissions to some
extent. The temporal variations of BC and OC deposition
fluxes (see Fig. 6) are compared with the primary BC and
OC emissions from fossil fuel and biofuel combustion in
South Asia during 1955–2000 (Bond et al., 2007). BC and
OC emissions during 1996–2010 from Lu et al. (2011) are
www.atmos-chem-phys.net/15/1191/2015/
M. Wang et al.: Carbonaceous aerosols recorded in a southeastern Tibetan glacier
1197
Figure 4. Spatial distributions of fractional contribution from the four source regions (South Asia, East Asia, Southeast Asia, and Central
Asia) to monsoon, non-monsoon, and annual mean BC deposition fluxes during 1996–2005. The large black boxes indicate the boundary of
source regions, and the small black box marks the model grid cell where the Zuoqiupu drilling site is located. Color in the small black box
in each panel corresponds to the fraction contribution to BC deposition at the sampling site. Exact percentage contributions are provided in
Table 1.
-2
-1
BC Flux (mg m a )
160
140
120
100
80
y = 0.03x + 57.3
60
40
20
19
95
19 NM
19 96
96 M
19 NM
19 97
97 M
19 NM
19 98
98 M
19 NM
19 99
99 M
20 NM
20 00
00 M
20 NM
20 01
01 M
20 NM
20 02
02 M
20 NM
20 03
03 M
20 NM
20 04
04 M
20 NM
05
M
0
OC (Fig. 6). The OC / BC emission ratio also shows an increasing trend from the late 1990s to 2003, which is consistent with that of the OC / BC ratio in the ice-core record.
The annual mean aerosol index over industrial and populated
cities in the northern part of India increased from 1982 to
1993 and more significantly from 2000 to 2003 (Sarka et al.,
2006). This trend is similar to that of carbonaceous aerosols
in the ice-core record, and it might indicate a causal relationship between BC and OC over the southeastern Tibetan
Plateau and emissions from the northern part of South Asia.
Time
Figure 5. Seasonal dependence (“NM” for non-monsoon season
and “M” for monsoon season) of BC deposition flux at the Zuoqiupu site from 1995 to 2005 simulated in CAM5. The dashed line
represents a linear regression of all data points.
also illustrated in Fig. 6 to extend the emission data to cover
the entire time period that the ice-core data span. Note that
the emission data from Lu et al. (2011) are only for India, which is the largest energy consumer and carbonaceous
aerosol-emitting country in South Asia. There are differences
between the emissions of Bond et al. (2007) and Lu et al.
(2011) during the overlap time period (1996–2000). However, good agreements on the increasing trend can be found
in the respective deposition fluxes and emissions of BC and
www.atmos-chem-phys.net/15/1191/2015/
3.4
Emission source analyses
BC and OC in the atmosphere are co-emitted from a variety of natural and anthropogenic sources, including combustion of fossil fuel, biofuel and/or biomass burning. In general,
open biomass burning typically produces more abundant OC
(i.e., a larger OC / BC ratio) compared to fossil fuel combustion due to a lower process temperature (Ducret and Cachier,
1992). The OC / BC ratio has often been used to discriminate
fossil fuel combustion and biomass burning emissions as the
source for particles in the atmosphere and in precipitation
(Novakov et al., 2000; Stone et al., 2007; Ducret and Cachier,
1992; Xu et al., 2009b). For example, Cao et al. (2005) collected particulate matter samples from the plumes of residential biomass burning, coal combustion, and motor-vehicle
Atmos. Chem. Phys., 15, 1191–1204, 2015
M. Wang et al.: Carbonaceous aerosols recorded in a southeastern Tibetan glacier
3.2
4
2.8
2.6
2
2.4
2100
80
1800
1500
60
40
20
1200
900
28.7
0
1950
600
300
1960
1970
1980
1990
2000
800
-1
-1
1000
25
20
600
15
10
2010
Year
400
9.1
5
200
0
0
250
Consumption
2400
100
OC Flux (mg m a )
120
-1
2.2
-2
1
30
-1
3
3.0
3.2
OC Emissions (Gg a )
OC/BC
5
-2
3.4
BC Flux (mg m a )
3.6
OC/BC of Emissions
6
BC Emissions (Gg a )
1198
200
Coal (Million tons oil equivalent a-1)
Oil (Million tons a-1)
150
100
50
0
1950
1960
1970
1980
1990
2000
2010
Year
Figure 6. Time series of annual (dotted line with circles) and 5-year averaged (solid line) OC / BC ratios (top left), BC (top right) and OC
deposition fluxes (bottom left) based on the Zuoqiupu ice-core measurements for the time period of 1956–2006. The average values of the
OC / BC ratio, BC and OC during 1956–1979 are marked by dashed lines. BC and OC emissions in South Asia (Bond et al., 2007) and the
corresponding OC / BC emission ratios are illustrated with gray triangles, and with red diamonds for emissions in India (Lu et al., 2011).
Coal and oil consumption data are shown in the bottom-right panel (BP Group, 2009).
exhaust sources, and analyzed OC and BC with a DRI thermal/optical carbon analyzer (Model 2001). They reported average OC / BC ratios of 60.3, 12.0, and 4.1 for biomass burning, coal combustion and vehicle exhaust, respectively. The
increasing OC / BC ratios based on the ice-core measurements since the early 1990s (Fig. 6) suggest expanded coal
consumption and/or usage of biomass fuel, although the ratios might have been underestimated, because water-soluble
OC was not captured in the sample analyses. However, such
bias would have occurred in all the samples and had little impact on the trend, unless including water-soluble OC could
dominate the temporal variation of the OC / BC ratio. Otherwise, our results indicate that the relative contribution of
coal combustion and biomass burning to the carbonaceous
particles deposited into the ice core in the southeastern Tibetan Plateau has been increasing faster than the contribution
of fossil fuel combustion since the early 1990s. Improved
combustion technologies may have reduced both BC and OC
emissions from the combustion of the same amount of fuels,
but the influence on the OC / BC ratio is unclear. Presumably, improved combustion technologies after 1990 in South
and East Asia did not dominate the OC / BC ratio.
The temporal variations of BC and OC in the Zuoqiupu ice
core, along with the source attribution analysis of the CAM5
model results, suggest an increasing trend in emissions and
altered emission sources in South Asia during the late twentieth century. Coal has been the primary energy source in
South Asia. For example, in India, coal accounted for 41 %
of the total primary energy demand in 2007, followed by
Atmos. Chem. Phys., 15, 1191–1204, 2015
biomass (27 %) and oil (24 %) (IEA, 2009). The consumption data of coal and crude oil in South Asia (BP Group,
2009) is compared with the BC and OC fluxes in Fig. 6 (bottom right). Coal consumption had an increasing trend from
1965 to 2008, particularly in the two time periods 1980–1995
and 2003–2008 after a leveling off during 1996–2002. This
trend is consistent with the variations of BC and OC deposition fluxes in the Zuoqiupu ice core. The correlations between coal consumption and BC (R 2 = 0.43, p< 0.001) and
OC (R 2 = 0.62, p< 0.001) in the ice core are both statistically significant. The oil consumption had a comparable increasing trend as coal before it slowed down during 2000–
2006.
Biomass is the second largest energy resource in South
Asia, and it is essential in rural areas. In India, 70 % of
the population lives in rural areas, and depends substantially on solid fuels (i.e., firewood, animal dung, and agriculture residues) for cooking and heating (Heltberg et al.,
2000). Even in urban areas, biomass contributes 27 % of
the household cooking fuel (Venkataraman et al., 2010).
Although the consumption of biomass is lower than coal,
the OC / BC emission ratio for biomass burning is much
higher than from coal combustion (60.3 vs. 12.0) (Cao et
al., 2005). The BC emission factor for biomass burning
(varying from 0.48 ± 0.18 g kg−1 for savanna and grassland
burning to 1.5 g kg−1 for charcoal burning) is also generally higher than that for coal (0.2 g kg−1 for most combustion conditions) and oil combustion (0.3 g kg−1 on average,
varying from 0.08 g kg−1 for heavy fuel oil to 0.66 g kg−1
www.atmos-chem-phys.net/15/1191/2015/
M. Wang et al.: Carbonaceous aerosols recorded in a southeastern Tibetan glacier
for diesel) (Andreae and Merlet, 2001; Bond et al., 2004,
2007). Therefore, it is very likely that the OC / BC ratio of
atmospheric carbonaceous aerosols and in the ice-core samples (Fig. 6) was dominated by biomass burning emissions.
Previous studies have concluded that carbonaceous aerosol
emissions from biomass burning are the largest source in
South Asia (Venkataraman et al., 2005; Gustafsson et al.,
2009). A general increase in energy-intensive lifestyles associated with the accelerated growth of population and economy put pressure on energy resources, and induced energy
transitions and the use of non-sustainable biomass in South
Asia (Sathaye and Tyler, 1991; Pachauri, 2004; Fernandes et
al., 2007). For instance, biofuel consumption in South Asia
increased by 21 % per decade on average during 1950–2000
(Bond et al., 2007; Fernandes et al., 2007). In addition, fuel
wood, a more desirable biofuel option, contributed 68 % in
1978 to total energy demand by rural populations in India,
and increased to 78 % in 2000 (Fernandes et al., 2007).
3.5
Radiative forcing induced by carbonaceous
aerosols in Tibetan glaciers
BC is often the most important light-absorbing impurity in
surface snow because of its strong absorption of solar radiation. The effect of BC in snow on surface albedo reduction
and the resultant positive radiative forcing have been widely
addressed and reported (e.g., Warren and Wiscombe, 1980;
Clarke and Noone, 1985; Hansen and Nazarenko, 2004;
Hadley and Kirchstetter, 2012; Flanner et al., 2007; 2009;
McConnell et al., 2007; Ming et al., 2008; Kaspari et al.,
2011; Qian et al., 2011, 2014, 2015). In contrast, the impact of OC in snow has not been widely assessed because of
its relatively weak light absorption over the entire spectrum
compared to BC, and because of large uncertainties associated with OC light-absorbing properties and measurements
of OC in snow. However, there has been increasing interest
in light-absorbing OC (a.k.a. brown carbon) and its radiative
effect in both the atmosphere and snow. A growing number of
studies (e.g., Kirchstetter et al., 2004; Andreae and Gelencsér, 2006; Hoffer et al., 2006; Yang et al., 2009; Kirchstetter
and Thatcher, 2012) have reported that airborne brown carbon can contribute significantly to aerosol light absorption
in the atmosphere, although there are still substantial uncertainties in quantifying optical properties of brown carbon,
which makes the model estimation of OC radiative forcing
difficult. Similarly, the importance of OC absorption in snow
has been recognized and suggested for inclusion in modeling aerosol snow-albedo effects (e.g., Flanner et al., 2009;
Aoki et al., 2011). Observational analysis of light-absorbing
particles in Arctic snow reported that the main non-BC component is brown carbon, which accounted for 20–50 % of the
visible and ultraviolet absorption (Hegg et al., 2009, 2010;
Doherty et al., 2010). In the rural area of central northern
China, brown carbon in winter snow also played an important role in visible light absorption, which contributed about
www.atmos-chem-phys.net/15/1191/2015/
1199
60 % to light absorption at 450 nm and about 40 % at 600 nm
(X. Wang et al., 2013). A more recent observational study
by Dang and Hegg (2014) quantified the light absorption by
different light-absorbing particulates in snow, and suggested
that humic-like substances and polar OC contributed 9 and
4 % to the total light absorption, respectively. Despite the
substantial uncertainties in brown carbon optical properties,
a recent global modeling study (Lin et al., 2014), in which a
range of optical properties of brown carbon taken from the
literature were applied to OC-in-snow concentrations simulated in a global chemical transport model, showed that the
global OC forcing in land snow and sea ice is up to 24 % of
that caused by BC. Thus, the contribution of OC in snow to
the surface albedo reduction is likely to be important, which
has also been considered in recent climate modeling studies
(Qian et al., 2015).
In this study, we use the SNICAR online model (available
at http://snow.engin.umich.edu/; Flanner et al., 2007) to estimate radiative forcing induced by the observed BC as if they
were present in snow. A detailed description of the SNICAR
model has been documented by Flanner and Zender (2005,
2006) and Flanner et al. (2007). Here we only briefly describe the setup of input parameters required for running the
SNICAR model. A mass absorption cross section (MAC) of
7.5 m2 g−1 at 550 nm for uncoated BC particles (Bond and
Bergstrom, 2006) is assumed to be same as the default value,
and thus one of the input parameters for adjusting the MAC
value in the online SNICAR model, the MAC scaling factor, is set to 1. According to the previous studies (Cuffey and
Paterson, 2010; Wiscombe and Warren 1980) and measurements in the Qiyi glacier and the Zuoqiupu glacier, an effective radius of 100 µm with a density of 60 kg m−3 for new
snow, and an effective radius of 400 µm with a density of
400 kg m−3 for aged snow, are adopted for the forcing calculation. As we focus on the estimation of radiative forcing by
carbonaceous particles, other impurity contents, such as dust
and volcanic ash, are set to zero. The annual mean BC concentration during 1956–1979 was 4.4 ng g−1 , and increased
to 12.5 ng g−1 in 2006. As a consequence, the annual mean
radiative forcing induced by BC in snow, as calculated by the
SNICAR model, nearly proportionally increases from 0.75
to 1.95 W m−2 . Our estimate of mean BC forcing is lower
than the estimated Eurasian radiative forcing (2.7 W m−2 ) in
spring (Flanner et al., 2009), but it is comparable to that in the
East Rongbuk glacier over the Himalayas, which was in the
range of 1–2 W m−2 (Ming et al., 2008). Kaspari et al. (2009)
reported a threefold increase in radiative forcing from BC in
snow over the Himalayas after 1975, which is consistent with
the increasing trend in our results.
The SNICAR model currently does not support the calculation of OC-in-snow forcing in the same way as that
for BC due to a lack of reliable OC optical properties that
span the dimensions of snow grain size and OC particle
size (M. Flanner, personal communication, 2014). We take
a MAC value of 0.6 m2 g−1 at 550 nm for OC (KirchstetAtmos. Chem. Phys., 15, 1191–1204, 2015
1200
M. Wang et al.: Carbonaceous aerosols recorded in a southeastern Tibetan glacier
ter et al., 2004), and assume a constant factor of 0.08 (i.e.,
0.6/7.5) to scale down MAC values of BC at all wavelengths to obtain a first-order guess of OC-in-snow forcing
using SNICAR. The estimated OC forcing has a fourfold
increase from 0.2 W m−2 (for a mean OC concentration of
13.8 ng g−1 during 1956–1979) to 0.84 W m−2 (for a mean
OC concentration of 61.3 ng g−1 in 2006), which are 27 and
43 % of the corresponding BC-in-snow forcing, respectively.
The OC / BC forcing ratios based on our simple guesses are
larger than the upper bound of the estimates (i.e., 24 %) by
Lin et al. (2014).
Two main assumptions could have caused our first-order
estimate of OC forcing to have large biases. First, the MAC
value of 0.6 m2 g−1 (at 550 nm) was based on OC extracted from biomass burning samples that tends to have
a higher absorption efficiency than OC emitted from fossil
fuel combustion (Kirchstetter et al., 2004). This may cause
an overestimation of OC forcing. Second, we treated all the
water-insoluble OC from the ice-core measurements as lightabsorbing brown carbon in the forcing estimation, which also
likely results in an overestimation of OC forcing if a significant fraction of OC is non-absorbing. However, the watersoluble part, accounting for about half of OC observed in
the Manora peak and northwestern India (Ram et al., 2010;
Rajput et al., 2014), can also contribute to some absorption
of UV and visible light (Chen and Bond, 2010; Beine et al.,
2011). Thus, the absorption by water-soluble OC that was
not included in the forcing estimate may compensate for the
high bias to some extent. According to a laboratory study by
Chen and Bond (2010), a large fraction of absorbing OC from
hard wood burning is water-insoluble. As water-insoluble
OC recorded in the ice core herein was very likely dominated by biomass burning emissions (Sect. 3.4), the second
assumption we used here may not cause a huge bias in estimating OC forcing in snow.
It is also important to note that we did not consider variations in chemical compounds of OC, the changes in OC during sample filtration, and the different spectral dependence of
OC and BC absorption. Although such uncertainties can also
cause bias in the estimation of OC radiative forcing herein,
the increasing trend should be robust.
BC and OC concentrations in the ice core increased
rapidly after 1980, and the induced radiative forcing rose as a
consequence. According to the estimates using the SNICAR
model, the average BC radiative forcing had increased 43 %
after 1980, and OC radiative forcing had an increase of 70 %.
These numbers are by no means accurate, but the stronger increasing trend in the ice-core recorded OC than in BC during
1990–2006 (Fig. 6) suggests that the contribution of OC to
the total radiative forcing in the glacier induced by snow/ice
impurities deserves more attention.
Atmos. Chem. Phys., 15, 1191–1204, 2015
4
Summary and conclusions
Light-absorbing carbonaceous aerosols can induce significant warming in the atmosphere and in snow and glaciers,
which likely accelerates the melting of glaciers over the
Himalayas and the Tibetan Plateau. Ice-core measurement
of carbonaceous aerosols is a useful mechanism for evaluating historical emission inventories and revealing longterm changes in anthropogenic aerosols and their impacts
on regional climate. In this study, we analyze carbonaceous
aerosols recorded in an ice core (97 m in depth and 9.5 cm
in diameter) retrieved from the Zuoqiupu glacier (96.92◦ E,
29.21◦ N, 5600 m above sea level) in the southeastern Tibetan Plateau for their seasonal dependence and long-term
trend. The glacier has a unique geographical location that is
in close proximity to major Asian emission sources. With
the help of a global climate model (CAM5) in which black
carbon (BC) emitted from different source regions can be
explicitly tracked, we are able to characterize BC source–
receptor relationships between four Asian source regions
(i.e., South Asia, East Asia, Southeast Asia and Central Asia)
and the Zuoqiupu glacier area as a receptor. We also estimate the radiative forcing in snow due to BC and OC using
the ice-core measurements and an offline snow–ice–aerosol–
radiation model (called SNICAR).
BC and OC concentrations in small segments of the Zuoqiupu ice core were measured using a thermal-optical method.
Ice-core dating based on significant seasonal variations of
oxygen isotope ratios (δ 18 O) was used to construct the time
series of BC and OC concentrations, which turned out to
span the time period of 1956–2006. Not only do the concentrations of OC and BC in the ice core exhibit significant
differences between the summer monsoon and non-monsoon
seasons, which is likely due to changes in transport pathways
and wet removal, but the ratio of OC to BC also shows a clear
seasonal dependence that might be due to seasonal change in
contributions from source regions and/or emission sectors.
The CAM5 results show a similar seasonal dependence of
BC and OC deposition onto the glacier.
The MERRA reanalysis products used to drive the CAM5
model simulation show distinct circulation patterns during
the summer monsoon (June–September) and non-monsoon
(October–May) seasons. Both the circulation patterns (and
the associated aerosol transport and wet removal) and seasonal variation of emissions in major source regions influence the seasonal deposition of aerosol at the Zuoqiupu
site. The CAM5 simulation with tagged BC regional sources
shows that South Asia is the dominant contributor (81 %) to
the 10-year mean BC deposition at the Zuoqiupu site during
the non-monsoon season, with 14 % from East Asia, while
the contribution of East Asia (56 %) is larger than that of
South Asia (39 %) during the monsoon season. For the annual mean BC deposition, South Asia (75 %) is the biggest
contributor, followed by East Asia (21 %).
www.atmos-chem-phys.net/15/1191/2015/
M. Wang et al.: Carbonaceous aerosols recorded in a southeastern Tibetan glacier
The annual mean BC and OC deposition fluxes into the ice
core are also estimated to explore the interannual variations
and long-term trends. Results show stable and relatively low
BC and OC fluxes from the late 1950s to 1979, followed by
a steady increase through the mid-1990s. A more rapid increase occurred after the minimum in 2002. The BC and OC
deposition fluxes in 2006 were 2 and 3 times the respective
average before 1980.
The overall increasing trend in deposition fluxes since
1980 is consistent with the BC and OC emissions in South
Asia as the major contributor. Moreover, the increasing trend
of the OC / BC ratio since the early 1990s indicates a growth
of the contribution of coal combustion and/or biomass burning to the carbonaceous aerosol emissions in the major contributing source regions, which is consistent with the trends
in the consumption of coal, oil and biomass in South Asia.
Our offline calculation using the SNICAR model shows a
significant increase in radiative forcing induced by the observed BC and OC in snow after 1980, which has implications for the Tibetan glacier melting and availability of water
resources in the surrounding regions. More attention to OC
is merited because of its non-negligible light absorption and
the recent rapid increases evident in the ice-core record.
Acknowledgements. This work was supported by the China
National Funds for Distinguished Young Scientists and the National Natural Science Foundation of China, including 41125003,
41101063, and 2009CB723901. H. Wang, Y. Qian and P. J. Rasch
were supported by the US Department of Energy (DOE), Office
of Science, Biological and Environmental Research as part of the
Earth System Modeling program. R. Zhang acknowledges support
from the China Scholarship Fund. PNNL is operated for DOE by
Battelle Memorial Institute under contract DE-AC05-76RLO1830.
The National Center for Atmospheric Research is sponsored by the
National Science Foundation. We thank Z. Guo and S. Yang for
providing the observations of snow.
Edited by: X. Xu
References
Andreae, M. O. and Gelencsér, A.: Black carbon or brown carbon? The nature of light-absorbing carbonaceous aerosols, Atmos. Chem. Phys., 6, 3131–3148, doi:10.5194/acp-6-3131-2006,
2006.
Andreae, M. O. and Merlet, P.: Emission of trace gases and aerosols
from biomass burning, Global Biogeochem. Cy., 15, 955–966,
doi:10.1029/2000GB001382, 2001.
Aoki, T., Kuchiki, K., Niwano, M., Kodama, Y., Hosaka, M., and
Tanaka T.: Physically based snow albedo model for calculating broadband albedos and the solar heating profile in snowpack
for general circulation models, J. Geophys. Res., 116, D11114,
doi:10.1029/2010JD015507, 2011.
Auffhammer, M., Ramanathan, V., and Vincent, J. R.: Integrated
model shows that atmospheric brown clouds and greenhouse
www.atmos-chem-phys.net/15/1191/2015/
1201
gases have reduced rice harvests in India, P. Natl. Acad. Sci.
USA, 103, 19668–19672, 2006.
Beine, H., Anastasio, C., Esposito, G., Patten, K., Wilkening, E.,
Domine, F., Voisin, D., Barret, M., Houdier, S., and Hall, S.: Soluble, light-absorbing species in snow at Barrow, Alaska, J. Geophys. Res., 116, D00R05, doi:10.1029/2011JD016181, 2011.
Bond, T. C. and Bergstrom, R. W.: Light absorption by carbonaceous particles: an investigative review, Aerosol. Sci. Tech., 40,
27–67, 2006.
Bond, T. C., Streets, D. G., Yarber, K. F., Nelson, S. M., Woo, J., and
Klimont, Z.: A technology based global inventory of black and
organic carbon emissions from combustion, J. Geophys. Res.,
109, D14203, doi:10.1029/2003JD003697, 2004.
Bond, T. C., Bhardwaj, E., Dong, R., Jogani, R., Jung, S., Roden, C., Street, D. G., and Trautmann, N. M.: Historical emissions of black and organic carbon aerosol from energy-related
combustion, 1850–2000, Global Biogeochem. Cy., 21, GB2018,
doi:10.1029/2006GB002840, 2007.
BP Group: BP Statistical Review of World Energy June 2009, Report, BP p.l.c., London, UK, 45 pp., 2009.
Cao, J., Wu, F., Chow, J. C., Lee, S. C., Li, Y., Chen, S. W., An, Z. S.,
Fung, K. K., Watson, J. G., Zhu, C. S., and Liu, S. X.: Characterization and source apportionment of atmospheric organic and elemental carbon during fall and winter of 2003 in Xi’an, China, Atmos. Chem. Phys., 5, 3127–3137, doi:10.5194/acp-5-3127-2005,
2005.
Cao, J., Zhu, C., Chow, J. C., Liu, W., Han, Y., and Watson, J. G.:
Stable carbon and oxygen isotopic composition of carbonate in
fugitive dust in the Chinese Loess Plateau, Atmos. Environ., 42,
9118–9122, 2008.
Cao, J., Tie, X., Xu, B., Zhao, Z., Zhu, C., Li, G., and Liu, S.: Measuring and modeling black carbon (BC) contamination in the SE
Tibetan Plateau, J. Atmos. Chem., 67, 45–60, 2010.
Chen, Y. and Bond, T. C.: Light absorption by organic carbon
from wood combustion, Atmos. Chem. Phys., 10, 1773–1787,
doi:10.5194/acp-10-1773-2010, 2010.
Chow, J. C. and Watson, J. G.: PM2.5 carbonate concentrations at regionally representative interagency monitoring of protected visual environment sites, J. Geophys. Res, 107, 8344,
doi:10.1029/2001JD000574, 2002.
Chow, J. C., Watson, J. G., Pritchett, L. C., Pierson, W. R., Frazier,
C. A., and Purcell, R. G.: The DRI thermal/optical reflectance
carbon analysis system: description, evaluation and applications
in US air quality studies, Atmos. Environ., 27, 1185–1201, 1993.
Clarke, A. D. and Noone, K. J.: Soot in the Arctic snowpack: a
cause for perturbations in radiative transfer, Atmos. Environ., 19,
2045–2053, 1985.
Cong, Z., Kang, S., and Qin, D.: Seasonal features of aerosol particles recorded in snow from Mt. Qomolangma (Everest) and their
environmental implications, J. Environ. Sci., 21, 914–919, 2009.
Cuffey, K. M. and Paterson, W. S. B. (Eds.): The physics of glaciers,
Fourth Edition, Academic Press, Burlington, USA, 11–29, 2010.
Dang, C. and Hegg, D. A.: Quantifying light absorption by organic carbon in Western North American snow by serial chemical extractions, J. Geophys. Res. Atmos., 119, 10247–10261,
doi:10.1002/2014JD022156, 2014.
Doherty, S. J., Warren, S. G., Grenfell, T. C., Clarke, A. D.,
and Brandt, R. E.: Light-absorbing impurities in Arctic snow,
Atmos. Chem. Phys., 15, 1191–1204, 2015
1202
M. Wang et al.: Carbonaceous aerosols recorded in a southeastern Tibetan glacier
Atmos. Chem. Phys., 10, 11647–11680, doi:10.5194/acp-1011647-2010, 2010.
Ducret, J. and Cachier, H.: Particulate carbon content in rain at various temperate and tropical locations, J. Atmos. Chem., 15, 55–
67, 1992.
Fernandes, S. D., Trautmann, N. M., Streets, D. G., Roden, C. A.,
and Bond, T. C.: Global biofuel use, 1850–2000, Global Biogeochem. Cy., 21, GB2019, doi:10.1029/2006GB002836, 2007.
Flanner, M. G. and Zender, C. S.: Snowpack radiative heating:
influence on Tibetan Plateau climate, Geophys. Res. Lett., 32,
L06501, doi:10.1029/2004GL022076, 2005.
Flanner, M. G. and Zender, C. S.: Linking snowpack microphysics and albedo evolution, J. Geophys. Res., 111, D12208,
doi:10.1029/2005JD006834, 2006.
Flanner, M. G., Zender, C. S., Randerson, J. T., and Rasch,
P. J.: Present-day climate forcing and response from
black carbon in snow, J. Geophys. Res., 112, D11202,
doi:10.1029/2006JD008003, 2007.
Flanner, M. G., Zender, C. S., Hess, P. G., Mahowald, N. M.,
Painter, T. H., Ramanathan, V., and Rasch, P. J.: Springtime
warming and reduced snow cover from carbonaceous particles,
Atmos. Chem. Phys., 9, 2481–2497, doi:10.5194/acp-9-24812009, 2009.
Gustafsson, Ö, Kruså, M., Zencak, Z., Sheesley, R. J., Granat, L.,
Engström, E., Praveen, P. S., Rao, P. S. P., Leck, C., and Rodhe,
H.: Brown clouds over South Asia: Biomass or fossil fuel combustion?, Science, 323, 495–497, 2009.
Hadley, O. L. and Kirchstetter, T. W.: Black-carbon reduction of
snow albedo, Nat. Clim. Change, 2, 437–440, 2012.
Hansen, J. and Nazarenko, L.: Soot climate forcing via snow and
ice albedos, P. Natl. Acad. Sci. USA, 101, 423–428, 2004.
Hegg, D. A., Warren, S. G., Grenfell, T. C., Doherty, S. J., Larson, T.
V., and Clarke, A. D.: Source attribution of black carbon in snow,
Env. Sci. Tech., 43, 4016–4021, doi:10.1021/es803623f, 2009.
Hegg, Dean A., Warren, Stephen G., Grenfell, Thomas C., Sarah
J. Doherty, and Clarke, Antony D.: Sources of light-absorbing
aerosol in arctic snow and their seasonal variation, Atmos. Chem.
Phys., 10, 10923–10938, doi:10.5194/acp-10-10923-2010, 2010.
Heltberg, R., Arndt, T. C., and Sekhar, N. U.: Fuelwood consumption and forest degradation: a household model for domestic energy consumption in rural India, Land Econ., 76, 213–232, 2000.
Hoffer, A., Gelencsér, A., Guyon, P., Kiss, G., Schmid, O., Frank,
G. P., Artaxo, P., and Andreae, M. O.: Optical properties of
humic-like substances (HULIS) in biomass-burning aerosols, Atmos. Chem. Phys., 6, 3563–3570, doi:10.5194/acp-6-3563-2006,
2006.
IEA: Chapter 9 – Country and regional profiles in the 450 Scenario,
in: World Energy Outlook 2009, International Energy Agency,
France, 319–362, 2009.
IPCC: Climate Change 2013: The Physical Science Basis, Contribution of Working Group I to the Fourth Assessment Report
of the Intergovernmental Panel on Climate Change, edited by:
Solomon, S., Qin, D., Manning, M., Chen, Z., Marquis, M., Averyt, K. B., Tignor M., and Miller, H. L., Cambridge University
Press, Cambridge, United Kingdom and New York, NY, USA,
996 pp., 2013.
Ito, A. and Penner, J. E.: Historical emissions of carbonaceous aerosols from biomass and fossil fuel burning for the
Atmos. Chem. Phys., 15, 1191–1204, 2015
period 1870–2000, Global Biogeochem. Cy., 19, GB2028,
doi:10.1029/2004GB002374, 2005.
Jacobson, M. Z.: Strong radiative heating due to the mixing state
of black carbon in atmospheric aerosols, Nature, 409, 695–697,
2001.
Kaspari, S. D., Schwikowski, M., Gysel, M., Flanner, M. G.,
Kang, S., Hou, S., and Mayewski, P. A.: Resent increase
in black carbon concentrations from a Mt. Everest ice core
spanning 1860–2000 AD, Geophys. Res. Lett., 38, L04703,
doi:10.1029/2010GL046096, 2011.
Kaspari, S., Painter, T. H., Gysel, M., Skiles, S. M., and
Schwikowski, M.: Seasonal and elevational variations of black
carbon and dust in snow and ice in the Solu-Khumbu, Nepal
and estimated radiative forcings, Atmos. Chem. Phys., 14, 8089–
8103, doi:10.5194/acp-14-8089-2014, 2014.
Kirchstetter, T. W. and Thatcher, T. L.: Contribution of organic carbon to wood smoke particulate matter absorption of solar radiation, Atmos. Chem. Phys., 12, 6067–6072, doi:10.5194/acp-126067-2012, 2012.
Kirchstetter, T. W., Novakov, T., and Hobbs, P. V.: Evidence
that the spectral dependence of light absorption by aerosol is
affected by organic carbon, J. Geophys. Res., 109, D21208,
doi:10.1029/2004JD004999, 2004.
Lamarque, J.-F., Bond, T. C., Eyring, V., Granier, C., Heil, A.,
Klimont, Z., Lee, D., Liousse, C., Mieville, A., Owen, B.,
Schultz, M. G., Shindell, D., Smith, S. J., Stehfest, E., Van Aardenne, J., Cooper, O. R., Kainuma, M., Mahowald, N., McConnell, J. R., Naik, V., Riahi, K., and van Vuuren, D. P.: Historical (1850–2000) gridded anthropogenic and biomass burning
emissions of reactive gases and aerosols: methodology and application, Atmos. Chem. Phys., 10, 7017–7039, doi:10.5194/acp10-7017-2010, 2010.
Lin, G., Penner, J. E., Flanner, M. G., Sillman, S., Xu, L., and Zhou,
C.: Radiative forcing of organic aerosol in the atmosphere and
on snow: Effects of SOA and brown carbon, J. Geophys. Res.
Atmos., 119, 7453–7476, doi:10.1002/2013JD021186, 2014.
Liu, X., Easter, R. C., Ghan, S. J., Zaveri, R., Rasch, P., Shi, X.,
Lamarque, J.-F., Gettelman, A., Morrison, H., Vitt, F., Conley,
A., Park, S., Neale, R., Hannay, C., Ekman, A. M. L., Hess, P.,
Mahowald, N., Collins, W., Iacono, M. J., Bretherton, C. S., Flanner, M. G., and Mitchell, D.: Toward a minimal representation
of aerosols in climate models: description and evaluation in the
Community Atmosphere Model CAM5, Geosci. Model Dev., 5,
709–739, doi:10.5194/gmd-5-709-2012, 2012.
Lu, Z., Zhang, Q., and Streets, D. G.: Sulfur dioxide and primary
carbonaceous aerosol emissions in China and India, 1996–2010,
Atmos. Chem. Phys., 11, 9839–9864, doi:10.5194/acp-11-98392011, 2011.
Lu, Z., Streets, D. G., Zhang, Q., and Wang, S.: A novel backtrajectory analysis of the origin of black carbon transported to
the Himalayas and Tibetan Plateau during 1996–2010, Geophys.
Res. Lett., 39, L01809, doi:10.1029/2011GL049903, 2012.
Ma, P.-L., Rasch, P. J., Wang, H., Zhang, K., Easter, R. C., Tilmes,
S., Fast, J. D., Liu, X., Yoon, J.-H., and Lamarque, J.-F.: The role
of circulation features on black carbon transport into the Arctic in the Community Atmosphere Model Version 5 (CAM5), J.
Geophys. Res.-Atmos., 118, 4657–4669, 2013.
Marinoni, A., Cristofanelli, P., Laj, P., Duchi, R., Calzolari, F.,
Decesari, S., Sellegri, K., Vuillermoz, E., Verza, G. P., Villani, P.,
www.atmos-chem-phys.net/15/1191/2015/
M. Wang et al.: Carbonaceous aerosols recorded in a southeastern Tibetan glacier
and Bonasoni, P.: Aerosol mass and black carbon concentrations,
a two year record at NCO-P (5079 m, Southern Himalayas), Atmos. Chem. Phys., 10, 8551–8562, doi:10.5194/acp-10-85512010, 2010.
McConnell, J., Edwards, R. L., Kok, G. L., Flanner, M. G., Zender,
C. S., Saltzman, E. S., Banta, J. R., Pasteris, D. R., Carter, M. M.,
and Kahl, J. D. W.: 20th century industrial black carbon emissions altered Arctic climate forcing, Science, 317, 1381–1384,
2007.
Ménégoz, M., Krinner, G., Balkanski, Y., Boucher, O., Cozic, A.,
Lim, S., Ginot, P., Laj, P., Gallée, H., Wagnon, P., Marinoni, A.,
and Jacobi, H. W.: Snow cover sensitivity to black carbon deposition in the Himalayas: from atmospheric and ice core measurements to regional climate simulations, Atmos. Chem. Phys., 14,
4237–4249, doi:10.5194/acp-14-4237-2014, 2014.
Menon, S., Hansen, J., Nazarenko, L., and Luo, Y.: Climate effects
of black carbon aerosols in China and India, Science, 297, 2250–
2253, 2002.
Ming, J., Cachier, H., Xiao, C., Qin, D., Kang, S., Hou, S., and
Xu, J.: Black carbon record based on a shallow Himalayan ice
core and its climatic implications, Atmos. Chem. Phys., 8, 1343–
1352, doi:10.5194/acp-8-1343-2008, 2008.
Ming, J., Xiao, C., Du, Z., and Yang, X.: An overview of
black carbon deposition in High Asia glaciers and its impacts on radiation balance, Adv. Water Resour., 55, 80–87,
doi:10.1016/j.advwatres.2012.05.015, 2013.
Neale, R. B., Chen, C.-C., Gettelman, A., Lauritzen, P. H., Park,
S., Williamson, D. L., Conley, A. J., Garcia, R., Kinnison, D.,
Lamarque, J.-F., Marsh, D., Mills, M., Smith, A. K., Tilmes, S.,
Vitt, F., Cameron-Smith, P., Collins, W. D., Iacono, M. J., Easter,
R. C., Ghan, S. J., Liu, X., Rasch, P. J., and Taylor, M. A.: Description of the NCAR Community Atmosphere Model (CAM
5.0), NCAR/TN-486+STR, available at: http://www.cesm.ucar.
edu/models/cesm1.0/cam/docs/description/cam5_desc.pdf (last
access: 25 November 2014), 2012.
Novakov, T., Andreae, M. O., Gabriel, R., Kirchstetter, T. W.,
Mayol-Bracero, O. L., and Ramanathan, V.: Origin of carbonaceous aerosols over the tropical Indian Ocean: Biomass burning
or fossil fuels, Geophys. Res. Lett., 27, 4061–4064, 2000.
Novakov, T., Ramanathan, V., Hansen, J. E., Kirchstetter, T. W.,
Sato, M., Sinton, J. E., and Sathaye, J. A.: Large historical
changes of fossil-fuel black carbon aerosols, Geophys. Res. Lett.,
30, 1324, doi:10.1029/2002GL016345, 2003.
Pachauri, R. K.: The future of India’s economic growth: the natural
resources and energy dimension, Futures, 36, 703–713, 2004.
Qian, Y., Flanner, M. G., Leung, L. R., and Wang, W.: Sensitivity studies on the impacts of Tibetan Plateau snowpack pollution on the Asian hydrological cycle and monsoon climate, Atmos. Chem. Phys., 11, 1929–1948, doi:10.5194/acp-11-19292011, 2011.
Qian, Y., Wang, H., Zhang, R., Flanner, M. G., and Rasch, P. J.: A
Sensitivity Study on Modeling Black Carbon in Snow and its
Radiative Forcing over the Arctic and Northern China, Environ.
Res. Lett., 9, 064001, doi:10.1088/1748-9326/9/6/064001, 2014.
Qian, Y., Yasunari, T. J., Doherty, S. J., Flanner, M. G., Lau, W. K.
M., Ming, J., Wang, H., Wang, M., Warren, S. G., and Zhang,
R.: Light-absorbing Particles in Snow and Ice: Measurement and
Modeling of Climatic and Hydrological Impact, Adv. Atmos.
Sci., 32, 64–91, doi:10.1007/s00376-014-0010-0, 2015.
www.atmos-chem-phys.net/15/1191/2015/
1203
Rajput, P., Sarin, M., Sharma, D, and Singh, D.: Characteristics
and emission budget of carbonaceous species from post-harvest
agricultural-waste burning in source region of the Indo-Gangetic
Plain, Tellus B, 66, 21026, doi:10.3402/tellusb.v66.21026, 2014.
Ram, K., Sarin, M. M., and Hegde, P.: Long-term record of aerosol
optical properties and chemical composition from a high-altitude
site (Manora Peak) in Central Himalaya, Atmos. Chem. Phys.,
10, 11791–11803, doi:10.5194/acp-10-11791-2010, 2010.
Ramanathan, V. and Carmichael, G.: Global and regional climate
changes due to black carbon, Nat. Geosci., 1, 221–227, 2008.
Ramanathan, V., Chung, C., Kim, D., Bettge, T., Buja, L., Kiehl,
J. T., Washington, W. M., Fu, Q., Sikka, D. R., and Wild, M.:
Atmospheric brown clouds: impacts on South Asian climate and
hydrological cycle, P. Natl. Acad. Sci. USA, 102, 5326–5333,
2005.
Ramanathan, V., Ramana, M. V., Roberts, G., Kim, D., Corrigan, C.,
Chung, C., and Winker, D.: Warming trends in Asia amplified by
brown clouds solar absorption, Nature, 448, 575–578, 2007.
Reddy, M. S. and Venkataraman, C.: Inventory of aerosol and sulphur dioxide emissions from India. Part II – biomass combustion,
Atmos. Environ., 36, 699–712, 2002.
Revelle, R.: Energy use in rural India, Science, 192, 969–975, 1976.
Rienecker, M. M., Suarez, M. J., Gelaro, R., Todling, R., Bacmeister, J., Liu, E., Bosilovich, M. G., Schubert, S. D., Takacs, L.,
Kim, G.-K., Bloom, S., Chen, J., Collins, D., Conaty, A., da
Silva, A., Gu, W., Joiner, J., Koster, R. D., Lucchesi, R., and
Molod, A.: MERRA – NASA’s Modern-Era Retrospective Analysis for Research and Applications, J. Clim., 24, 3624–3648,
2011.
Sarka, S., Chokngamwong, R., Cervone, G., Singh, R. P., and
Kafatos, M.: Variability of aerosol optical depth and aerosol forcing over India, Adv. Space Res., 37, 2153–2159, 2006.
Sathaye, J. and Tyler, S.: Transitions in household energy use in
urban China, India, the Philippines, Thailand, and Hong Kong,
Annu. Rev. Energ. Environ., 16, 295–335, 1991.
Stone, E. A., Lough, G. C., Schauer, J. J., Praveen, P. S., Corrigan, C. E, and Ramanathan, V.: Understanding the origin of black
carbon in the atmospheric brown cloud over the Indian Ocean, J.
Geophys. Res., 112, D22S23, doi:10.1029/2006JD008118, 2007.
Streets, D. G. and Waldhoff, S. T.: Biofuel use in Asia and acidifying emissions, Energy, 23, 1029–1042, 1998.
Tie, X., Wu, D., and Brasseur, G.: Lung cancer mortality and exposure to atmospheric aerosol particles in Guangzhou, China, Atmos. Environ., 43, 2375–2377, 2009.
Venkataraman, C., Habib, G., Eiguren-Fernandez, A., Miguel, A.
H., and Friedlander, S. K.: Residential biofuels in South Asia:
carbonaceous aerosol emissions and climate impacts, Science,
307, 1454–1456, 2005.
Venkataraman, C., Sagar, A. D., Habib, G., Lam, N., and Smith, K.
R.: The Indian National Initiative for advanced biomass cookstoves: the benefits of clean combustion, Energy Sustain. Dev.,
14, 63–72, 2010.
Wang, H., Easter, R. C., Rasch, P. J., Wang, M., Liu, X., Ghan, S.
J., Qian, Y., Yoon, J.-H., Ma, P.-L., and Vinoj, V.: Sensitivity of
remote aerosol distributions to representation of cloud-aerosol
interactions in a global climate model, Geosci. Model Dev., 6,
765–782, doi:10.5194/gmd-6-765-2013, 2013.
Atmos. Chem. Phys., 15, 1191–1204, 2015
1204
M. Wang et al.: Carbonaceous aerosols recorded in a southeastern Tibetan glacier
Wang, H., Rasch, P. J., Easter, R. C., Singh, B., Zhang, R., Ma, P.
L., Qian, Y., and Beagley, N.: Using an explicit emission tagging method in global modeling of source-receptor relationships
for black carbon in the Arctic: Variations, Sources and Transport pathways, J. Geophys. Res.-Atmos., 119, 12888–12909,
doi:10.1002/2014JD022297, 2014.
Wang, X., Doherty, S. J., and Huang, J.: Black carbon
and other light-absorbing impurities in snow across Northern China, J. Geophys. Res. Atmos., 118, 1471–1492,
doi:10.1029/2012JD018291, 2013.
Warren, S. G. and Wiscombe, W. J.: A model for the spectral albedo
of snow. II: snow containing atmospheric aerosols, J. Atmos.
Sci., 37, 2734–2745, 1980.
Wiscombe, W. J. and Warren, S. G.: A model for the spectral albedo
of snow. I: Pure snow, J. Atmos. Sci., 37, 2712–2733, 1980.
Xu, B., Cao, J., Hansen, J., Yao, T., Joswiak, D. R., Wang, N.,Wu,
G., Wang, M., Zhao, H., Yang, W., Liu, X., and He, J.: Black soot
and the survival of Tibetan glaciers, P. Natl. Acad. Sci. USA, 106,
22114–22118, 2009a.
Atmos. Chem. Phys., 15, 1191–1204, 2015
Xu, B., Wang, M., Joswiak, D. R., Cao, J., Yao, T., Wu, G., Yang,
W., and Zhao, H.: Deposition of anthropogenic aerosols in a
southeastern Tibetan glacier, J. Geophys. Res., 114, D17209,
doi:10.1029/2008JD011510, 2009b.
Yang, M., Howell, S. G., Zhuang, J., and Huebert, B. J.: Attribution of aerosol light absorption to black carbon, brown carbon, and dust in China – interpretations of atmospheric measurements during EAST-AIRE, Atmos. Chem. Phys., 9, 2035–2050,
doi:10.5194/acp-9-2035-2009, 2009.
Zhao, S., Ming, J., Sun, J., and Xiao, C.: Observation of carbonaceous aerosols during 2006–2009 in Nyainqêntanglha Mountains
and the implications for glaciers, Environ. Sci. Pollut. Res., 20,
5827–5838, doi:10.1007/s11356-013-1548-6, 2013.
Zhao, Z., Cao, J., Shen, Z., Xu, B., Chen, L-W. A., Ho, K., Han,
Y., Zhu, C., and Liu, S.: Aerosol particles at a high-altitude site
on the Southeast Tibetan Plateau, China: implications for pollution transport from South Asia, J. Geophys. Res.-Atmos., 118,
11360–11375, doi:10.1002/jgrd.50599, 2013.
www.atmos-chem-phys.net/15/1191/2015/
© Copyright 2026