
1696
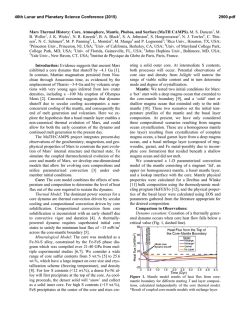
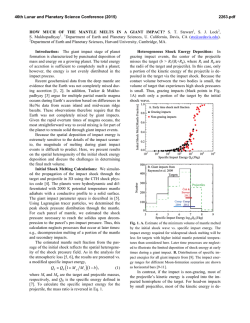
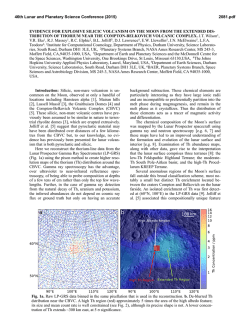
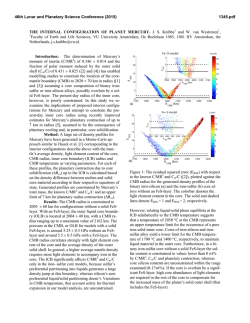
46th Lunar and Planetary Science Conference (2015)
1696.pdf
INTERNAL STRUCTURE OF THE MOON INFERRED FROM APOLLO SEISMIC DATA AND
SELENODETIC DATA FROM GRAIL AND LLR. K. Matsumoto1, R. Yamada1, F. Kikuchi1, S. Kamata2, 3, Y.
Ishihara4, T. Iwata4, H. Hanada1, and S. Sasaki5, 1RISE Project Office, National Astronomical Observatory of Japan,
Mizusawa, Oshu, Iwate, 023-0861 Japan ([email protected]), 2Dept. Earth and Planetary Sciences, University of California, Santa Cruz, Santa Cruz, California, 95064 USA, 3Department of Natural History Sciences, Hokkaido University, Sapporo, Hokkaido, 060-0810 Japan, 4Japan Aerospace Exploration Agency, Yoshinodai, Sagamihara, Kanagawa, 252-5210, Japan, 5Osaka University, Toyonaka, Osaka, 565-0871 Japan.
Introduction: The knowledge of internal structure
of the Moon is a key to understand the origin and the
evolution of our nearest celestial body. A large amount
of seismic information was brought by the near-side
network consisting of four seismometers of Apollo 12,
14, 15, and 16. The Apollo seismic data have contributed to internal structure modeling, but the deepest
regions which can be sounded by the travel time data
are about 400 km radius (roughly 1300 km depth),
leaving the structure near the center uncertain. Some
studies attempted to identify the seismic wave reflected
at the boundaries between fluid and solid layers by
stacking noisy waveforms, e.g., [1], [2], but large differences between models still exist below the deep
moonquake region.
The Moon is also observed by selenodetic techniques such as Lunar Laser Ranging (LLR), satellite
gravimetry, and satellite altimetry. Lunar properties
obtained from these observations include the mass,
mean radius, moments of inertia (MOI), and tidal Love
numbers. The recent Gravity Recovery and Interior
Laboratory (GRAIL) mission has provided a degree-2
potential Love number k2 accurate to 1% [3], [4]. This
level of k2 accuracy has a potential to better characterize the lunar deep interior [5].
The purpose of this paper is to explore lunar internal structure models which are consistent with both the
seismic and the selenodetic data. The seismic travel
time data will constrain crustal and mantle structures,
while selenodetic data are expected to contribute to
infer the structure below the deep moonquake region.
Data: We employed four selenodetically observed
data of mean radius (R), mass (M), normalized mean
solid moment of inertia (Is/MR2), and degree-2 potential tidal Love number k2 which are reported by [6]
who summarized recent results of selenodetic data
analyses. The mean radius R constrains the size of the
modeled Moon, and M, solid MOI, and k2 are used,
together with the seismic travel time data, to constrain
the internal structure. The Love number k2 is corrected
for the anelastic contributions following [7].
We used the seismic travel time data selected by [8],
i.e., 318 data (183 P-wave and 135 S-wave) from 59
sources (24 deep quakes, 8 shallow quakes, 19 meteoroid impacts, and 8 artificial impacts).
Internal structure model: Our model assumes
that the Moon is spherically symmetric, elastic, and in
hydrostatic equilibrium. We divide the Moon into seven shells of crust, upper mantle, middle mantle, lower
mantle, low-velocity zone (LVZ), fluid outer core and
solid inner core. The model parameters are the thickness, density, shear modulus and bulk modulus of each
layer. We have fixed, however, some of the parameters.
The boundary between upper and middle mantles and
that between middle and lower mantles are fixed at 500
and 900 km depths, respectively. The density and bulk
modulus of the LVZ are assumed to be the same as
those of the lower mantle. The shear modulus in the
fluid outer core is fixed to 0 Pa. The bulk modulus of
the outer core and elastic parameters of the inner core
are fixed to the model values of [1]. The density of the
solid inner core is assumed to be 8000 kg/m3, e.g., [1],
[6], but that of the fluid outer core remains variable.
We prohibited models with decreasing density with
depth. The number of model parameters is 18.
Inversion: A Bayesian inversion approach is an effective method to solve for a nonlinear problem such as
planetary internal structure modeling, e.g., [7], [9].
This study also utilizes Markov chain Monte Carlo
(MCMC) algorithm to infer the parameters of the lunar
internal structure. The solutions of the parameters and
their uncertainties are obtained from the posterior distribution which is sampled by the MCMC algorithm.
The former is evaluated as the median value, and the
latter as the 95 % upper and lower credible intervals
corresponding to 2σ.
Results: Inverted results for P-wave velocity (VP ),
S-wave velocity (VS), and density are shown in Figure
1 as vertical profiles, together with probability density
of each layer at certain depth. The mean crustal thickness is estimated to be 43 ± 10 km. The sampled crustal density has a relatively broad distribution between
2400 and 2800 kg/m3. The estimated parameter values
for the mantle are as follows; for the upper mantle (VP,
VS, ρ) = (7.62 ± 0.09 km/s, 4.39 ± 0.09 km/s, 3360 ±
35 kg/m3), for the middle mantle (8.03 ± 0.12 km/s,
4.50 ± 0.10 km/s, 3410 ± 50 kg/m3), and for the lower
mantle (8.27 ± 0.22 km/s, 4.60 +0.22/-0.09 km/s, 3490
+140/-100 kg/m3). The models of [1] and [2] are also
shown in Figure 1 for comparison. Although slight
46th Lunar and Planetary Science Conference (2015)
scatters among models are observed, averaged structures in the three mantle layers are basically consistent
with each other. Our model, however, has larger lowermantle density (Figure 1(d)).
VS and VP in the LVZ are estimated to be 2.6 ± 1.4
km/s and 6.9 +0.9/-0.5 km/s, respectively. Figure 2
shows two-dimensional posterior probability function
by which correlation between two parameters is depicted. A negative correlation between the outer core size
and the LVZ thickness is clearly seen in Figure 2(a); a
smaller outer core should be accompanied by a thick
LVZ and vice versa. Consequently, an accurate independent estimate of these parameters based on current
data set is challenging.
The outer core radius is estimated to be 310 +90/200 km and 97 % of the sampled core radius is smaller
than 400 km. The thickness of the LVZ is inferred as
220 ± 170 km. The plausible inference from the existence of the LVZ is that the LVZ is partially molten
where viscosity is also low and most of the tidal dissipation occurs [10, 7].
Figure 2(b) shows the correlation between the radius and density of the liquid outer core. A noticeable
concentration of high probability is observed for the
radius > 330 km and the density < 4500 kg/m3. This
feature does not necessarily mean that this particular
parameter space is the most probable, but that a larger
core should have a smaller density. On the other hand,
if outer core radius < 330 km the posterior probability
of the outer core density tends to broadly distribute
which makes it difficult to tightly constrain the density.
It can be mentioned, however, that the outer core radius is likely less than 330 km if we assume that its density is larger than 5000 kg/m3 (e.g., Fe-FeS eutectic
composition).
Since we assumed that the LVZ has the same density as the lower mantle, the density is estimated as an
average of these two layers. The LVZ might actually
have a larger density than the averaged estimate. To
confirm this we conducted another inversion in which
the densities (and the bulk moduli) of the lower mantle
and the LVZ are estimated independently. This separated case resulted in a mantle density of 3460 +140/50 kg/m3 which is more consistent with previous estimates, e.g., [1], [2], and a LVZ density of 3660 ± 210
kg/m3. Although the uncertainty for the latter is large,
the median value of the LVZ density at the pressure
near the core mantle boundary (~4.5 GPa) indicates
that this zone is typically high-Ti basalt which might
have originated black glass with TiO2 content ~16
wt% [11]. The deep Ti-rich composition is consistent
with a lunar evolution model involving lunar mantle
overturn in which ilmenite-bearing cumulate layer sank
1696.pdf
with trapped incompatible heat-producing elements
[12]. The above discussions support the idea that both
tidal heating and radiogenic heating have maintained
the partially molten region up until the present.
References: [1] Weber R. C. et al. (2011) Science,
331, 309-312. [2] Garcia R. F. et al. (2011) PEPI, 188,
96-113. [3] Konopliv A. S. et al. (2013) JGR, 118,
1415-1434. [4] Lemoine F. G. et al. (2013) JGR, 118,
1676-1698. [5] Yamada R. et al. (2014) PEPI, 231, 5664. [6] Williams J. G. et al. (2014) JGR, 119, 15461578. [7] Khan A. et al. (2014) JGR, 119, 2197-2221.
[8] Lognonne P. et al. (2003) EPSL, 211, 27-44. [9]
Rivoldini A. et al. (2011) Icarus, 213, 451-472. [10]
Harada Y. et al. (2014) Nat. Geosci., 7, 569-572. [11]
Sakamaki T. et al. (2010) EPSL, 299, 293-297. [12]
Hess P. C. and Parmentier E. M. (1995) EPSL, 134,
501-514.
Figure 1. Vertical profiles of (a) modeled layer, (b) Pwave velocity, (c) S-wave velocity, and d) density.
Darker black color indicates higher probability of occurrence. Green broken lines indicate the 95% upper
and lower credible intervals of our results. Model values of [1] and [2] are indicated as red and blue dotted
lines, respectively.
Figure 2. Two dimensional posterior probability density functions showing (a) sampled outer core radius and
thickness of the low-velocity zone, and (b) sampled
radius and density of the fluid outer core.
© Copyright 2026