
Final Revised Paper - Hydrology and Earth System Sciences
Hydrol. Earth Syst. Sci., 19, 583–599, 2015
www.hydrol-earth-syst-sci.net/19/583/2015/
doi:10.5194/hess-19-583-2015
© Author(s) 2015. CC Attribution 3.0 License.
Divergence of actual and reference evapotranspiration observations
for irrigated sugarcane with windy tropical conditions
R. G. Anderson1,* , D. Wang1 , R. Tirado-Corbalá1,** , H. Zhang1,*** , and J. E. Ayars1
1 USDA,
Agricultural Research Service, San Joaquin Valley Agricultural Sciences Center, Water Management Research Unit,
Parlier, California, USA
* USDA, Agricultural Research Service, U.S. Salinity Laboratory, Contaminant Fate and Transport Unit, Riverside,
California, USA
** Crops and Agro-Environmental Science Department,University of Puerto Rico, Mayagüez, Puerto Rico, USA
*** USDA, Agricultural Research Service, Water Management Research Unit, Fort Collins, Colorado, USA
Correspondence to: R. G. Anderson ([email protected])
Received: 9 May 2014 – Published in Hydrol. Earth Syst. Sci. Discuss.: 17 June 2014
Revised: 21 November 2014 – Accepted: 25 November 2014 – Published: 29 January 2015
Abstract. Standardized reference evapotranspiration (ET)
and ecosystem-specific vegetation coefficients are frequently
used to estimate actual ET. However, equations for calculating reference ET have not been well validated in tropical environments. We measured ET (ETEC ) using eddy covariance
(EC) towers at two irrigated sugarcane fields on the leeward
(dry) side of Maui, Hawaii, USA in contrasting climates. We
calculated reference ET at the fields using the short (ET0 )
and tall (ETr ) vegetation versions of the American Society
for Civil Engineers (ASCE) equation. The ASCE equations
were compared to the Priestley–Taylor ET (ETPT ) and ETEC .
Reference ET from the ASCE approaches exceeded ETEC
during the mid-period (when vegetation coefficients suggest
ETEC should exceed reference ET). At the windier tower
site, cumulative ETr exceeded ETEC by 854 mm over the
course of the mid-period (267 days). At the less windy site,
mid-period ETr still exceeded ETEC , but the difference was
smaller (443 mm). At both sites, ETPT approximated midperiod ETEC more closely than the ASCE equations ((ETPT ETEC ) < 170 mm). Analysis of applied water and precipitation, soil moisture, leaf stomatal resistance, and canopy cover
suggest that the lower observed ETEC was not the result of
water stress or reduced vegetation cover. Use of a customcalibrated bulk canopy resistance improved the reference ET
estimate and reduced seasonal ET discrepancy relative to
ETPT and ETEC in the less windy field and had mixed performance in the windier field. These divergences suggest that
modifications to reference ET equations may be warranted in
some tropical regions.
1
Introduction
Accurate estimates of evapotranspiration (ET) are needed for
numerous purposes, including efficient irrigation scheduling
(Davis and Dukes, 2010), parameterizing and running different classes of biogeochemical and hydrologic models (Fisher
et al., 2005; Zhao et al., 2013), assessing changes in regional hydrology under different cultivation systems (Ferguson and Maxwell, 2011; Holwerda et al., 2013; Waterloo et
al., 1999), and evaluating the impacts of agricultural production on regional and global climate (Kueppers et al., 2007;
Lo and Famiglietti, 2013; Puma and Cook, 2010) and hydrology (Anderson et al., 2012; Vörösmarty et al., 1998).
In irrigated agriculture, underestimation of required ET can
lead to suboptimal yield due to water stress (Kang et al.,
2002), whereas overestimation of ET can lead to excessive
applied water, thus reducing water available for other uses
or additional acreage (Perry, 2005), degrading water quality (Smith, 2000), and decreasing economic competitiveness
(Hargreaves and Samani, 1984).
While accurate ET estimates are essential, ET can be challenging to measure. Numerous approaches have been developed to measure or estimate ET, including lysimeters (Meissner et al., 2010), micrometeorological methods (Anderson
and Goulden, 2009; Baldocchi, 2003; Hemakumara et al.,
2003), satellite remote sensing (Bastiaanssen et al., 2005;
Tang et al., 2009), and water balance methods. While these
approaches vary in their spatial/temporal scale and methodological assumptions and accuracy, most require significant
Published by Copernicus Publications on behalf of the European Geosciences Union.
584
R. G. Anderson et al.: Divergence of actual and reference evapotranspiration observations
observational costs, technical expertise, or have operational
difficulties that are too high for most farmers.
Because of the difficulties in actual ET measurement, the
vegetation coefficient/reference ET approach (Jensen, 1968)
has gained widespread acceptance for estimating actual ET
for varied applications (e.g., Arnold et al., 1998; Cristea et
al., 2013). This approach involves calculating a reference
ET for a standard land surface, usually grass or alfalfa, using meteorological data and relating the reference surface to
the ecosystem/land cover of interest with empirical coefficient(s):
ETA = KC ∗ET0 ,
(1)
where ETA is actual ET, ET0 is reference ET, and Kc is
the coefficient for the specific land cover type. Two of the
most commonly used standard methods include the Food and
Agricultural Organization (FAO) approach presented in Irrigation and Drainage paper 56, hereafter referred to as FAO56 (Allen et al., 1998), and the American Society of Civil
Engineers approach, hereafter referred to as ASCE (Allen
et al., 2005). Both approaches are based on the combination Penman–Monteith (PM) formula (Monteith, 1965) and
account for ET from both solar irradiation and advectively
driven ET due to wind and vapor pressure deficit (VPD).
Both the FAO-56 and ASCE approaches assume standard
measurement conditions and surface parameters (canopy
height, surface resistance, albedo, etc.), thus allowing canopy
and atmospheric resistance terms to be condensed into constants. Both methods also provide scaling procedures to account for variation in meteorological measurements as well
as missing or erroneous data.
Validation work of standardized reference ET equations
against large weighing lysimeters with reference surfaces has
been done primarily in the western continental USA with
low atmospheric humidity (Evett et al., 2000; Jensen et al.,
1990). Internationally, most other reference ET validation
has been done in Mediterranean climates with similar low
humidity (Lecina et al., 2003; Ventura et al., 1999). Relatively little evaluation of these equations has been done in
areas with higher relative humidity, presumably because of
the perceived lack of use for reference ET equations in these
areas. However, reference ET equations are used in more
humid regions for applications such as watershed modeling
(Rao et al., 2011), forecasting water demand (Tian and Martinez, 2012), and determining irrigation needs (Suleiman and
Hoogenboom, 2007). As such, it is necessary to test these reference ET equations in regions with high relative humidity to
ensure accurate ET parameterization.
One major tropical and subtropical crop that has generally high ET is sugarcane. Sugarcane is a good crop to test
reference ET parameterizations because of its longer fullcanopy period, when actual crop ET should be at its maximum relative to reference ET equations, and its high crop coefficient (Kc ) that generally exceeds 1. Previous research in
irrigated sugarcane has found full-canopy ET rates that equal
Hydrol. Earth Syst. Sci., 19, 583–599, 2015
or exceed evaporation rates from open-water pans (Campbell
et al., 1960; Thompson and Boyce, 1967). Since the development and implementation of reference ET equations, researchers have generally found irrigated sugarcane to have a
Kc greater than 1 in Australia and Swaziland (Inman-Bamber
and McGlinchey, 2003), Brazil (Da Silva et al., 2012), and
Texas (Salinas and Namken, 1977). However, all of these
studies found variable and differing Kc values, with InmanBamber and McGlinchey noting a correspondence between
meteorological events and outlying daily Kc values. Sugarcane’s high water use, the potential for expanded irrigation
to reduce yield deficits and increase production in tropical
regions (Inman-Bamber et al., 1999), and the potential for
sugarcane irrigation to stress water resources during dry periods in tropical areas (Ramjeawon, 1994) make it a good
case study for evaluating reference ET equations in tropical
regions.
To evaluate the performance of standardized reference ET
equations, we established two eddy covariance (EC) towers
over irrigated sugarcane fields in Hawaii, USA to measure
ET (ETEC ). We calculated reference ET using the ASCE approach for short (ET0 ) and tall (ETr ) reference vegetation.
The FAO-56 ET0 was not used as it is identical to ASCE
ET0 for calculations on a daily time step (Irmak et al., 2006;
Suleiman and Hoogenboom, 2009). We also compared ETEC
to the Priestley–Taylor (PT) ET equation (ETPT ). Our objectives were to (1) determine if standardized reference ET
equations adequately parameterized actual ET across differing microclimates, (2) determine the meteorological conditions that contribute to discrepancies in the standardized
equations, and (3) examine corrections to improve estimates
of reference ET under relatively more humid conditions.
2
2.1
Methods
Study region
We evaluated reference ET approaches in two sugarcane
(Saccharum officinarum L.) fields with identical cultivars
(Heinz et al., 1981) at a commercial farm on Maui, Hawaii
(Fig. 1 and Table 1). Climatic conditions vary across the
farm, with changes in precipitation, wind, solar irradiation,
and air temperature due to orographic effects. Normal annual precipitation ranges from 275 to 1275 mm year−1 from
the leeward (south) side to the windward (northeast) side of
the plantation (Giambelluca et al., 2013). Elevations on the
plantation range from near sea level to ∼ 340 m. The western
side of the plantation is generally windier (Table 1). Drip irrigation is used to maximize limited surface and ground water resources (Moore and Fitschen, 1990). Drip tape spacing is 2.70 m with sugarcane rows planted 45 cm away from
the tape on both sides; the tape irrigates at 1.58 L−1 h−1 m−1
and is regulated to 83 kPa of pressure at the head of the row.
Irrigation amounts were recorded by the farm; rainfall was
www.hydrol-earth-syst-sci.net/19/583/2015/
R. G. Anderson et al.: Divergence of actual and reference evapotranspiration observations
585
Table 1. Eddy covariance field site information.
Micrometeorological site information
Field
Latitude (◦ N)
Longitude (◦ W)
Elevation (m)
Date field planted
Date tower established
Begin of mid-period (cover > 80 %)
End of analysis
Natural Resource Conservation Service
(NRCS) soil series
Bulk density*
Porosity (%)
Soil texture classification**
Soil texture – sand (%)
Soil texture – silt (%)
Soil texture – clay (%)
Soil volumetric water content (VWC)
at saturation (mm/40 cm depth)
Soil water storage (water content
at 30 % VWC-wilting point) (mm)
Wilting point (% VWC)
Matric potential at 30 % VWC (MPa)
Matric potential at 24 % VWC (MPa)
Field size (ha)
Field length (m) (predominant wind)
Field length (m) (shortest direction)
Lee
20.784664
156.403869
203
28 March 2011
21 July 2011
3 November 2011
26 July 2012
Waiakoa very stony,
silty clay loam
1.22
54
Clay
31
15
54
216
Windy
20.824633
156.491278
44
11 May 2011
23 July 2011
5 December 2011
27 August 2012
Pulehu cobbly silt loam
60
72
15
NA***
NA
99.1
> 500
220
12
−0.01
−0.033
62.6
415
150
1.35
49
Sandy clay loam
51
16
33
196
Mean meteorological observations (1 August 2011–31 July 2012)
Mean daily air temperature (◦ C)
Mean minimum daily air temperature (◦ C)
Mean maximum daily air temperature (◦ C)
Mean daily wind speed (m s−1 )
Mean daily net radiation (MJ m−2 day−1 )
Mean daily relative humidity (%)
22.3
17.8
27.3
2.0
10.7
65
23.4
20.4
26.9
4.6
11.3
62
* All reported soil properties averaged/summed over the first 40 cm of soil depth. ** Soil texture was determined in the lab
using the hydrometer method. ** Matric potential not available for Lee because of extreme logistical difficulty in obtaining
intact Tempe cell samples at depth for determination of water retention characteristics.
recorded at nearby weather stations (Supplement S1). As is
typical for Hawaii (Heinz and Osgood, 2009), sugarcane is
grown on a 24-month rotation with planting and harvesting throughout most of the year. Peak ET, as determined
by the length of the mid-season period, lasts significantly
longer (330 days) than for sugarcane in other regions (190–
220 days) (Doorenbos and Pruitt, 1977; Inman-Bamber and
McGlinchey, 2003).
2.2
EC measurements and data analysis
We installed two micrometeorological towers in contrasting
micro-climates (Fig. 1 and Table 1). These towers are at the
“Windy” site (lower elevation, higher wind velocity, more
constant wind direction, and sandy clay loam soil) and the
“Lee” site (higher elevation, lower wind velocity, and clay
www.hydrol-earth-syst-sci.net/19/583/2015/
soil). Field fetch in the prevailing wind directions was over
200 m for both towers. The slope in both fields, as determined using the 1/3 arcsec (∼ 10 m) digital elevation model
from the US Geological Survey’s National Elevation Dataset
(http://ned.usgs.gov/index.html), is less than 3 %. Beyond
the edge of each field, Windy was surrounded by sugarcane
fields on all sides for over 1500 m; Lee was bordered by
non-irrigated rangeland in the non-prevailing wind directions
(east and south) and contiguous sugarcane fields to the north
and east.
Tower instrumentation included an integrated EC system
(EC150 – Campbell Scientific, Logan, Utah, USA1 ) with an
open-path infrared gas analyzer, aspirated temperature probe,
1 Mention of trade names or commercial products in this publication is solely for the purpose of providing specific information
Hydrol. Earth Syst. Sci., 19, 583–599, 2015
586
R. G. Anderson et al.: Divergence of actual and reference evapotranspiration observations
Figure 1. (a) True color image of the main Hawaiian islands from
the moderate resolution imaging spectroradiometer (250 m resolution – image date: 27 May 2003). Study region is outlined in red
box. (b) The study region on central Maui showing the location of
the eddy covariance towers (Windy and Lee) used in this study. Image is false color Landsat 7 (30 m resolution – image date: 5 February 2000).
attached 3-D sonic anemometer head (CSAT3A – Campbell
Scientific), and enhanced barometer (PTB110 – Vaisala, Vantaa, Finland). Relative humidity and air temperature were
measured by a combined temperature and relative humidity
probe (HMP45C – Vaisala). Net radiation was measured with
a single component net radiometer (NR-Lite2 – Kipp and Zonen, Delft, Netherlands). We corrected the single component
net radiometer for the effect of wind following Cobos and
Baker (2003). Ground heat flux was measured as the average
and does not imply recommendation or endorsement by the US Department of Agriculture.
Hydrol. Earth Syst. Sci., 19, 583–599, 2015
of four self-calibrating heat flux plates (HFP01SC – Huskeflux, Delft, Netherlands). The plates were installed at 5 cm
depth at four lateral locations perpendicular to the irrigation
drip line (Sect. 2.1): 0 cm (drip line), 45 cm (sugarcane row),
75 cm, and 135 cm (mid-point between drip lines). All instruments were factory calibrated to ISO 9001:2008 standards
prior to deployment; data were recorded and processed on
solid-state data loggers (CR3000, Campbell Scientific).
Two water content reflectometry probes (CS616 – Campbell Scientific) were installed at 20 cm depth at two locations
perpendicular to the drip line (45 and 135 cm) to measure
soil volumetric water content (VWC). These locations were
chosen to correspond with the sugarcane row (center of root
zone) and halfway between sugarcane rows. VWC was measured to independently assess potential water stress in both
fields. VWC was calculated using a quadratic equation with
empirically determined coefficients specific to each field following the manufacturer’s recommendation. Soil water retention and permanent wilting point were also determined
for Windy but, due to rockiness at the Lee site, could not be
determined for Lee because of the logistical difficulty and
equipment risk in obtaining intact Tempe cell samples below
the surface. More technical details on soil calibrations are
provided in Supplement S1.
The EC150 system measured CO2 , H2 O, wind velocity,
and sonic temperature at 10 Hz. Other variables were averaged to 30 min fluxes. We processed raw covariances on
the data logger and post-processed high-frequency time series data with commercial software (Eddy Pro Advanced
V 3.0 and 4.0 – LI-COR, Lincoln, Nebraska USA). Data
logger flux calculations were downloaded daily via a cellular modem. High-frequency (10 Hz) data and half-hourly
fluxes were transferred monthly via a data card. Raw time
series data were checked following the tests of Vickers and
Mahrt (1997). Sonic anemometer tilt was corrected using
double rotation (Kaimal and Finnigan, 1994); lags between
the infrared gas analyzer and sonic anemometer were determined using maximum covariance. We corrected for density
fluctuations (Webb et al., 1980), low pass filtering (Moncrieff
et al., 1997), and high pass filtering (Moncrieff et al., 2004).
Flux footprint lengths were calculated following Kljun et
al. (2004), and quality flags were assigned following the
CarboEurope standard (Mauder and Foken, 2011). We independently calculated stability (Obukhov, 1971). After installation, tower heights were periodically adjusted to keep
meteorological instrumentation ∼ 3.0–3.3 m above the zeroplane displacement height, which was assumed to be 67 %
of canopy height (Arya, 2001). Canopy height was measured
biweekly, concurrent with the vegetation cover observations
(Sect. 2.4). Additional detailed EC cross-validation activities
are described in Supplement S1.
Half-hourly fluxes with instrumentation errors flagged
by the EC150 system, rainfall, or lack of turbulence
(friction velocity < 0.1 m s−1 ) were excluded. Excluded
fluxes were gap-filled as a function of fluxes meawww.hydrol-earth-syst-sci.net/19/583/2015/
R. G. Anderson et al.: Divergence of actual and reference evapotranspiration observations
sured from similar meteorological periods using the
Max Planck Institute tool (http://www.bgc-jena.mpg.de/
~MDIwork/eddyproc/index.php) (Reichstein et al., 2005).
Gap-filled fluxes were used to calculate daily and cumulative fluxes but were excluded from half-hourly analyses.
We corrected fluxes for energy budget closure by regressing
daily EC-observed available energy against measured available energy (net radiation minus ground heat flux) and forcing the regression through the origin, preserving the daily
mean Bowen ratio and adjusting each day’s ET by the regression slope for the entire study period (Anderson and Wang,
2014; Leuning et al., 2012).
2.3
Reference ET equations, corrections, and
evaluation of controls
At each tower, daily and hourly reference ET was calculated
using the ASCE short (ET0 ) and tall (ETr ) reference equations, where short and tall refer to parameterized surfaces
similar to well-watered fescue grass (short) and alfalfa (tall),
with differences in the equations due to assumed leaf area
index (LAI) and bulk canopy resistance to ET:
ETsz =
Cn
u2 (es − ea )
0.408 (Rn − G) + γ T +273
+ γ (1 + Cd u2 )
.
(2)
As shown in Eq. (2), ETsz is the reference ET type (ETr or
ET0 in mm day−1 or mm h−1 depending on time step); Rn
and G are net radiation and ground heat flux (MJ m−2 day−1
or MJ m−2 h−1 ), respectively; γ is the psychrometric constant (kPa ◦ C−1 ); T is mean daily or hourly air temperature
(◦ C); u2 is mean daily or hourly wind speed measured at or
scaled to 2 m height; es and ea are mean saturation and actual vapor pressure (kPa), respectively; and Cn and Cd are
empirical numerator and denominator constants that change
with the reference surface and time step (Table 1 in Allen
et al., 2005). We scaled all meteorological variables from
3 m above the zero-plane displacement to 2 m, following the
ASCE procedure for adjusting meteorological measurements
at non-standard heights. Following ASCE, mean daily meteorological values were calculated as an average of daily minimum and maximum values as opposed to averaging all 24 h
of measurements. Differences between these averaging approaches were small (mean T difference of 0.26 and 0.27 ◦ C
in Windy and Lee, respectively). Measured net radiation and
ground heat fluxes were used for all calculations.
We also calculated another reference using the PT equation (Priestley and Taylor, 1972). PT was chosen as a comparison because of its different treatment of advection in comparison to the PM-type equations, its wide usage, and the
relative simplicity of its meteorological inputs compared to
PM. The PT equation is
ETPT =
α
∗
λ
(Rn − G)
.
+γ
www.hydrol-earth-syst-sci.net/19/583/2015/
(3)
587
ETPT is the PT ET (mm day−1 ); , γ , Rn , and G are the same
as in Eq. (2); λ is the latent heat of vaporization; and α is
an empirical constant. We assumed that λ is 2.45 MJ mm−1 ,
which is the same as the ASCE/FAO-56 approach. We used
an α of 1.26, which is widely, but not universally, representative of a well-watered surface across a variety of climates
(e.g., Eichinger et al., 1996; McAneney and Itier, 1996).
To examine the discrepancies between the ASCE equations (ET0 and ETr ), the PT equation (ETPT ), and measured
ETEC we inverted the PM equation to calculate bulk canopy
resistance (rc ) from ETEC and ETPT and compared the calculated rc to the constant rc used to calculate ET0 and ETr
during the mid-period. The ASCE parameterization to calculate atmospheric resistance (ra ) was used in the inverted PM
equation. Days with available energy (net radiation (Rn ) –
ground heat flux (G)) of < 5 MJ day −1 were excluded because low radiation values would result in extreme rc values
and to avoid including days with precipitation, which would
bias the net radiation measurement of the NR-Lite2.
Once the discrepancies between reference and measured
ET became apparent (see Sects. 3.2 and 3.3), we attempted
two corrections to the ASCE reference ET approach to better
parameterize sugarcane water use. One was a climatological correction to the ET coefficient (KC−adj ). Following the
FAO-56 approach (Allen et al., 1998), an adjustment term
(Kadj ) was calculated:
0.3
Kadj = 0.04∗ U2avg − 2 − 0.004∗ RHavg − 45 ∗havg
, (4)
KC−adj = KC−FAO + Kadj .
(5)
In Eqs. (4) and (5), KC−FAO is the literature mid-canopy KC
value, U2avg is mean location wind speed (m s−1 ) at 2 m
height, RHavg is mean location relative humidity, and havg
is average vegetation height. For our study we used average
wind speed, relative humidity, and vegetation height over the
mid-period to calculate these parameters in the absence of
longer-term climate data. The FAO-56 provides a range of
mid-period KC values for sugarcane (1.25–1.40) for short
reference ET. For adjustment, we chose the lowest end of
the range (1.25) for KC−FAO to enable the most conservative
estimate of parameterized ET.
The second correction was to parameterize the ASCE–PM
equation with a custom constant rc . To estimate a rc value, an
intermediate bulk canopy resistance of 165 s m−1 was used,
which was chosen as the weighted average of the rc calculated by inverting the ETPT at Windy and Lee. We then ran
the full-form PM equation to calculate a new reference ET
(ETr−cane ).
Along with corrections to the reference ET equations, we
examined potential controls on the discrepancies between
reference and measured ET values. Daytime and nighttime
rc were investigated by inverting the full PM equation with
measured ET to see if there was a systematic time-of-day difference between the fields and to see if errors in daytimeor nighttime-parameterized rc were disproportionally conHydrol. Earth Syst. Sci., 19, 583–599, 2015
588
R. G. Anderson et al.: Divergence of actual and reference evapotranspiration observations
tributing to discrepancies in reference ET. Daily daytime and
nighttime rc were calculated for days that had at least eight
(daytime) and four (nighttime) non-gap-filled half-hourly
flux measurements. For these calculations, daytime was defined as Rn > 50 Wm−2 and nighttime as Rn < −10 Wm−2 .
We used this definition to avoid including periods with near
zero Rn that would blow up the inverted PM equation. Finally, we evaluated the correlation between meteorological
observations and discrepancies between the ASCE tall reference ET equation (ETr ) and ETEC to assess the importance
of the advective and radiation terms in the PM equation.
2.4
Canopy cover and determination of mid-period
We measured fractional canopy cover with an optical camera to obtain an independent, conservative determination of
the mid-season period (mid-period) for intercomparison of
measured and reference ET. The mid-period is one of the
growth/ET stages in the FAO/ASCE methodology and corresponds to maximum plant transpiration and the highest
ecosystem coefficient (Kc−mid ). In unstressed sugarcane, the
mid-period coefficient should exceed 1 (Allen et al., 1998),
thus measured ET should exceed reference ET. The camera (TetraCam ADC multispectral camera, TetraCam Inc.,
Chatsworth, California, USA) contains a single precision
3.2 megapixel image sensor optimized for capturing green,
red, and near-infrared wavebands of reflected light. A telescoping pole tripod system (GeoData Systems Management
Inc., Berea, Ohio, USA) was used to suspend the camera directly above the plant at a height of 7 m and aim vertically
downward at nadir view. Each field was photographed every
∼ 16 ± 2 days. Ten images were taken in two lines perpendicular to the irrigation line at pre-selected sampling locations in each field at solar noon ± 2 hours; sampling locations were identical throughout the study. Each image was
preprocessed with image processing software (LView Pro
2006 – CoolMoom Corp., Hallandale, Florida, USA) to paint
out the pixels of soil, grass, shadow, and other background.
The preprocessed image was then analyzed using proprietary
software (PixelWrench, TetraCam Inc.) to classify fractional
vegetation cover based on threshold analysis, and the cover
readings from the 10 locations were averaged to determine
mean and standard error of field vegetation cover. We considered the beginning of the mid-period to be the latter of
the beginning date of mid-period from the FAO-56 KC curve
(Allen et al., 1998) or the date when canopy cover clearly exceeded 80 %, which has been shown to coincide with the start
of mid-period (Carr and Knox, 2011). The end of the KC−mid
period was set to 27 August 2012, which was the last date of
irrigation data prior to the end of the FAO-56 mid-period. Finally, we further restricted the end of the mid-period in the
earlier planted field (Lee) to ensure that the length of the
mid-period was identical in both fields for intercomparison
purposes.
Hydrol. Earth Syst. Sci., 19, 583–599, 2015
Figure 2. Measured mean and standard deviation of fractional vegetation cover from TetraCam for Windy and Lee fields.
2.5
LAI and stomatal resistance
measurements
We measured LAI and leaf stomatal resistance in a field
campaign during the mid-period for both EC fields (July
2012). LAI was measured using a nondestructive, optical
plant canopy analyzer (LAI 2200, LI-COR Inc.) on 13 July
in the Lee field and 16 July in the Windy field. At each of the
10 TetraCam sampling locations in each field (Sect. 2.4), we
made 10 below-canopy and 5 above-canopy measurements
with the optical canopy analyzer; we then used the manufacturer’s software (FV2200, LI-COR Inc.) to determine mean
and standard error of LAI for both fields. To observe leaf
level stomatal resistance, we used a steady-state diffusion
porometer (SC-1, Decagon Devices Inc.), which has been
used to observe response to different irrigation regimes in
multiple agronomic crops (e.g., Ballester et al., 2013; Hirich
et al., 2014; Mabhaudhi et al., 2013; Mendez-Costabel et
al., 2014). At each TetraCam point nine leaves were measured: three fully sunlit upper-canopy leaves near (< 20 vertical cm away from) the top visible dewlap (TVD) point (Glaz
et al., 2008), three mid-level leaves that were attached to the
cane stalk below the TVD height but were still mostly sunlit,
and three lower canopy leaves that were partially to mostly
shaded. Porometry measurements were made in a 30 s measurement window using the porometer’s automatic mode. We
also repeated the stomatal resistance measurements at five of
the TetraCam points in the Windy field to evaluate the larger
discrepancies in reference ET observed in that field.
www.hydrol-earth-syst-sci.net/19/583/2015/
R. G. Anderson et al.: Divergence of actual and reference evapotranspiration observations
589
Table 2. A summary of cumulative irrigation, rain, actual measured
evapotranspiration-ETEC , and reference evapotranspiration values
(ASCE short-ET0 and tall-ETr , Priestley–Taylor ETPT , and a custom cane reference ET-ETr−cane ) for the entire study period and the
mid-period. All values are in mm.
Lee
Irrigation
Rain
ETEC
ET0
ETr
ETPT
ETr−cane
Figure 3. Meteorological and soil observations during the study period: (a) mean daily air temperature; (b) mean 24 h wind velocity;
(c) cumulative daily net radiation; and (d) soil volumetric water
content (VWC) data from Windy field at 20 cm depth underneath
cane row (45 cm away from drip line) and inter-row or midway between drip lines (137 cm away from drip line). Wilting point noted
as solid red line (12 % VWC).
3.1
Results
Fractional vegetation cover, LAI, and leaf stomatal
resistance
Fractional vegetation cover increased rapidly in both fields
after the beginning of the EC measurements (Fig. 2). Initial cover was < 20 % in Windy and < 45 % in Lee (112
and 142 days after planting (DAP), respectively). Some early
TetraCam sampling dates were missed due to initial equipment failures. Vegetation cover exceeded 80 % in Lee on
3 November 2011 and 5 December 2011 in Windy (220 and
208 DAP, respectively), which we considered the onset of
the mid-period. Both of these dates are later than the onset of
mid-period according to the FAO-56 curve (180 DAP). Variation in cover was largest at the beginning of the study period
(standard deviation of ∼ 10%) (Fig. 2). Vegetation cover was
least variable near the onset of the mid-period (standard dewww.hydrol-earth-syst-sci.net/19/583/2015/
Whole study
Mid-period
Whole study
Mid-period
1599
58
1191
1487
1828
1470
1317
1348
58
843
1042
1292
1008
947
1928
140
1389
2099
2861
1707
1662
1221
122
1001
1367
1861
1096
1128
viation < 5 %). Mean canopy height reached 3.97 m in Lee
and 4.09 m in Windy by the end of the study.
Mean ± standard error of measured LAI was 4.9 ± 0.2 in
Windy on 13 July 2012 and 4.7 ± 0.3 in Lee on 16 July 2012.
Midday leaf stomatal resistance (rs ) observations of fully
sunlit leaves in Windy (n = 32) and Lee (n = 21) showed
substantial variation, ranging from 45 to 259 s m−1 in Windy
and 40 to 640 s m−1 in Lee. Median rs in Windy and Lee
were 112 and 114 s m−1 , respectively. Mean ± standard deviations of rs in Windy and Lee were 125 ± 57 s m−1 and
161 ± 157 s m−1 , respectively. There were two observations
in Lee of sunlit stomatal resistance of > 500 s m−1 . Excluding these two observations resulted in a revised mean
and median rs in Lee of 114 and 104 s m−1 , respectively.
Mean sunlit stomatal resistance was not significantly different (p < 0.01) from 100 s m−1 in either Windy (p = 0.02) or
Lee (p = 0.09).
3.2
3
Windy
Meteorological observations
Air temperature and net radiation were similar in both Windy
and Lee (Fig. 3a and c; Table 1). In Windy, mean daily air
temperature ranged from 19.0 to 25.0 ◦ C over the study period, whereas in Lee, mean daily air temperature ranged from
19.7 to 26.3 ◦ C. Mean air temperature was higher in Windy
than Lee (23.5 and 22.3 ◦ C, respectively) with a similar, low
day-to-day variability (standard deviation of 1.3 ◦ C for both
fields). Daily net radiation (Rn) was also similar between
fields; Rn was slightly higher in Windy versus Lee (11.5 and
10.9 MJ m−2 day−1 ; Fig. 3c and Table 1). Both fields showed
larger relative variations in Rn (∼ 10 MJ m−2 day−1 ) than
in other meteorological observations. Wind velocities were
sharply divergent between the two fields. Mean wind velocity was more than twice as high (4.6 m s−1 versus 2.0 m s−1 )
in Windy compared to Lee (Fig. 3b; Table 1). Wind velocities were also more variable in Windy than Lee (standard
deviation of 1.4 and 0.7 m s−1 , respectively).
VWC observations in the Windy field underneath the
sugar cane row/line varied from 23 to 30 % during the midHydrol. Earth Syst. Sci., 19, 583–599, 2015
590
R. G. Anderson et al.: Divergence of actual and reference evapotranspiration observations
Figure 4. Daily measured and reference ETs for EC tower fields
from the tower’s establishment until the end of the study period for
each field.
period except after major rain events in December 2011 and
March 2012 when they spiked to 36–37 % (Fig. 3d). At all
times, VWC remained well above wilting point (12 %) for
both sensors (Table 1). Available plant water in the top 40 cm
of the soil at minimum VWC was ∼ 40 mm. Soil matric potentials in Windy near typical maximum (30 %) and minimum (24 %) soil VWC were −0.01 and −0.033 MPa, respectively (Table 1). Shallow VWC observations underneath the
cane row are likely indicative of plant water stress due to the
majority of drip-irrigated Hawaiian sugarcane roots being at
less than 50 cm depth (Evensen et al., 1997). VWC observations between drip lines showed relatively little periodicity
compared to underneath the cane row, indicating that neither
irrigation events nor root depletion was impacting VWC at
this location. Due to difficulties with instrument installation
and instrument failure we were not able to obtain a reliable
time series of soil VWC observations in the Lee field. Precipitation at both fields was less than 150 mm over the course of
the study, with irrigation providing more than 90 % of the
water input (Table 2).
From the tower’s establishment until the end of the study
period, daily EC measured ET (ETEC ) ranged from 1.6 to
5.5 mm day−1 with a mean of 3.2 mm day−1 in Lee and
1.6 to 5.5 mm day−1 with a mean 3.8 mm day−1 in Windy
(Fig. 4). ETEC showed relatively little seasonal variation
(< 3 mm day−1 from summer maxima to winter minima)
and greater day-to-day variations of 1–2 mm day−1 . Cumulatively, mid-period ETEC was 158 mm higher in Windy than
in Lee (Fig. 5; Table 2). Factors contributing to higher ETEC
in Windy include higher wind speed, slightly higher Rn, a
higher mean air temperature, and lower mean daily relative
humidity. However, maximum daily air temperature is higher
near Lee than Windy. Ground heat flux was minimal (< 3 %
Hydrol. Earth Syst. Sci., 19, 583–599, 2015
Figure 5. Cumulative measured and reference ET for Windy and
Lee. Shaded background indicates mid-period when ground canopy
cover exceeded 80 %.
of Rn during daytime periods) at both sites during the midperiod.
Quality control checks on the EC data indicated no significant issues with ET measurements. Energy closure varied significantly between the sites, with daily energy closure
of the turbulent fluxes of 75 % at Lee and 97 % at Windy.
As data processing and instrumentation were identical between sites, the difference in energy closure is very likely
due to the differences in topography and turbulence between
the two fields, particularly nighttime turbulence (Anderson
and Wang, 2014). Friction velocity at Windy rarely dropped
below the critical threshold (0.1 m s−1 ) at night (2.5 % of the
half-hourly fluxes). Mean 90 % footprint lengths during the
study period, determined following Kljun et al. (2004), were
158 m in Windy and 124 m in Lee, which indicate that our
EC towers were observing the field of interest even during
the rare periods (∼ 7 % of record) when we were observing
in the short fetch direction (Table 1), such as during Kona
winds (winds from the south and west). During the predominant trade wind flows (prevailing winds from the northeast),
our fetch in both fields was > 200 m.
3.3
Reference ET at EC tower sites
Daily short (ET0 ) and tall (ETr ) ASCE reference ET were
significantly different between the two sites (Fig. 4). In
Windy, ET0 ranged from 1.6 to 8.1 mm day−1 over the study
period with a mean of 5.2 mm day−1 (5.1 mm day−1 over the
mid-period). ETr ranged from 2.0 to 12.3 mm day−1 with a
mean of 7.14 mm day−1 (7.0 mm day−1 for mid-period). For
Lee, ET0 varied from 0.6 to 6.5 mm day−1 with a mean of
4.0 mm day−1 (3.9 mm day−1 for mid-period). ETr ranged
from 0.8 to 8.6 mm day−1 with a mean of 5.0 mm day−1
(4.8 mm day−1 mid-period). The PT ET (ETPT ) showed less
www.hydrol-earth-syst-sci.net/19/583/2015/
R. G. Anderson et al.: Divergence of actual and reference evapotranspiration observations
Figure 6. Cumulative difference between reference and measured
ET since the beginning of the mid-period in each EC tower field.
difference between the two fields. Mean ETP T was slightly
higher at Windy (4.3 and 4.1 mm day−1 mid-period) than at
Lee (4.0 and 3.8 mm day−1 mid-period).
Over the course of the study, the cumulative ET0 in Windy
was 612 mm higher than in Lee, and cumulative ETr was
1032 mm higher (Fig. 5; Table 2). Similar to the daily values, cumulative ETPT values were considerably closer, with
Windy exceeding Lee by 237 mm. As expected, the cumulative difference between reference equations and ETEC grew
in the early portion of the study period prior to the midperiod (Fig. 5). During the mid-period, the difference between ETr and ETEC grew significantly larger in both EC
fields. Windy also saw increasing differences between ET0 ,
ETPT , and ETEC , whereas in Lee, cumulative ET0 and ETPT
tracked quite closely with each other.
To further evaluate these discrepancies between reference
and ETEC , we calculated the cumulative difference between
the three reference ET equations and ETEC during the midperiod (Fig. 6). ETPT was the only equation with near zero
cumulative difference for a substantial amount of the midperiod for both fields; ET0 was near 0 for the Lee field from
October 2011 to February 2012 but not for the Windy field.
Over the mid-period in Windy, the difference between cumulative ETEC and ETPT ranged from −40 mm in March 2012
to 92 mm at the end of the study period (August 2012)
with cumulative differences of < 40 mm until July 2012. In
Lee, the differences were greater, varying between −33 and
161 mm. The difference with ET0 ranged from 0 (at the beginning of mid-period) to 362 and 195 mm in Windy and Lee,
respectively. ETr showed the greatest cumulative differences
of 854 and 443 mm in Windy and Lee.
www.hydrol-earth-syst-sci.net/19/583/2015/
591
Figure 7. Calculated daily bulk canopy resistance at Windy and
Lee from the EC towers for the mid-period. Dotted lines show daily
time step resistances from short-canopy (ET0 – 70 s m−1 ) and tallcanopy (ETr – 50 s m−1 ) reference surfaces.
Figure 8. Calculated daily bulk canopy resistances at Windy and
Lee from inverting the Priestley–Taylor (PT) ET for the mid-period.
Dotted lines again show daily time step resistances from short and
tall canopy for comparison.
3.4
Bulk canopy resistances at EC towers, soil
observations, and patterns in ET discrepancies
rc varied considerably between Windy and Lee for ETEC .
For the mid-period, mean ± standard deviations of daily
rc at Lee and Windy were 201 ± 47 and 145 ± 36 s m−1 ,
respectively (Fig. 7). With respect to ETPT , mean ± standard deviations of daily rc at Lee and Windy during the
mid-period were 146 ± 28 s m−1 and 175 ± 42 s m−1 , respectively (Fig. 8). In all cases, mean rc values were significantly higher (> 75 s m−1 ) than the daily rc values used to
parameterize the ET0 and ETr equations.
Hydrol. Earth Syst. Sci., 19, 583–599, 2015
592
R. G. Anderson et al.: Divergence of actual and reference evapotranspiration observations
Figure 9. Calculated mean nighttime and daytime bulk canopy resistances (following Fig. 6) compared to assumed resistances.
Daily daytime and nighttime rc are shown in Fig. 9. Nighttime rc shows greater difference between towers, with mean
± standard deviation in Windy and Lee of 675 ± 289 and
808 ± 445 s m−1 and substantially larger absolute and relative standard deviation in rc . For both fields, daytime and
nighttime rc were larger than the ASCE rc parameterizations for almost all days. One other notable feature of the
resistance terms was the low atmospheric resistance (ra ); in
Windy and Lee, mean daily ra were 17.7 and 38.6 s m−1 , respectively, over the study period.
With respect to meteorological controls on the discrepancies between ETr and ETEC , the only parameter that was
highly correlated to ET discrepancy (ETr -ETEC ) was VPD
with a coefficient of determination (r 2 ) of 0.66 (Fig. 10a).
VPD showed a much stronger correlation with ET discrepancy than ETEC (r 2 = 0.19) (Fig. 10b). Available energy was
moderately correlated with ET discrepancy (r 2 = 0.37) while
all other tested parameters (daily minimum, mean and maximum wind speed and temperature) had weak or no correlation with ET discrepancy (r 2 < 0.1).
3.5
Corrections to better parameterize sugarcane
water use
The climatological KC adjustment (Kadj ) had relatively little impact on calculated water use. In the Windy field Kadj
was −0.0126, and in Lee Kadj was −0.0359. For both fields,
the wind adjustment offset the relative humidity/vegetation
height adjustment as all three parameters were greater than
zero. The magnitude of the Kadj term was insufficient to account for the observed discrepancies between reference ET
and ETEC .
Cumulative differences between ETr−cane and ETEC are
shown in Fig. 11 along with the differences between ETPT
and ETEC . ETr−cane showed some improvements over ETPT
Hydrol. Earth Syst. Sci., 19, 583–599, 2015
Figure 10. (a) Relationship between daily ET discrepancy (ETr ETEC ) and daily vapor pressure deficit (VPD) from the beginning
of the mid-period to the end of the study period. Regression equation is fitted to the entire pool of data from Lee and Windy. (b) Relationship between measured ET and daily VPD; time period and
regression approach are the same as in (a).
Figure 11. Cumulative difference between new reference ET (custom bulk canopy resistance of 165 s m−1 ) and measured ET for both
EC tower fields during the mid-period.
in predicting measured ET between October 2011 and March
2012; in particular ETr−cane had less underestimation of ET
(15 to 27 mm improvement) in winter and spring for both
fields and had consistently better performance in the Lee
field. ETr−cane had worse performance than ETPT during the
summer in the Windy field (40 mm). The minimum cumulative difference between ETr−cane and ETEC was −12 and
−18 mm in Windy and Lee, respectively. The maximum cumulative difference between ETr−cane and ETEC was 132 and
164 mm at the end of the study period in Windy and Lee, respectively.
www.hydrol-earth-syst-sci.net/19/583/2015/
R. G. Anderson et al.: Divergence of actual and reference evapotranspiration observations
4
4.1
Discussion
Is Hawaiian sugarcane representative of a
fully transpiring reference ET surface?
Well-irrigated, full-canopy sugarcane has generally been reported to have an ET rate 1.1 to 1.4 times the ASCE/FAO56 reference ET0 equation (Da Silva et al., 2012; InmanBamber and McGlinchey, 2003), and rain-fed sugarcane has
been reported to have an ET rate approaching ET0 (Cabral
et al., 2012). Furthermore, a reference PM–ET equation designed specifically for sugarcane, created by McGlinchey
and Inman-Bamber (1996), has a bulk canopy resistance
that is slightly lower than the daily ASCE ETr equation (40
versus 45 s m−1 for ASCE ETr ). Therefore, the significant
overestimation of measured ET (ETEC ) by the ET0 and ETr
equations found in this study was quite surprising. Although
Windy and Lee fields had slight differences in planting dates,
available soil water capacity, and fetch (Table 1), we do not
believe these account for the observed ET/reference ET differences between the fields. Seasonal variation in temperature in Hawaii is quite small; wind speeds appeared to be
uncorrelated to seasonality. Wind fields in central Maui are
generally very strong, and our separate calculations of reference ET using independent farm weather station observations (Supplement S1) and publicly available airport weather
data from Kahului airport (http://mesonet.agron.iastate.
edu/request/download.phtml?networkHI_ASOS – station ID
PHOG) show higher-than-typical values of reference ET for
a tropical region.
The quality of EC observations was good, especially at
the Windy tower where high turbulence, flux footprints that
were well within field boundaries, low proportion of time periods requiring gap filling, and excellent energy budget closure (H + LE was > 95 % of daily Rn -G) indicated that the
methodological requirements of the EC method were well
satisfied (Anderson and Wang, 2014). At the Lee tower, EC
measurements showed a more typical pattern, with a larger
number of gaps during still nighttime periods when ET is
low. Furthermore, seasonal and annual totals of ET have been
shown to be relatively insensitive to gap-filling methodologies (Alavi et al., 2006). Finally, while the gap-filling method
of Reichstein et al. (2005) may systematically underestimate
wet canopy evaporation due to exclusion of all EC periods
during and immediately after rain, this bias is likely to be insignificant at our sites due to the low precipitation (Table 2)
and drip irrigation that would minimize wetting of the leaves.
One hypothesis is that portions of the fields measured by
our EC towers were under significant water stress or had lessthan-optimal cover and thus were not representative of a reference ET type surface. Uniformity of irrigation is a major
concern with drip irrigation, particularly with sub- and nearsurface drip lines where root development can plug or pinch
drip lines, leading to insufficient irrigation (e.g., Soopramanien et al., 1990). At our field with higher ET (Windy),
www.hydrol-earth-syst-sci.net/19/583/2015/
593
visible dry lines arising from pinched drip tubes appeared
in parts of the field at and after the end of the study period.
However, there are multiple independent lines of evidence
against this hypothesis.
With respect to canopy cover, the TetraCam observations
of cover (Fig. 2) show that fractional cover remained above
80 %, a threshold for the mid-period KC (Carr and Knox,
2011; Inman-Bamber and McGlinchey, 2003). More evidence for full canopy comes from the LAI measurements
made in July 2012 toward the end of the mid-period. In both
Lee and Windy, mean LAI (4.7 and 4.9) were slightly higher
than the LAI (4.5) parameterized in the ETr equation (Allen
et al., 2005). These two types of data indicate that incomplete
cover is not an issue with our study sites.
Another possibility is that the sugarcane leaves are under significant water stress and thus are transpiring at a
lower rate. Four factors show that the sugarcane is unlikely
to be water stressed. First, porometer measurements from
the July 2012 campaign of midday, sunlit leaf stomatal resistance were not significantly > 100 s m−1 . The 100 s m−1
comes from the mean leaf level stomatal resistance of a
sunlit leaf on a well-watered plant, as measured by Szeicz
and Long (1969), and which is used as a basis for scaling bulk canopy resistance in the ASCE and FAO-56 approaches (Allen et al., 1998, 2005). Second, we compared
the daily observed ET coefficient (KC ) from the day immediately preceding a substantial irrigation or rain event (defined as > 8 mm day−1 ) during the mid-period with daily
KC 2 and 3 days after the irrigation event using a paired t
test (n = 106 in Windy and n = 98 in Lee). We reasoned that
stressed full-canopy sugarcane would respond to irrigation
within 3 days, but that 3 days were short enough to avoid
confounding changes due to variations in field water budgets. Neither field showed significantly greater daily ETEC
following an irrigation during the mid-period (p > 0.40 for
all tests). Third, the soil VWC data from the Windy field indicate relatively high soil moisture content; available soil water underneath the cane row in the middle of the root zone
always remained at > 50 % of available capacity. Windy’s
soils were also near field capacity (and far above permanent
wilting point) based on matric potential at typical maximum
and minimum soil VWC (Table 1). The VWC content also
argues against severe water stress that might persist after irrigation relieves the soil moisture deficit; thus if the ASCE reference ET equations and coefficients were applicable to this
situation, we should see at least some days with ETEC in the
range of ET0 and ETr (6–10 mm day−1 in Windy) when soil
moisture was near or above field capacity. Fourth, measured
irrigation plus precipitation as recorded by the plantation was
compared to measured cumulative ETEC , with cumulative
mid-period irrigation and precipitation exceeding ETEC by
342 mm in Windy (Table 2). At all times in the Windy field,
cumulative ETEC was significantly less than irrigation plus
precipitation. In Lee, by early January 2012 cumulative precipitation and irrigation exceeded ETEC ; by the end of the
Hydrol. Earth Syst. Sci., 19, 583–599, 2015
594
R. G. Anderson et al.: Divergence of actual and reference evapotranspiration observations
mid-period (July 2012), cumulative irrigation and precipitation exceeded cumulative ETEC by > 500 mm (Table 2). In
summary, the evidence of full canopy and the lack of evidence of water stress indicated that the mid-period sugarcane
at our study fields should be fully transpiring.
4.2
Why do the standardized ASCE reference ET
equations differ between similar sites?
Without clear evidence of water stress or lack of canopy
cover over the study sites, we examine some explanations
for the overestimation of the ASCE ET0 and ETr compared
to ETEC and ETPT . Four hypotheses include (1) scaling of
leaf level stomatal resistance to whole canopy bulk resistance, (2) incorrect parameterization of daytime leaf level
resistance, (3) underestimation of nighttime bulk canopy resistance, and (4) underestimation of atmospheric resistance.
Scaling up leaf level resistance measurements has long been
recognized as a major challenge (Bailey and Davies, 1981;
Furon et al., 2007; Sprintsin et al., 2012) due to heterogeneity of environmental variables. The ASCE/FAO reference ET
methods take a single layer “big leaf” approach to scaling to
convert non-stressed leaf resistances (rs ) into whole canopy
bulk resistances (rc ) by using an “effective LAI” where rc is
calculated by dividing rs by effective LAI. ASCE assumes
that effective LAI is equivalent to 0.5 times measured LAI,
which is assumed to be 2.9 for ET0 and 4.5 for ETr , thus
resulting in effective LAIs of 1.4 and 2.3, respectively. Studies of well-watered crops have found effective LAIs which
vary quite significantly from those assumed for the reference
surface. Tolk et al. (1996) found an effective LAI of 1.3 for
irrigated maize in Texas that was only 30 % of the maximum
measured LAI. Other studies (Alfieri et al., 2008; Mehrez et
al., 1992) have assumed effective LAI as a linear function
of LAI, with effective LAI equaling 50 % of LAI when LAI
is 6. Ultimately, the effective LAI concept is only a presumed
distribution of leaves with differing rs (Bailey and Davies,
1981); there is a possibility that the relatively unique production system in our study fields results in a different, distinctive leaf distribution with a lower effective LAI. Along
with effective LAI, another leaf parameter that could be different is leaf level resistance (rs ). Although we did not find
a highly significant difference between measured rs and the
rs assumed in the ASCE parameterizations (100 s m−1 ), we
were able to measure rs in only one field campaign during
the mid-period, where rs observations were limited by clouds
and other logistical limitations. A large number of rs observations are needed to accurately characterize rc (Denmead,
1984); more than we could feasibly measure during our field
campaign. We also note that other researchers (e.g., Zhang
et al., 2008) have found non-stressed rs values greater than
100 s m−1 .
Two other nonbiological factors could help explain the discrepancy between ASCE reference and mid-period ETEC .
One is nighttime rc . Both ASCE approaches assume a nightHydrol. Earth Syst. Sci., 19, 583–599, 2015
time rc of 200 s m−1 , which is based on measurements of
damp soil beneath a grass lysimeter (Allen et al., 2006). Measured nighttime rc at our fields was significantly higher. We
suspect that the taller sugarcane canopy and substantial layer
of trash and lodged cane minimizes bare soil water evaporation, thus increasing nighttime rc . Oliver and Singels (2012)
found a significant decrease in soil evaporation in sugarcane
with surfaces covered by crop residue. Furthermore, the minimal daytime ground heat flux (< 5 %) further reduces nighttime ET. Another factor is the canopy energy storage that is
considerable in high-biomass systems (Anderson and Wang,
2014). Finally, we note that nighttime rc is likely to be a locally specific value; 200 s m−1 is too low for our study region but too high for other regions with significant advection
(Evett et al., 2012).
Along with nighttime rc , we examined the role of atmospheric resistance (ra ) in parameterizing ET, given the low
observed mean ra at Windy (< 20 s m−1 ) and the demonstrated importance of atmospheric resistance/conductance
parameterizations in coastal tropical regions for accurate ET
parameterization (e.g., Holwerda et al., 2012). Given the
canopy architecture of mid-period sugarcane in our study
fields, we were not certain about the equations that are commonly used to parameterize zero plane displacement height
and roughness lengths, which are also used in the ASCE
reference ET equations. To test the effect of ra uncertainty,
a sensitivity analysis was conducted. We used ra that was
200 and 50 % of the original ra and recalculated rc for both
EC towers. In all cases, the new ra changed the rc values
by < 10 s m−1 , with most rc values changed by < 5 s m−1 .
These values are too small to explain the discrepancy between observed and parameterized rc . The presence of ra in
both the numerator and denominator of the PM equation limits the impact of variation in ra on rc .
Finally, we note that the ASCE and FAO reference ET
and PT ET equations show varying sensitivity to meteorological variables depending upon climate. Multiple studies
have shown spatial, seasonal, and interannual variation in the
sensitivity of reference ET to meteorological inputs, with the
most sensitive input (air temperature, wind velocity, relative
humidity, etc.) changing depending upon season and location (e.g., Bandyopadhyay et al., 2009; Estévez et al., 2009;
Gong et al., 2006; Huo et al., 2013; Irmak et al., 2006; Liang
et al., 2008; Liu et al., 2014). Irmak et al. (2006) and Estévez et al. (2009) found increased sensitivity to reference
ET parameterization at locations with higher wind velocities
in the United States and Spain, respectively. Bandyopadhyay
et al. (2009) and Huo et al. (2013) reported that decreased
wind velocities accounted for the largest proportion of decreased reference ET in climatically differing regions in India and China. Across a large river basin in China (Chiang
Jiang), Gong et al. (2006) showed that sensitivities of reference ET to other meteorological variables (air temperature
and relative humidity) depended significantly on the spatial
pattern of wind sensitivity. With respect to the PT equation,
www.hydrol-earth-syst-sci.net/19/583/2015/
R. G. Anderson et al.: Divergence of actual and reference evapotranspiration observations
variability in the PT coefficient (α) has been found at lower
to middle LAI (LAI less than 3) depending upon the soil wetness and covering (Ding et al., 2013). This may be particularly relevant for our system in early growth stages with fractional soil wetness and partial cover from sugarcane detritus
(trash). Conversely, at mid- to full canopy (LAI greater than
3) or when soil moisture was greater than 50 % of the available field capacity, α showed little sensitivity.
5
Summary and conclusion
We investigated discrepancies between two standardized reference ET equations and EC-measured ET at two field sites
over irrigated sugarcane on Maui. At both fields, measured
daily ET during the mid-period should have approached the
tall reference ET equation and exceeded the short reference
ET equation. At both fields, both ASCE reference ET equations significantly overestimated mid-period ET compared to
EC observations of ET. The PT equation performed substantially better at the Windy field than the short reference ET,
while the short reference ET equation and PT were more
closely matched at the Lee field. We used a custom bulk
canopy resistance derived from inverting PT ET; the custom
cane reference ET equation had less seasonal variation in ET
discrepancy. Multiple independent field observations did not
indicate insufficient canopy cover or plant water stress reducing ETEC significantly.
This study indicated nighttime bulk canopy resistance, leaf
stomatal resistance, and effective LAI as possible causes for
the discrepancy in bulk canopy resistance (and reference ET
estimates) between the ASCE reference equations and midperiod ETEC . The higher bulk canopy resistances and relationship between ET discrepancies and vapor pressure deficit
indicated that the ASCE equations overestimated the advective component of ET. Ultimately, validation with field methods, including micrometeorology and water balance methods, is needed to establish the accuracy of the ASCE equations in a region where they have not been tested previously. Adjusting the bulk canopy resistance to local climate
to reduce the advective component of ET may make the full
ASCE PM equation a more appropriate equation in this region.
The PT equation performs better than ETr or ET0 in our
study region. The PT equation likely provides a more robust
estimation of reference ET in regions with high humidity.
The simplicity of the PT equation also makes it attractive for
use in larger scale project planning as it has been parameterized in satellite-based ET models (e.g., Choi et al., 2011; Jin
et al., 2011) and can be used in regions with a relative paucity
of surface meteorological data, unlike the ASCE/FAO equations that require near-surface wind speed and humidity data,
which are currently supplied by surface meteorological stations and interpolated in satellite-based approaches (Allen et
al., 2007; Hart et al., 2009).
www.hydrol-earth-syst-sci.net/19/583/2015/
595
The results illustrate the importance of the careful use
of reference ET equations and coefficients for assessing
actual ET in hydrologic applications. Our finding of high
bulk canopy resistance and low atmospheric resistance supports Widmoser’s (2009) recommendation for research of the
canopy resistance/atmospheric resistance ratio. Many areas
with changing hydrology (Elison Timm et al., 2011) and areas that currently and may soon use irrigation in previously
non-irrigated fields (Baker et al., 2012; Salazar et al., 2012)
are outside of the semi-arid areas where reference ET methods have been primarily developed and tested. As such, it will
be important to ensure that the appropriate reference equation
is used to parameterize evaporative demand.
The Supplement related to this article is available online
at doi:10.5194/hess-12-583-2015-supplement.
Acknowledgements. We thank Ilja van Meerveld, Lixin Wang,
Maarten Waterloo, and two anonymous reviewers for their constructive feedback on this manuscript. Don Schukraft discussed
previous meteorological investigations and observations at the
farm. Jim Gartung, ARS-Parlier, assisted with the establishment of
the EC tower and TetraCam measurements. David Grantz provided
insight into the historical evaluation of ET data for Hawaiian sugarcane. Adel Youkhana, Neil Abranyi, Jason Drogowski, and the
farm crew assisted with data collection and field logistical support.
This research was supported by USDA Agricultural Research
Service, national program 211: Water Availability and Watershed
Management and by the US Navy, Office of Naval Research. Note:
the US Department of Agriculture (USDA) prohibits discrimination
in all its programs and activities on the basis of race, color, national
origin, age, disability, and where applicable, sex, marital status,
familial status, parental status, religion, sexual orientation, genetic
information, political beliefs, reprisal, or because all or part of an
individual’s income is derived from any public assistance program
(not all prohibited bases apply to all programs.) Persons with
disabilities who require alternative means of communication of
program information (Braille, large print, audiotape, etc.) should
contact USDA’s TARGET Center at (202) 720-2600 (voice and
TDD). To file a complaint of discrimination, write to USDA,
Director, Office of Civil Rights, 1400 Independence Avenue, S.W.,
Washington, D.C. 20250-9410, or call (800) 795-3272 (voice) or
(202) 720-6382 (TDD). USDA is an equal opportunity provider
and employer.
Edited by: L. Wang
Hydrol. Earth Syst. Sci., 19, 583–599, 2015
596
R. G. Anderson et al.: Divergence of actual and reference evapotranspiration observations
References
Alavi, N., Warland, J. S., and Berg, A. A.: Filling gaps in evapotranspiration measurements for water budget studies: Evaluation of
a Kalman filtering approach, Agr. Forest Meteorol., 141, 57–66,
doi:10.1016/j.agrformet.2006.09.011, 2006.
Alfieri, J. G., Niyogi, D., Blanken, P. D., Chen, F., LeMone, M.
A., Mitchell, K. E., Ek, M. B., and Kumar, A.: Estimation of the
Minimum Canopy Resistance for Croplands and Grasslands Using Data from the 2002 International H2O Project, Mon. Weather
Rev., 136, 4452–4469, doi:10.1175/2008MWR2524.1, 2008.
Allen, R. G., Pereira, L. S., Raes, D., and Smith, M.: Crop evapotranspiration?: guidelines for computing crop water requirements, Food and Agriculture Organization of the United Nations,
Rome, 1998.
Allen, R. G., Walter, I. A., Elliott, R. L., Howell, T. A., Itenfisu,
D., Jensen, M. E., and Snyder, R. L: The ASCE standardized
reference evapotranspiration equation, American Society of Civil
Engineers, Reston, Va., 2005.
Allen, R. G., Pruitt, W. O., Wright, J. L., Howell, T. A., Ventura,
F., Snyder, R., Itenfisu, D., Steduto, P., Berengena, J., Yrisarry,
J. B., Smith, M., Pereira, L. S., Raes, D., Perrier, A., Alves, I.,
Walter, I., and Elliott, R.: A recommendation on standardized
surface resistance for hourly calculation of reference ETo by the
FAO56 Penman-Monteith method, Agr. Water Manage., 81, 1–
22, doi:10.1016/j.agwat.2005.03.007, 2006.
Allen, R. G., Tasumi, M., and Trezza, R.: Satellite-Based Energy
Balance for Mapping Evapotranspiration with Internalized Calibration (METRIC)-Model, J. Irrig. Drain. Eng., 133, 380–394,
doi:10.1061/(ASCE)0733-9437(2007)133:4(380), 2007.
Anderson, R. G. and Goulden, M. L.: A mobile platform to constrain regional estimates of evapotranspiration, Agr. Forest Meteorol., 149, 771–782, doi:10.1016/j.agrformet.2008.10.022, 2009.
Anderson, R. G. and Wang, D.: Energy budget closure observed
in paired Eddy Covariance towers with increased and continuous daily turbulence, Agr. Forest Meteorol., 184, 204–209,
doi:10.1016/j.agrformet.2013.09.012, 2014.
Anderson, R. G., Lo, M.-H., and Famiglietti, J. S.: Assessing
surface water consumption using remotely-sensed groundwater,
evapotranspiration, and precipitation, Geophys. Res. Lett., 39,
L16401, doi:10.1029/2012GL052400, 2012.
Arnold, J. G., Srinivasan, R., Muttiah, R. S., and Williams, J.
R.: Large Area Hydrologic Modeling and Assessment Part I:
Model Development, J. Am. Water Resour. Assoc., 34, 73–89,
doi:10.1111/j.1752-1688.1998.tb05961.x, 1998.
Arya, S. P.: Introduction to micrometeorology, Academic Press, San
Diego, 2001.
Bailey, W. G. and Davies, J. A.: Bulk stomatal resistance control on evaporation, Boundary-Lay. Meteorol., 20, 401–415,
doi:10.1007/BF00122291, 1981.
Baker, J. M., Griffis, T. J., and Ochsner, T. E.: Coupling
landscape water storage and supplemental irrigation to increase productivity and improve environmental stewardship
in the US Midwest, Water Resources Res., 48, W05301,
doi:10.1029/2011WR011780, 2012.
Baldocchi, D. D.: Assessing the eddy covariance technique
for evaluating carbon dioxide exchange rates of ecosystems:
past, present and future, Glob. Change Biol., 9, 479–492,
doi:10.1046/j.1365-2486.2003.00629.x, 2003.
Hydrol. Earth Syst. Sci., 19, 583–599, 2015
Ballester, C., Jiménez-Bello, M. A., Castel, J. R., and Intrigliolo, D.
S.: Usefulness of thermography for plant water stress detection
in citrus and persimmon trees, Agr. Forest Meteorol., 168, 120–
129, doi:10.1016/j.agrformet.2012.08.005, 2013.
Bandyopadhyay, A., Bhadra, A., Raghuwanshi, N. S., and
Singh, R.: Temporal Trends in Estimates of Reference Evapotranspiration over India, J. Hydrol. Eng., 14, 508–515,
doi:10.1061/(ASCE)HE.1943-5584.0000006, 2009.
Bastiaanssen, W. G. M., Noordman, E. J. M., Pelgrum, H., Davids,
G., Thoreson, B. P., and Allen, R. G.: SEBAL Model with Remotely Sensed Data to Improve Water-Resources Management
under Actual Field Conditions, J. Irrig. and Drain. Eng., 131, 85–
93, doi:10.1061/(ASCE)0733-9437(2005)131:1(85), 2005.
Cabral, O. M. R., Rocha, H. R., Gash, J. H., Ligo, M. A. V., Tatsch,
J. D., Freitas, H. C., and Brasilio, E.: Water use in a sugarcane
plantation, GCB Bioenergy, 4, 555–565, doi:10.1111/j.17571707.2011.01155.x, 2012.
Campbell, R., Chang, J.-H., and Cox, D.: Evapotranspiration of
Sugar Cane in Hawaii as Measured by In-Field Lysimeters in
Relation to Climate, in: Proceedings of the International Society
of Sugarcane Technologists; 10th Congress, Hawaii, 3–22 May,
1959, 637–645, 1960.
Carr, M. K. V. and Knox, J. W.: The Water Relations and Irrigation
Requirements of Sugar Cane (Saccharum Officinarum): A Review, Exp. Agric., 47, 1–25, doi:10.1017/S0014479710000645,
2011.
Choi, M., Woong Kim, T., and Kustas, W. P.: Reliable estimation of evapotranspiration on agricultural fields predicted
by the Priestley–Taylor model using soil moisture data from
ground and remote sensing observations compared with the
Common Land Model, Int. J. Remote Sens., 32, 4571–4587,
doi:10.1080/01431161.2010.489065, 2011.
Cobos, D. R. and Baker, J. M.: Evaluation and Modification of a
Domeless Net Radiometer, Agron. J., 95, 177–183, 2003.
Cristea, N. C., Kampf, S. K., and Burges, S. J.: Revised Coefficients
for Priestley-Taylor and Makkink-Hansen Equations for Estimating Daily Reference Evapotranspiration, J. Hydrol. Eng., 18,
1289–1300, doi:10.1061/(ASCE)HE.1943-5584.0000679, 2013.
Da Silva, T. G. F., de Moura, M. S. B., Zolnier, S., Soares, J. M.,
Vieira, V. J. S., and Júnior, W. G. F.: Water requirement and crop
coefficient of irrigated sugarcane in a semi-arid region, Revista
Brasileira de Engenharia Agricola e Ambiental, 16, 64–71, 2012.
Davis, S. L. and Dukes, M. D.: Irrigation scheduling performance
by evapotranspiration-based controllers, Agr. Water Manage., 98,
19–28, doi:10.1016/j.agwat.2010.07.006, 2010.
Denmead, O. T.: Plant physiological methods for studying evapotranspiration: Problems of telling the forest from the trees, Agr.
Water Manage., 8, 167–189, doi:10.1016/0378-3774(84)900520, 1984.
Ding, R., Kang, S., Li, F., Zhang, Y., and Tong, L.: Evapotranspiration measurement and estimation using modified Priestley–Taylor model in an irrigated maize field
with mulching, Agr. Forest Meteorol., 168, 140–148,
doi:10.1016/j.agrformet.2012.08.003, 2013.
Doorenbos, J. and Pruitt, W.: Crop water requirements. FAO irrigation and drainage paper 24, Land and Water Development Division, FAO, Rome, 1977.
Eichinger, W. E., Parlange, M. B., and Stricker, H.: On the
Concept of Equilibrium Evaporation and the Value of the
www.hydrol-earth-syst-sci.net/19/583/2015/
R. G. Anderson et al.: Divergence of actual and reference evapotranspiration observations
Priestley-Taylor Coefficient, Water Resour. Res., 32, 161–164,
doi:10.1029/95WR02920, 1996.
Elison Timm, O., Diaz, H. F., Giambelluca, T. W., and Takahashi,
M.: Projection of changes in the frequency of heavy rain events
over Hawaii based on leading Pacific climate modes, J. Geophys.
Res., 116, D04109, doi:10.1029/2010JD014923, 2011.
Estévez, J., Gavilán, P., and Berengena, J.: Sensitivity analysis of a
Penman-Monteith type equation to estimate reference evapotranspiration in southern Spain, Hydrol. Process., 23, 3342–3353,
doi:10.1002/hyp.7439, 2009.
Evensen, C. I., Muchow, R. C., El-Swaify, S. A., and Osgood, R. V.: Yield Accumulation in Irrigated Sugarcane: I.
Effect of Crop Age and Cultivar, Agron. J., 89, 638–646,
doi:10.2134/agronj1997.00021962008900040016x, 1997.
Evett, S. R., Howell, T. A., Todd, R. W., Schneider, A. D., and
Tolk, J. A.: Alfalfa reference ET measurement and prediction,
in National irrigation symposium. Proceedings of the 4th Decennial Symposium, Phoenix, Arizona, USA, 14–16 November
2000, 266–272, American Society of Agricultural Engineers, St.
Joseph Mich., 2000.
Evett, S. R., Lascano, R. J., Howell, T. A., Tolk, J. A.,
O’Shaughnessy, S. A., and Colaizzi, P. D.: Single- and dualsurface iterative energy balance solutions for reference ET,
Trans. ASABE, 55, 533–541, doi:10.13031/2013.41388, 2012.
Ferguson, I. M. and Maxwell, R. M.: Hydrologic and land–energy
feedbacks of agricultural water management practices, Environ.
Res. Lett., 6, 014006, doi:10.1088/1748-9326/6/1/014006, 2011.
Fisher, J. B., DeBiase, T. A., Qi, Y., Xu, M., and Goldstein, A. H.: Evapotranspiration models compared on a Sierra
Nevada forest ecosystem, Environ. Model. Soft., 20, 783–796,
doi:10.1016/j.envsoft.2004.04.009, 2005.
Furon, A. C., Warland, J. S., and Wagner-Riddle, C.: Analysis of
Scaling-Up Resistances from Leaf to Canopy Using Numerical
Simulations, Agron. J., 99, 1483, doi:10.2134/agronj2006.0335,
2007.
Giambelluca, T. W., Chen, Q., Frazier, A. G., Price, J. P., Chen,
Y.-L., Chu, P.-S., Eischeid, J. K., and Delparte, D. M.: Online
Rainfall Atlas of Hawai‘i, B. Am. Meteorol. Soc., 94, 313–316,
doi:10.1175/BAMS-D-11-00228.1, 2013.
Glaz, B., Reed, S. T., and Albano, J. P.: Sugarcane Response to
Nitrogen Fertilization on a Histosol with Shallow Water Table and Periodic Flooding, J. Agron. Crop Sci., 194, 369–379,
doi:10.1111/j.1439-037X.2008.00329.x, 2008.
Gong, L., Xu, C., Chen, D., Halldin, S., and Chen, Y. D.: Sensitivity
of the Penman–Monteith reference evapotranspiration to key climatic variables in the Changjiang (Yangtze River) basin, J. Hydrol., 329, 620–629, doi:10.1016/j.jhydrol.2006.03.027, 2006.
Hargreaves, G. H. and Samani, Z. A.: Economic Considerations of Deficit Irrigation, J. Irrig. Drain. Eng., 110, 343–358,
doi:10.1061/(ASCE)0733-9437(1984)110:4(343), 1984.
Hart, Q. J., Brugnach, M., Temesgen, B., Rueda, C., Ustin, S. L.,
and Frame, K.: Daily reference evapotranspiration for California
using satellite imagery and weather station measurement interpolation, Civil Eng. Environ. Systems, 26, 19–33, 2009.
Heinz, D. J. and Osgood, R. V.: A History of the Experiment Station: Hawaiian Sugar Planters’ Association, Hawaiian Planters’
Record, 61, 1–108, 2009.
www.hydrol-earth-syst-sci.net/19/583/2015/
597
Heinz, D. J., Tew, T. L., Meyer, H. K., and Wu, K. K.: Registration
of H65-7052 Sugarcane (Reg. No. 51), Crop Sci., 21, 634–635,
doi:10.2135/cropsci1981.0011183X002100040050x, 1981.
Hemakumara, H., Chandrapala, L., and Moene, A. F.: Evapotranspiration fluxes over mixed vegetation areas measured from
large aperture scintillometer, Agr. Water Manage., 58, 109–122,
doi:10.1016/S0378-3774(02)00131-2, 2003.
Hirich, A., Choukr-Allah, R., and Jacobsen, S.-E.: Deficit Irrigation and Organic Compost Improve Growth and Yield
of Quinoa and Pea, J. Agronom. Crop Sci., 200, 390–398,
doi:10.1111/jac.12073, 2014.
Holwerda, F., Bruijnzeel, L. A., Scatena, F. N., Vugts, H. F., and
Meesters, A. G. C. A.: Wet canopy evaporation from a Puerto
Rican lower montane rain forest: The importance of realistically
estimated aerodynamic conductance, J. Hydrol., 414–415, 1–15,
doi:10.1016/j.jhydrol.2011.07.033, 2012.
Holwerda, F., Bruijnzeel, L. A., Barradas, V. L., and Cervantes, J.: The water and energy exchange of a shaded coffee plantation in the lower montane cloud forest zone of
central Veracruz, Mexico, Agr. Forest Meteorol., 173, 1–13,
doi:10.1016/j.agrformet.2012.12.015, 2013.
Huo, Z., Dai, X., Feng, S., Kang, S., and Huang, G.: Effect
of climate change on reference evapotranspiration and aridity index in arid region of China, J. Hydrol., 492, 24–34,
doi:10.1016/j.jhydrol.2013.04.011, 2013.
Inman-Bamber, N. G. and McGlinchey, M. G.: Crop coefficients
and water-use estimates for sugarcane based on long-term Bowen
ratio energy balance measurements, Field Crop Res., 83, 125–
138, doi:10.1016/S0378-4290(03)00069-8, 2003.
Inman-Bamber, N. G., Robertson, M. J., Muchow, R. C., Wood, A.
W., Pace, R., and Spillman, M. F.: Boosting yields with limited
irrigation water, Proc. Aust. Soc. Sugar Cane Techol., 21, 203–
211, 1999.
Irmak, S., Payero, J. O., Martin, D. L., Irmak, A., and Howell, T. A.: Sensitivity Analyses and Sensitivity Coefficients
of Standardized Daily ASCE-Penman-Monteith Equation, J.
Irrig. Drain. Eng., 132, 564–578, doi:10.1061/(ASCE)07339437(2006)132:6(564), 2006.
Jensen, M. E.: Water consumption by agricultural plants, in: Water
deficit and plant growth, Vol. 1. Development, control and measurement, Vol. II, 1–22, New York, London: Academic Press,
1968.
Jensen, M. E., Burman, R. D., and Allen, R. G.: Evapotranspiration
and irrigation water requirements: a manual, American Society
of Civil Engineers, New York, N.Y., 1990.
Jin, Y., Randerson, J. T., and Goulden, M. L.: Continental-scale
net radiation and evapotranspiration estimated using MODIS
satellite observations, Remote Sens. Environ., 115, 2302–2319,
doi:10.1016/j.rse.2011.04.031, 2011.
Kaimal, J. C. and Finnigan, J. J.: Atmospheric boundary layer flows:
their structure and measurement, Oxford University Press, USA,
1994.
Kang, S., Zhang, L., Liang, Y., Hu, X., Cai, H., and Gu, B.: Effects
of limited irrigation on yield and water use efficiency of winter
wheat in the Loess Plateau of China, Agr. Water Manage., 55,
203–216, doi:10.1016/S0378-3774(01)00180-9, 2002.
Kljun, N., Calanca, P., Rotach, M. W., and Schmid,
H. P.: A Simple Parameterisation for Flux Footprint
Hydrol. Earth Syst. Sci., 19, 583–599, 2015
598
R. G. Anderson et al.: Divergence of actual and reference evapotranspiration observations
Predictions, Boundary-Lay. Meteorol., 112, 503–523,
doi:10.1023/B:BOUN.0000030653.71031.96, 2004.
Kueppers, L. M., Snyder, M. A., and Sloan, L. C.: Irrigation cooling
effect: Regional climate forcing by land-use change, Geophys.
Res. Lett., 34, L03703, doi:10.1029/2006GL028679, 2007.
Lecina, S., Martínez-Cob, A., Pérez, P. J., Villalobos, F. J., and
Baselga, J. J.: Fixed versus variable bulk canopy resistance
for reference evapotranspiration estimation using the Penman–
Monteith equation under semiarid conditions, Agr. Water Manage., 60, 181–198, doi:10.1016/S0378-3774(02)00174-9, 2003.
Leuning, R., van Gorsel, E., Massman, W. J., and Isaac, P. R.: Reflections on the surface energy imbalance problem, Agr. Forest Meteorol., 156, 65–74, doi:10.1016/j.agrformet.2011.12.002,
2012.
Liang, L., Li, L., Zhang, L., Li, J., and Li, B.: Sensitivity of
penman-monteith reference crop evapotranspiration in Tao’er
River Basin of northeastern China, Chinese Geogr. Sci., 18, 340–
347, doi:10.1007/s11769-008-0340-x, 2008.
Liu, H., Zhang, R., and Li, Y.: Sensitivity analysis of reference evapotranspiration (ETo) to climate change in
Beijing, China, Desal. Water Treat., 52, 2799–2804,
doi:10.1080/19443994.2013.862030, 2014.
Lo, M.-H. and Famiglietti, J. S.: Irrigation in California’s Central
Valley Strengthens the Southwestern U.S. Water Cycle, Geophys. Res. Lett., 6, 301–306, doi:10.1002/grl.50108, 2013.
Mabhaudhi, T., Modi, A. T., and Beletse, Y. G.: Response of
taro (Colocasia esculenta L. Schott) landraces to varying water
regimes under a rainshelter, Agr. Water Manage., 121, 102–112,
doi:10.1016/j.agwat.2013.01.009, 2013.
Mauder, M. and Foken, T.: Documentation and Instruction Manual of the Eddy Covariance Software Package TK2, Universitätsbibliothek Bayreuth, Bayreuth, available at: https://epub.
uni-bayreuth.de/342/1/ARBERG046.pdf (last access: 25 October 2014), 2011.
McAneney, K. J. and Itier, B.: Operational limits to
the Priestley-Taylor formula, Irrig. Sci., 17, 37–43,
doi:10.1007/s002710050020, 1996.
McGlinchey, M. G. and Inman-Bamber, N.G.: Predicting sugarcane
water use with the Penman–Monteith equation, in Proceedings
of the International Conference on Evapotranspiration and Irrigation Scheduling, San Antonio, 592–598, ASAE, St. Joseph
Mich., 1996.
Mehrez, M. B., Taconet, O., Vidal-Madjar, D., and Valencogne, C.:
Estimation of stomatal resistance and canopy evaporation during
the HAPEX-MOBILHY experiment, Agr. Forest Meteorol., 58,
285–313, doi:10.1016/0168-1923(92)90066-D, 1992.
Meissner, R., Rupp, H., Seeger, J., Ollesch, G., and Gee, G.
W.: A comparison of water flux measurements: passive wicksamplers versus drainage lysimeters, Eur. J. Soil Sci., 61, 609–
621, doi:10.1111/j.1365-2389.2010.01255.x, 2010.
Mendez-Costabel, M. P., Wilkinson, K. L., Bastian, S. E. P., Jordans, C., McCarthy, M., Ford, C. M., and Dokoozlian, N. K.: Effect of increased irrigation and additional nitrogen fertilisation on
the concentration of green aroma compounds in V itis vinifera L.
Merlot fruit and wine: Green aroma compounds in Merlot, Aust.
J. Grape Wine Res., 20, 80–90, doi:10.1111/ajgw.12062, 2014.
Moncrieff, J. B., Massheder, J. M., de Bruin, H., Elbers, J., Friborg,
T., Heusinkveld, B., Kabat, P., Scott, S., Soegaard, H., and Verhoef, A.: A system to measure surface fluxes of momentum, sen-
Hydrol. Earth Syst. Sci., 19, 583–599, 2015
sible heat, water vapour and carbon dioxide, J. Hydrol., 188–189,
589–611, doi:10.1016/S0022-1694(96)03194-0, 1997.
Moncrieff, J., Clement, R., Finnigan, J., and Meyers, T.: Averaging, Detrending, and Filtering of Eddy Covariance Time Series,
in: Handbook of Micrometeorology, Vol. 29, edited by: Lee, X.,
Massman, W., and Law, B., 7–31, Kluwer Academic Publishers,
Dordrecht, 2004.
Monteith, J. L.: Evaporation and environment, Symp. Soc. Exp.
Biol., 19, 205–234, 1965.
Moore, R. C. and Fitschen, J. C.: The drip irrigation revolution in
the Hawaiian sugarcane industry, in Visions of the future?: proceedings of the 3. National Irrigation Symposium, held in conjunction with the 11. Annual International Irrigation Exposition,
1990, Phoenix Civic Plaza, Phoenix, Arizona, ASAE, St. Joseph,
Mich., 1990.
Obukhov, A. M.: Turbulence in an atmosphere with a nonuniform temperature, Boundary-Lay. Meteorol., 2, 7–29,
doi:10.1007/BF00718085, 1971.
Olivier, F. and Singels, A.: The effect of crop residue layers on evapotranspiration, growth and yield of irrigated sugarcane, Water
SA, 38, 78–86, doi:10.4314/wsa.v38i1.10, 2012.
Perry, C.: Irrigation reliability and the productivity of water: A
proposed methodology using evapotranspiration mapping, Irrig.
Drain. Systems, 19, 211–221, doi:10.1007/s10795-005-8135-z,
2005.
Priestley, C. H. B. and Taylor, R. J.: On the Assessment of
Surface Heat Flux and Evaporation Using Large-Scale Parameters, Mon. Weather Rev., 100, 81–92, doi:10.1175/15200493(1972)100<0081:OTAOSH>2.3.CO;2, 1972.
Puma, M. J. and Cook, B. I.: Effects of irrigation on global climate during the 20th century, J. Geophys. Res., 115, D16120,
doi:10.1029/2010JD014122, 2010.
Ramjeawon, T.: Water resources management on the small Island of Mauritius, Int. J. Water Resour. D., 10, 143–155,
doi:10.1080/07900629408722619, 1994.
Rao, L., Sun, G., Ford, C., and Vose, J.: Modeling potential evapotranspiration of two forested watersheds in
the southern Appalachians, Trans. ASABE, 54, 2067–2078,
doi:10.13031/2013.40666, 2011.
Reichstein, M., Falge, E., Baldocchi, D., Papale, D., Aubinet,
M., Berbigier, P., Bernhofer, C., Buchmann, N., Gilmanov,
T., Granier, A., Grunwald, T., Havrankova, K., Ilvesniemi, H.,
Janous, D., Knohl, A., Laurila, T., Lohila, A., Loustau, D., Matteucci, G., Meyers, T., Miglietta, F., Ourcival, J.-M., Pumpanen,
J., Rambal, S., Rotenberg, E., Sanz, M., Tenhunen, J., Seufert, G.,
Vaccari, F., Vesala, T., Yakir, D., and Valentini, R.: On the separation of net ecosystem exchange into assimilation and ecosystem
respiration: review and improved algorithm, Glob. Change Biol.,
11, 1424–1439, doi:10.1111/j.1365-2486.2005.001002.x, 2005.
Salazar, M. R., Hook, J. E., Garcia y Garcia, A., Paz, J. O., Chaves,
B., and Hoogenboom, G.: Estimating irrigation water use for
maize in the Southeastern USA: A modeling approach, Agr. Water Manage., 107, 104–111, doi:10.1016/j.agwat.2012.01.015,
2012.
Salinas, F. and Namken, L. N.: Irrigation scheduling for sugarcane
in the Lower Rio Grande Valley of Texas, Proc. Am. Soc. Sugar
Cane Technol., 6, 186–191, 1977.
Smith, M.: The application of climatic data for planning and
management of sustainable rainfed and irrigated crop produc-
www.hydrol-earth-syst-sci.net/19/583/2015/
R. G. Anderson et al.: Divergence of actual and reference evapotranspiration observations
tion, Agr. Forest Meteorol., 103, 99–108, doi:10.1016/S01681923(00)00121-0, 2000.
Soopramanien, G. C., Berthelot, B., and Batchelor, C. H.: Irrigation research, development and practice in Mauritius, Agr. Water Manage., 17, 129–139, doi:10.1016/0378-3774(90)90060-C,
1990.
Sprintsin, M., Chen, J. M., Desai, A., and Gough, C. M.: Evaluation of leaf-to-canopy upscaling methodologies against carbon
flux data in North America, J. Geophys. Res., 117, G011023,
doi:10.1029/2010JG001407, 2012.
Suleiman, A. A. and Hoogenboom, G.: Comparison of PriestleyTaylor and FAO-56 Penman-Monteith for Daily Reference Evapotranspiration Estimation in Georgia, J. Irrig. Drain. Eng., 133,
175–182,
doi:10.1061/(ASCE)0733-9437(2007)133:2(175),
2007.
Suleiman, A. A. and Hoogenboom, G.: A comparison of ASCE
and FAO-56 reference evapotranspiration for a 15-min time
step in humid climate conditions, J. Hydrol., 375, 326–333,
doi:10.1016/j.jhydrol.2009.06.020, 2009.
Szeicz, G. and Long, I. F.: Surface Resistance of
Crop Canopies, Water Resources Res., 5, 622–633,
doi:10.1029/WR005i003p00622, 1969.
Tang, Q., Peterson, S., Cuenca, R. H., Hagimoto, Y., and Lettenmaier, D. P.: Satellite-based near-real-time estimation of irrigated crop water consumption, J. Geophys. Res., 114, D05114,
doi:10.1029/2008JD010854, 2009.
Thompson, G. D. and Boyce, J. P.: Daily measurements of potential
evapotranspiration from fully canopied sugarcane, Agric. Meteorol., 4, 267–279, doi:10.1016/0002-1571(67)90027-1, 1967.
Tian, D. and Martinez, C. J.: Forecasting Reference Evapotranspiration Using Retrospective Forecast Analogs in the Southeastern United States, J. Hydrolmeteorol., 13, 1874–1892,
doi:10.1175/JHM-D-12-037.1, 2012.
Tolk, J. A., Howell, T. A., Steiner, J. L., and Krieg, D. R.: Corn
canopy resistance determined from whole plant transpiration, in:
Proceedings of the International Conference on Evapotranspiration and Irrigation Scheduling, San Antonio, 347–351, ASAE,
St. Joseph Mich., 1996.
www.hydrol-earth-syst-sci.net/19/583/2015/
599
Ventura, F., Spano, D., Duce, P., and Snyder, R. L.: An evaluation of
common evapotranspiration equations, Irrig. Sci., 18, 163–170,
doi:10.1007/s002710050058, 1999.
Vickers, D. and Mahrt, L.: Quality Control and Flux Sampling Problems for Tower and Aircraft Data, J. Atmos. Ocean. Technol., 14, 512–526, doi:10.1175/15200426(1997)014<0512:QCAFSP>2.0.CO;2, 1997.
Vörösmarty, C. J., Federer, C. A., and Schloss, A. L.: Potential
evaporation functions compared on US watersheds: Possible implications for global-scale water balance and terrestrial ecosystem modeling, J. Hydrol., 207, 147–169, doi:10.1016/S00221694(98)00109-7, 1998.
Waterloo, M. J., Bruijnzeel, L. A., Vugts, H. F., and Rawaqa, T. T.:
Evaporation from Pinus caribaea plantations on former grassland
soils under maritime tropical conditions, Water Resour. Res., 35,
2133–2144, doi:10.1029/1999WR900006, 1999.
Webb, E. K., Pearman, G. I., and Leuning, R.: Correction of
flux measurements for density effects due to heat and water vapour transfer, Q. J. Roy. Meteorol. Soc., 106, 85–100,
doi:10.1002/qj.49710644707, 1980.
Widmoser, P.: A discussion on and alternative to the Penman–
Monteith equation, Agr. Water Manage., 96, 711–721,
doi:10.1016/j.agwat.2008.10.003, 2009.
Zhang, B., Kang, S., Li, F., and Zhang, L.: Comparison of
three evapotranspiration models to Bowen ratio-energy balance method for a vineyard in an arid desert region of
northwest China, Agr. Forest Meteorol., 148, 1629–1640,
doi:10.1016/j.agrformet.2008.05.016, 2008.
Zhao, L., Xia, J., Xu, C., Wang, Z., Sobkowiak, L., and Long, C.:
Evapotranspiration estimation methods in hydrological models,
J. Geograph. Sci., 23, 359–369, doi:10.1007/s11442-013-10159, 2013.
Hydrol. Earth Syst. Sci., 19, 583–599, 2015

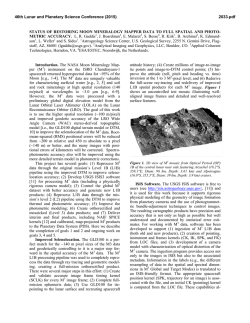
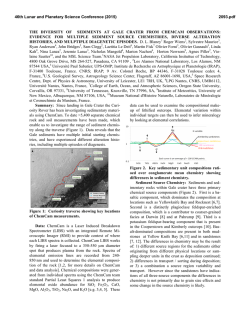
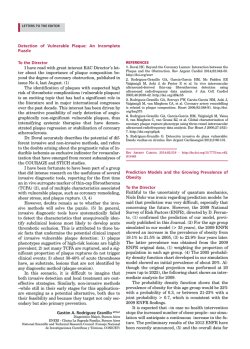
© Copyright 2026