
Full Text (PDF) - Research in Cardiovascular Medicine
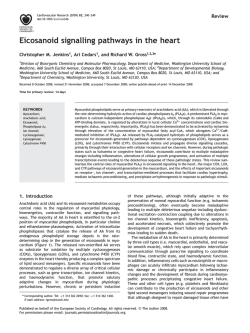
Res Cardiovasc Med. 2015 February; 4(1): e25018. DOI: 10.5812/cardiovascmed.25018 Research Article Published online 2015 February 20. Metabolic Syndrome is Associated With Higher Wall Motion Score and Larger Infarct Size After Acute Myocardial Infarction 1 2,* 3 4 Shokoufeh Hajsadeghi ; Mitra Chitsazan ; Mandana Chitsazan ; Majid Haghjoo ; Nima 5 1 1 Babaali ; Zahra Norouzzadeh ; Maryam Mohsenian 1Department of Cardiology, Rasoul-e-Akram Hospital, Iran University of Medical Sciences, Tehran, IR Iran 2Echocardiography Research Center, Rajaie Cardiovascular, Medical and Research Center, Iran University of Medical Sciences, Tehran, IR Iran 3Department of Cardiology, Shahid Beheshti University of Medical Sciences, Tehran, IR Iran 4Cardiac Electrophysiology Research Center, Rajaie Cardiovascular, Medical and Research Center, Iran University of Medical Sciences, Tehran, IR Iran 5Department of Cardiology, Rajaei Cardiovascular, Medical and Research Center, Iran University of Medical Sciences, Tehran, IR Iran *Corresponding author: Mitra Chitsazan, Echocardiography Research Center, Rajaie Cardiovascular, Medical and Research Center, Iran University of Medical Sciences, Tehran, IR Iran. Tel: +98-9122210385, Fax: +98-2122055594, E-mail: [email protected] Received: October 30, 2014; Accepted: December 29, 2014 Background: Infarct size is an important surrogate end point for early and late mortality after acute myocardial infarction. Despite the high prevalence of metabolic syndrome in patients with atherosclerotic diseases, adequate data are still lacking regarding the extent of myocardial necrosis after acute myocardial infarction in these patients. Objectives: In the present study we aimed to compare myocardial infarction size in patients with metabolic syndrome to those without metabolic syndrome using peak CK-MB and cardiac troponin I (cTnI) at 72 hours after the onset of symptoms. Patients and Methods: One-hundred patients with metabolic syndrome (group I) and 100 control subjects without metabolic syndrome (group II) who experienced acute myocardial infarction were included in the study. Diagnosis of metabolic syndrome was based on the National Cholesterol Education Program Adult Treatment Panel III (NCEP ATP III) guidelines published in 2001. Myocardial infarction size was compared between the two groups of patients using peak CK-MB and cTnI level in 72 hours after the onset of symptoms. Results: Peak CK-MB and cTnI in 72 hours were found to be significantly higher in patients with metabolic syndrome compared with control subjects (both P < 0.001). Patients with metabolic syndrome also had markedly higher wall motion abnormality at 72 hours after the onset of symptoms as assessed by echocardiographically-derived Wall Motion Score Index (WMSI) (P < 0.001). Moreover, statistically significant relationships were found between WMSI and peak CK-MB and also cTnI at 72 hours (Spearman's rho = 0.56, P < 0.001 and Spearman's rho = 0.5, P < 0.001; respectively). However, association between WMSI and left ventricular ejection fraction was insignificant (Spearman's rho = -0.05, P = 0.46). Conclusions: We showed that patients with metabolic syndrome have larger infarct size compared to control subjects. Keywords:Creatine Kinase; Echocardiography; Myocardial infarction; Troponin 1. Background The metabolic syndrome (also named insulin resistance syndrome or syndrome X) is defined as the clustering of interrelated atherosclerotic risk factors including insulin resistance, high blood pressure, a low level of highdensity lipoprotein (HDL) cholesterol, a high triglyceride level, a high plasma glucose concentration, and central obesity (1-3). Coronary artery disease and stroke have been reported to be three-times higher in patients with the metabolic syndrome compared with those without metabolic syndrome (4). The National Cholesterol Education Program Adult Treatment Panel III (NCEP ATP III) guidelines published in 2001 introduced the metabolic syndrome as a new target for cardiovascular risk reduction therapy beyond low-density lipoprotein (LDL) cholesterol lowering (5). Following acute myocardial infarction, prognosis is largely related to the extent of myocardial necrosis and the resultant decline in left ventricular function (6). Infarct size is an important surrogate end point for early and late mortality after acute myocardial infarction (AMI) (7). Several methods have been used to estimate infarct size in patients with AMI including global left ventricular function or ejection fraction, end systolic volume, regional wall motion, creatine kinase release, thallium infarct size, QRS score based on evolutionary ST and T wave changes, radionuclide myocardial perfusion imaging with 99 m-technetium sestamibi and late gadolinium-enhanced cardiovascular magnetic resonance (CMR). Accumulating evidence has consistently confirmed the usefulness of cTnT or cTnI for the estimation of infarct size (8-10). Despite the high prevalence of metabolic syndrome in patients with atherosclerotic diseases and also considerable morbidity and mortality of acute coronary syn- Copyright © 2015, Rajaie Cardiovascular Medical and Research Center, Iran University of Medical Sciences. This is an open-access article distributed under the terms of the Creative Commons Attribution-NonCommercial 4.0 International License (http://creativecommons.org/licenses/by-nc/4.0/) which permits copy and redistribute the material just in noncommercial usages, provided the original work is properly cited. Hajsadeghi S et al. dromes in patients with metabolic syndrome, adequate data are still lacking regarding the extent of myocardial necrosis after AMI in patients with metabolic syndrome. 2. Objectives In the present study we aimed to evaluate myocardial infarction size, as estimated by means of cardiac enzymes and echocardiographically-derived wall motion score index (WMSI) in patients with metabolic syndrome comparing to control individuals. 3. Patients and Methods 3.1. Study Population The study group consisted of a consecutive series of 200 patients with first acute myocardial infarction (AMI) admitted to the coronary care unit at Rajaei Cardiovascular, Medical and Research Center (Tehran, Iran) from April 2011 to June 2013. Patients were included if they met the universal definition of acute myocardial infarction (11) and had no history of documented prior coronary artery disease, AMI, coronary bypass surgery, valvular heart disease, left ventricular dysfunction, left ventricular hypertrophy, atrial fibrillation, uncontrolled hypertension or poorly controlled obstructive airway disease. Patients were eligible whether presenting with ST-segment elevation myocardial infarction (STEMI) or non– ST-segment elevation myocardial infarction (NSTEMI). Patients who underwent percutaneous coronary intervention as part of reperfusion therapy (those patients with STEMI presenting within 12 hours of onset of symptoms) and also those with recurrent AMI or congestive heart failure during hospital admission were excluded. For patients presenting with NSTEMI, initial antithrombotic therapy was instituted and subsequent angiography was performed within the first week after the required data were obtained for the study. Eligible patients were classified according to the National Cholesterol Education Program Adult Treatment Panel III guideline into the 2 groups of patients with and without metabolic syndrome. 3.2. Diagnostic Criteria for Metabolic Syndrome The diagnosis of metabolic syndrome was based on the National Cholesterol Education Program Adult Treatment Panel III (NCEP ATP III) guidelines published in 2001 (5). According to this guideline, patients were found to have metabolic syndrome when three or more of the following criteria were present: 1) abdominal obesity (waist circumference > 102 cm in men and > 88 cm in women); 2) a high triglyceride level (> 150 mg/dL); 3) a low HDLcholesterol level (< 40 mg/dL in men and < 50 mg/dL in women); 4) high blood pressure (systolic > 130 mmHg or diastolic > 85 mmHg, or on antihypertensive medication); and 5) a high fasting plasma glucose concentration 2 (> 110 mg/dL). Control subjects had only ≤ 2 of these components. 3.3. Cardiac Enzymes Assay Serum cardiac troponin I (cTnI) level at 72 hours after presentation of acute myocardial infarction (from symptom-onset) and peak creatine kinase-MB fraction (CK-MB) level were used for estimation of infarct size. Serum CKMB was measured with 12-hour intervals during the first 5 days after symptom-onset and the peak level was used for this purpose. 3.4. Biochemical Analysis Blood samples were taken after a 12-hours fasting from an antecubital vein with a 19-gauge needle without venous stasis for measuring total cholesterol, triglyceride, HDL-cholesterol, LDL-cholesterol, and fasting plasma glucose levels approximately 7-10 days after hospitalization for recent acute myocardial infarction. Plasma was immediately obtained by centrifugation of the blood at 3000 g for 15 minutes. Serum concentrations of total cholesterol and triglycerides were measured by fully enzymatic techniques. HDL-cholesterol was determined after precipitation of apolipoprotein B–containing lipoproteins with chloride and dextran sulfate. LDL-cholesterol was calculated as described by Friedewald et al. (12). Plasma glucose was measured with the glucose oxidase technique. 3.5. Anthropometric Measurements Height, weight, and waist circumference were measured according to a standardized protocol. Body mass index (BMI) was calculated by dividing weight in kilograms by height in meters squared (kg/m2). The waist circumference was measured at its smallest point with the abdomen relaxed. 3.6. Standard Echocardiography Transthoracic echocardiography was performed at a median five days [IQR 2 to 9 days] after AMI using a commercially available ultrasound system (Vivid 7, GE Medical Systems, Inc., Horten, Norway). All images were analyzed offline by a single investigator, blinded to all clinical data. Images were acquired at the end of expiration with the subjects at rest, lying in the left lateral decubitus position. Two-dimensional ECG was superimposed on the images, and end-diastole was considered at the peak R wave of the ECG. Standard two-dimensional measurements and pulsed-wave Doppler echocardiography were performed. Left ventricular ejection fraction (LVEF) was calculated using the modified biplane Simpson method as recommended by the American of Echocardiography. Measurements were averaged over at least three cardiac cycles. Regional wall motion was evaluated using a 16-segment model as recommended by the European SocietRes Cardiovasc Med. 2015;4(1):e25018 Hajsadeghi S et al. ies of Echocardiography (13). The left ventricle (LV) was divided into six basal segments (anterior, anterolateral, inferolateral, inferior, inferoseptal, and anteroseptal), six middle segments (same subgroups), and four apically located segments (anterior, septal, inferior, and posterior). By visual analysis of systolic wall thickening, segments were assigned a wall motion score (WMS) as follows: 1, normal or hyperkinetic (normal endocardial excursion and systolic wall thickening); 2, hypokinetic (reduced excursion and wall thickening); 3, akinetic (absent excursion and wall thickening); and 4, dyskinetic (paradoxical systolic outward wall motion). WMS index (WMSI) was calculated by dividing the sum of all WMS by the total number of segments analyzed. For estimation of WMSI, the intraclass correlation coefficients for intraobserver and interobserver reproducibility were 0.95 (0.78 to 0.98) and 0.89 (0.76 to 0.98), respectively. 3.7. Statistical Analysis All analyses were conducted by statistical package for social sciences (SPSS) software, version 19 (SPSS Inc., Chicago, IL, USA). All data initially were analyzed using the Kolmogorov-Smirnov test to assess for normality. Continuous data are presented as mean ± SD when normally distributed and median with interquartile range (IQR) when non-Gaussian in distribution. Unpaired t-tests and Mann-Whitney-U rank sum tests were used for bivariate analyses of normally and non-normally distributed continuous data, respectively. Categorical data were given as frequencies and percentages, and bivariate analyses of these data were performed using chi-square or Fisher’s exact tests, when appropriate. The correlations between echocardiographic measures and cardiac enzymes were assessed by the spearman correlation test. A P value of < 0.05 was considered statistically significant. A multiple regression analysis was performed to further quantify Table 1. Baseline Characteristics of Study Population a Variable Age, yr Gender, % Male Female Current smoking Body mass index, kg/m2 Waist circumference, cm Systolic blood pressure, mmHg Diastolic blood pressure, mmHg Fasting blood glucose, mg/dL Triglyceride, mg/dL Total cholesterol, mg/dL LDL-cholesterol, mg/dL HDL-cholesterol, mg/dL Number of components of metabolic syndrome the relationships between regional wall mostion score index (RWMSI), and cardiac enzymes and also the components of the metabolic syndrome. The median RWMSI was regressed for waist circumference, BMI, HDL-cholesterol, LDL-cholesterol, total cholesterol, fasting plasma glucose, triglyceride level, systolic and diastolic blood pressure, peak CK-MB and cTnI at 72 hours. 4. Results Baseline characteristics of patients with metabolic syndrome and controls are presented in Table 1. Patients with metabolic syndrome were older, and had higher diastolic blood pressure, BMI, waist circumference, serum triglyceride, total cholesterol, LDL-cholesterol and fasting plasma glucose and lower HDL-cholesterol compared with control subjects. However, no significant differences were seen between the two groups with respect to gender, systolic blood pressure and the status of cigarette smoking. The relative frequency of each component of the metabolic syndrome is shown in Table 2. An increased blood pressure (systolic ≥ 130 mmHg or diastolic ≥ 85 mmHg) and a high triglyceride level (> 150 mg/dL) were the most frequent components of the metabolic syndrome in the metabolic syndrome group (96% and 90%, respectively). In patients with metabolic syndrome, three, four and five components of the metabolic syndrome were found to be present in 16 (16%), 46 (46%), and 38 (38%) patients, respectively. The distribution of various types of ST-elevation myocardial infarction as well as NSTEMI in patients with and without metabolic syndrome is depicted in Figure 1. Patients with metabolic syndrome were more likely to have anterior or anterolateral ST-segment elevation myocardial infarction (STEMI) while inferior and inferoposterior STEMI were more prevalent in patients without metabolic syndrome (P = 0.003). Metabolic Syndrome (+) 63 (62-72) Metabolic Syndrome (-) 62 (58-68) 78 (78) 22 (22) 42 (42) 31.34 ± 3.91 105 (99-109) 134.37 ± 23.88 87.40 ± 3.07 143 (124-163) 186 (175-198) 201 (187-243) 184 (131-245) 34 (25-43) 1.03 ± 0.27 67 (67) 33 (33) 39 (39) 29.66 ± 3.55 84 (78-88) 133.53 ± 23.98 79.44 ± 9.89 82 (72-116) 179 (140-185) 198 (181-213) 136 (97-163) 42 (31-46) 4.28 ± 0.65 P Value 0.001 0.082 0.076 0.005 < 0.001 0.940 < 0.001 < 0.001 < 0.001 0.041 < 0.001 < 0.001 0.001 a Mean ± SD or median (interquartile range). Res Cardiovasc Med. 2015;4(1):e25018 3 Hajsadeghi S et al. Table 2. Relative Frequency of Each Component of Metabolic Syndrome in Metabolic Syndrome Group Variable No. (%) Abdominal obesity (waist circumference) 65 (65) > 88 cm in women > 102 cm in men Blood pressure, mmHg 96 (96) Systolic ≥ 130 Diastolic ≥ 85 High fasting plasma glucose, mg/dL (≥ 110) High triglyceride level, mg/dL (≥ 150) Low HDL-cholesterol level, mg/dL 74 (74) 90 (90) 68 (68) < 50 for women < 40 for men In Table 3, a comparison of echocardiographic measures has been made between the patients with metabolic syndrome and control subjects. As shown, except for tricuspid regurgitation gradient (TRG), no significant differences were seen between the two study groups with respect to conventional echocardiographic parameters. However, severity of diastolic dysfunction was significantly higher in patients with metabolic syndrome as compared to control subjects (Table 3, P = 0.002). Transmitral Doppler echocardiography also showed higher E wave and A wave velocities in patients with metabolic syndrome than in controls (Table 4, p=0.003 and 0.012, respectively). 4.1. Estimation of the Infarct Size by Cardiac Enzymes Peak CK-MB was significantly higher in patients with metabolic syndrome as compared to control subjects (median: 390 ng/mL, IQR: 379-410 ng/mL versus median: 287 ng/mL, IQR: 275-296 ng/mL; P < 0.001). Patients with Table 3. Conventional Echocardiographic Characteristics a Parameter PWT, cm IVST, cm LVEDD, cm LVESD, cm LVEF, % WMSI PAP, mmHg TRG, mmHg TAPSE, mm Metabolic Syndrome (+) Metabolic Syndrome (-) P Value 0.97 ± 0.11 0.93 ± 0.15 0.298 4.50 ± 0.53 4.38 ± 0.53 0.96 ± 0.10 2.97 ± 0.64 58.13 ± 9.71 58.72 ± 5.60 < 0.001 27.69 ± 7.86 23.65 ± 5.77 0.039 34.44 ± 8.81 30.16 ± 5.98 6 (6) 7 (7) Large 1 (6) 1 (1) Trivial 3 (6) 5 (5) 16 (16) Moderate 2 (2) 4 (4) Moderate to severe 3 (3) 6 (6) 4 (4) Mild 8 (8) 5 (5) Severe 8 (8) 7 (7) Moderate 5 (5) a Data are presented as No. (%) or Mean ± SD and median (interquartile range).ظ Table 4. Transmitral Doppler Data Peak early diastolic velocity (E), m/s Peak late diastolic velocity (A), m/s 0.065 4 (4) Severe Severity of diastolic dysfunction 0.795 0.087 6 (6) 13 (13) 4 (4) 0.662 1 (1) Mild Mild to moderate 0.967 2.29 (2.11-2.41) Small Mitral regurgitation 0.311 0.326 2.91 (2.54-3.29) 17.06 ± 3.96 Moderate 0.237 2.78 ± 0.45 17.35 ± 3.75 Pericardial effusion 4 0.93 ± 0.11 3 (3) 0.002 3 (3) Metabolic Syndrome (+) Metabolic Syndrome (-) P Value 0.85 ± 0.13 0.80 ± 0.19 0.003 1.88 ± 0.45 1.81 ± 0.53 0.012 Res Cardiovasc Med. 2015;4(1):e25018 Hajsadeghi S et al. metabolic syndrome also had higher cTnI level at 72 hours after the onset of symptoms comparing to controls (median: 18 µg/L, IQR: 17-19 µg/L versus median: 12 µg/L, IQR: 11-13 µg/L; P < 0.001). R2Liner=0.283 80.0 4.2. Estimation of the Infarct Size by Echocardiography Figure 1. The Distribution of Various Types of Acute Myocardial Infarc- 60.0 RWMSI Median regional wall motion score index was 2.91 (IQR: 2.54-3.29) in patients with metabolic syndrome, which was markedly higher than in control patients (median: 2.29, IQR: 2.11-2.41; P < 0.001). No significant correlation was found between RWMSI and left ventricular ejection fraction (Spearman's rho = -0.05, P = 0.46). This correlation was also insignificant in both groups of patients with and without metabolic syndrome (P = 0.47 and P = 0.32, respectively). However, RWMSI and peak CK-MB were positively correlated (Spearman's rho = 0.56, P < 0.001, Figure 2). Higher RWMSI was also significantly associated with an increased cTnI serum level at day 3 (Spearman's rho = 0.50, P < 0.001, Figure 3). 40.0 20.00 200.00 300.00 400.00 500.00 Peak CK-MB Figure 2. Peak CK-MB Level and RWMSI are Positively Correlated (Spearman's rho = 0.56, P < 0.001) in Patients With Acute ST Elevation Myocardial Infarction tion in Patients With and Without Metabolic Syndrome (P = 0.003) 50.0% R2Liner=0.258 Metabolic synrome (+) Metabolic synrome (-) 80.0 30.0% RWMSI Percent 40.0% 20.0% 10.0% NSTEMI Other* Inferoposterior STEMI Inferior STEMI Anterolateral STEMI 40.0 Anterior STEMI 0.0% 20.00 10.00 * Other: infarction involving either right ventricle or interventricular septum. Table 5. Estimation of Infarct Size in Various Types of AMI a, b Type of AMI Anterior STEMI CK.MB, mg/dL 367.5 (296.75-395.50) cTnI, mg/dL LVEF, % WMSI 60.0 Anterolateral Inferior STEMI STEMI 12.00 14.00 16.00 cTnI 18.00 20.00 22.00 Figure 3. Cardiac Troponin I Level at 72 Hours After Onset of Symptoms and RWMSI Are Positively Correlated (Spearman's rho = 0.50, P < 0.001) in Patients With Acute Myocardial Infarction Inferoposterior STEMI Other c NSTEMI P Value 350 (290-397) 300.00 (283-390) 296.50 (291.5-382.5) 277.00 (245-299.5) 289 (279.25-298.75) 0.005 17 (13-19) 16 (12-18) 15 (12-19) 12.5 (11-17.75) 12 (11.5-12.5) 12 (11-14) 0.002 35 (30-40) 35 (32.5-40) 35 (30-40) 35 (30-40) 40 (35-42.5) 35 (30-40) 0.57 2.58 (2.23-2.94) 2.64 (2.17-3.17) 2.41 (2.17-2.94) 2.35 (2.23-2.75) 2.41 (2.29-2.55) 2.38 (2.29-2.45) 0.35 b other: infarctions involving either right ventricle of interventricular septum. a Data are presented as median (interquartile range). b Abbreviations: AMI, acute myocardial infarction; CK-MB, creatine kinase-MB fraction; cTnI, cardiac troponin I; LVEF, left ventricular ejection fraction; NSTEMI, non-ST-segment elevation myocardial infarction; STEMI, ST-segment elevation myocardial infarction; WMSI, wall motion score index. c Other: ST-segment elevation myocardial infarctions involving either right ventricle of interventricular septum. Res Cardiovasc Med. 2015;4(1):e25018 5 Hajsadeghi S et al. Peak CK-MB level and cTnI level at 72 hours were significantly different in various types of acute myocardial infarction (P = 0.005 and 0.002; respectively, Table 5). However, LVEF and WMSI were statistically similar in all types of acute myocardial infarction (P = 0.57 and 0.35; respectively, Table 5). No statistically significant correlations were also seen between left ventricular ejection fraction and either peak CK-MB or cTnI at 72 hours (Spearman’s rho = -0.055, P = 0.051 and Spearman’s rho = -0.059, P = 0.052; respectively). The results of multiple regression analysis indicated statistically significant relationships between median RWMSI and waist circumference (P < 0.001), LDL- cholesterol level (P = 0.005) and peak CK-MB (P = 0.014). 5. Discussion The main finding of this study is that patients with metabolic syndrome have significantly higher infarct size compared to those without metabolic syndrome. A growing body of literature has been shown that metabolic syndrome, as defined by the NCEP ATP III criteria, is very common among patients with symptomatic arterial disease, and is also associated with advanced vascular damage and subsequently worse prognosis (14). Metabolic syndrome represents a collection of several cardiovascular risk factors, each of which may play an important role in this poor outcome. In a large study on 1108 patients with symptomatic coronary artery disease, metabolic syndrome has been found in 51% of the patients (15). The results of this study also demonstrated that the number of components of metabolic syndrome, as defined by the NCEP ATP III criteria, increases with the severity of angiographically-proven coronary artery disease. Moreover, it has been demonstrated that increased number of components of the metabolic syndrome was associated with a higher mean carotid intima media thickness and also a lower ankle brachial pressure index in patients with coronary heart disease, peripheral arterial disease, or abdominal aortic aneurysm (14). Patients with metabolic syndrome, which had angiographicallyproven normal coronary arteries, have been shown to have significantly higher thrombolysis in myocardial infarction (TIMI) frame count for all three major epicardial coronary vessels, compared to those without metabolic syndrome (16). In addition, impacts of metabolic syndrome on outcome of patients with myocardial infarction have been shown previously. Patients with metabolic syndrome have been shown to have higher case fatality rate following acute myocardial infarction (17). In a large study involving 4483 patients aged 35 to 70 years in Finland and Sweden, metabolic syndrome -as defined by the World Health Organization- was present in approximately 80% of subjects with type two diabetes mellitus (DM) (18). In that study, individuals with metabolic syndrome had markedly higher cardiovascular case fatality rate com6 pared to individuals without metabolic syndrome (12.0% versus 2.2%; P < 0.001). In a population-based registry of patients with myocardial infarction, metabolic syndrome - as defined by the NCEP ATP III criteria - has been demonstrated to be associated with worse in-hospital outcome (17). The results of that study also revealed that patients with metabolic syndrome are at increased risk of development of heart failure and cardiogenic shock as compared to patients without metabolic syndrome. They also found that among all components of metabolic syndrome, hyperglycemia seems to be the major determinant of this increased risk of heart failure. Logstrup et al. in an observational study assessed the effects of known DM, newly diagnosed DM, and impaired glucose tolerance (IGT) on echocardiography-derived coronary flow reserve (CFR) in a group of patients with recent AMI (19). They found persistent association between a decreased CFR and overt or newly diagnosed DM but not the IGT. They demonstrated that CFR in patients with IGT was not different from CFR in patients with normal glucose metabolism. Fujimoto et al. demonstrated that hyperglycemia is associated with suppressed coronary microcirculation in healthy young adults (20). The leukocyte capillary plugging, enhanced shear stress-induced platelet activation, and accumulation of advanced glycation products (21, 22) result from persistent hyperglycemia and have been considered as probable mechanisms, which might explain the association between hyperglycemia and microvascular dysfunction. However, very limited clinical data have addressed myocardial infarction size in patients with metabolic syndrome comparing to control subjects without metabolic syndrome. According to results of the present study, patients with metabolic syndrome had larger infarct size than control subjects. This finding might partly explain the higher risk of development of heart failure following acute myocardial infarction in patients with metabolic syndrome. Notably, large observational studies have found heart failure as a major determinant of outcome after acute coronary syndromes (23-25). Moreover, it has been shown that increased incidence of congestive heart failure due to severe pump failure results in the higher in-hospital case fatality rate in diabetic patients as compared to patients without diabetes (26). After acute myocardial infarction, the extent of myocardial damage determines the prognosis of patients to a large degree (6). In clinical practice, several non-invasive techniques are used to estimate infarct size and LV function including radionuclide imaging, technetium-99 m sestamibi or thallium scintigraphy. However, most of these modalities lack the adequate resolution or acceptable availability and cost-effectiveness (27). Among these techniques, late gadolinium-enhanced cardiovascular magnetic resonance has been found to have superior performance in the estimation of infarct size and quantification of LV function (28). Cardiac biomarkers Res Cardiovasc Med. 2015;4(1):e25018 Hajsadeghi S et al. such as CK-MB and different types of cardiac troponins have gained increasing utility due to their ability in the diagnosis, stratification and also prediction of patients` outcome following acute coronary syndromes (29-31). There is convincing evidence from several trials that CKMB and cardiac troponins I and/or T are also useful for rough estimation of the extent of myocardial damage (810, 32-34). The major limitation of cytoplasmic enzymes such as CK or CK-MB in the estimation of infarct size is the need for serial measurements to identify peak or cumulative serum concentrations. Furthermore, cytoplasmic enzymes are highly affected by reperfusion and also lack cardio-specificity (35). In contrast, cardiac troponins are cardiac-specific proteins that are incorporated in the contractile apparatus of cardiomyocytes. Except for the small cytosolic fraction, release of troponins after AMI is prolonged and is not influenced by the reperfusion of the infarct zone (35). Several experimental (36, 37) and clinical studies (38) have shown that a single cTnT-measured 72–96 hours after the onset of symptoms-is useful for estimation of infarct size and is at least as effective as several measurements of cardiac enzymes for assessment of cumulative release or peak values. Steen et al. in a study on 44 patients with first ST- and non-ST-segment elevation myocardial infarction showed that a single cTnT value at 72–96 hours after onset of symptoms can be reliably used for the estimation of left ventricular function and infarct size after acute myocardial infarction (39). In a trial in 65 patients, peak levels of CK-MB and troponin T have been shown to be correlated with SPECT infarct size and LV function on day three and three months after infarction (8). In another study on 23 patients with ST-elevation and 21 patients with non–ST-elevation myocardial infarction, peak level of troponin T at 96 hours was correlated with magnetic resonance imaging infarct size (40). In addition, infarct size as determined by peak serum concentration of creatine kinase or creatine kinase-MB or their area under the curve has been shown to be associated with worse outcome, including cardiogenic shock (41) congestive heart failure (42, 43) and short- and long-term mortality (44-47). In the present investigation, we used peak CK-MB and cardiac troponin I at 72 hours after the onset of symptoms to estimate size of myocardial infarction. We showed that patients with metabolic syndrome had higher serum levels of peak CK-MB and cTnI at 72 hours after symptoms onset comparing to those without metabolic syndrome. We also investigated echocardiographically-derived regional wall motion score index to give a rough estimate of myocardial infarction size. We demonstrate that patients with metabolic syndrome have significantly higher WMSI than control subjects. However, still there is a large discrepancy in the medical literature regarding the association between metabolic syndrome and infarct size. Clavijo et al. in a comparison between 167 non-diabetic patients with metabolic syndrome and 133 control patients without metabolic syndrome or diabetes mellitus demonstrated larger infarct size and higher Res Cardiovasc Med. 2015;4(1):e25018 in-hospital complications in patients with metabolic syndrome (48). In another study, Kranjcec et al. in a study on 141 patients with metabolic syndrome and 89 control patients presenting with acute coronary syndrome, also showed that patients with metabolic syndrome had larger infarct size (49). Similar to our study, these two studies have used peak CK-MB to determine the infarct size (48, 49). On the other hand, Bohmer et al. in a cross-sectional study including 152 patients (33 patients with metabolic syndrome) found no significant difference in median infarct size, as assessed by late gadolinium enhanced magnetic resonance imaging, between patients with and without metabolic syndrome (50). However, it is worth noting that RWMSI may not accurately reflect the myocardial infarct size as it is affected by several important limitations. First, regional wall motion abnormality in patients with acute myocardial infarction may not completely result from the current ischemia. In other words, previous ischemia or infarction could also decrease RWMSI. On the other hand, a temporarily reduced motion can be seen in hibernating or stunned myocardium following acute myocardial infarction, while these segments are not truly infarcted and would retain their function by time. Moreover, myocardial diseases such as myocarditis or cardiomyopathy could also reduce myocardial motion. Diastolic dysfunction is also able to affect RWMSI. However, we found a close relation between peak CK-MB and RWMSI. Moreover, cTnI level at 72 hours after the onset of symptoms was also positively correlated with RWMSI. In addition, on multiple regression analysis, waist circumference, LDL-cholesterol level and peak CK-MB level were independently correlated with RWMSI. Diastolic dysfunction has been suggested as an important predictor of morbidity and mortality in patients with metabolic syndrome (51). Our investigation demonstrated that the presence and the severity of diastolic dysfunction are significantly higher in patients with metabolic syndrome as compared to control subjects without metabolic syndrome. This finding is consistent with those of prior study by Penjaskovic et al. which demonstrated that metabolic syndrome is associated with the presence of diastolic dysfunction (51). They also have found that the grade of diastolic dysfunction dependents on the number of components of metabolic syndrome. Moreover, Khan et al. showed a positive association between each component of metabolic syndrome and the grade of diastolic dysfunction (52). In the present study, we also assessed the association of CK-MB, cTnI level at 72 hours and RWMSI with left ventricular systolic function. Our results showed that neither CK-MB nor cTnI were significantly correlated with left ventricular ejection fraction in both group of patients with and without metabolic syndrome. Though, considering the borderline p values, this lack-of-association between cardiac biomarkers and left ventricular systolic function might be explained by the relatively small sample size 7 Hajsadeghi S et al. in the current study. Moreover, Pride et al. showed that only in patients with moderate to large infarcts (infarct size of > 15%), left ventricular ejection fraction and infarct size are negatively correlated and every 5% increase in infarct size is associated with 6.1% decrease in LVEF (34). We also found that the association between echocardiographically-derived RWMSI and left ventricular ejection fraction was inconspicuous. However, Lebeau et al. in a study on 122 patients referred for evaluation of heart disease showed that WMSI and LVEF are in good correlation, when assessed by cardiac MRI (53). There are some limitations in this study. Our sample size is relatively small and all participants were recruited from a single center rendering our study to selection bias. Moreover, our results would have higher reliability if we were able to use imaging modalities, which have been proven to estimate infarct size more accurately than cardiac enzymes assays or wall motion score index; such as late gadolinium-enhanced CMR. In conclusion, the results of the present investigation suggest that patients with metabolic syndrome have higher infarct size than control subjects, as assessed by peak CK-MB and cTnI at 72 hours after the onset of symptoms. However, larger studies using more accurate diagnostic modalities for estimation of infarct size are required to confirm these findings. Acknowledgements We gratefully acknowledge the generous assistance provided by the staff of Rajaie Cardiovascular Medical and Research Center throughout this project. 6. 7. 8. 9. 10. 11. 12. 13. 14. 15. 16. 17. Authors’ Contributions Shokoufeh Hajsadeghi has contributed in study concept and design, critical revision and approval of the manuscript. Majid Haghjoo, Nima Babaali, Zahra Norouzzadeh and Maryam Mohsenian have contributed in study concept and design, data collection, critical revision, approval of the manuscript. Mitra Chitsazan and Mandana Chitsazan have contributed in study concept and design, analysis and interpretation, statistics, drafting, critical revision and approval of the manuscript. References 1. 2. 3. 4. 5. 8 Wilson PW, Kannel WB, Silbershatz H, D'Agostino RB. Clustering of metabolic factors and coronary heart disease. Arch Intern Med. 1999;159(10):1104–9. Grundy SM. Hypertriglyceridemia, insulin resistance, and the metabolic syndrome. Am J Cardiol. 1999;83(9b):25f–9f. Yip J, Facchini FS, Reaven GM. Resistance to insulin-mediated glucose disposal as a predictor of cardiovascular disease. J Clin Endocrinol Metab. 1998;83(8):2773–6. Despres JP, Lamarche B, Mauriege P, Cantin B, Dagenais GR, Moorjani S, et al. Hyperinsulinemia as an independent risk factor for ischemic heart disease. N Engl J Med. 1996;334(15):952–7. Executive Summary of The Third Report of The National Cholesterol Education Program (NCEP) Expert Panel on Detection, Evaluation, And Treatment of High Blood Cholesterol In Adults (Adult Treatment Panel III). Jama. 2001;285(19):2486–97. 18. 19. 20. 21. 22. 23. 24. 25. Risk stratification and survival after myocardial infarction. N Engl J Med. 1983;309(6):331–6. Miller TD, Christian TF, Hopfenspirger MR, Hodge DO, Gersh BJ, Gibbons RJ. Infarct size after acute myocardial infarction measured by quantitative tomographic 99mTc sestamibi imaging predicts subsequent mortality. Circulation. 1995;92(3):334–41. Panteghini M, Cuccia C, Bonetti G, Giubbini R, Pagani F, Bonini E. Single-point cardiac troponin T at coronary care unit discharge after myocardial infarction correlates with infarct size and ejection fraction. Clin Chem. 2002;48(9):1432–6. Mair J, Wagner I, Morass B, Fridrich L, Lechleitner P, Dienstl F, et al. Cardiac troponin I release correlates with myocardial infarction size. Eur J Clin Chem Clin Biochem. 1995;33(11):869–72. Ingkanisorn WP, Rhoads KL, Aletras AH, Kellman P, Arai AE. Gadolinium delayed enhancement cardiovascular magnetic resonance correlates with clinical measures of myocardial infarction. J Am Coll Cardiol. 2004;43(12):2253–9. Thygesen K, Alpert JS, White HD, Joint EAFFTROMI. Universal definition of myocardial infarction. Eur Heart J. 2007;28(20):2525–38. Friedewald WT, Levy RI, Fredrickson DS. Estimation of the concentration of low-density lipoprotein cholesterol in plasma, without use of the preparative ultracentrifuge. Clin Chem. 1972;18(6):499–502. Lang RM, Bierig M, Devereux RB, Flachskampf FA, Foster E, Pellikka PA, et al. Recommendations for chamber quantification. Eur J Echocardiogr. 2006;7(2):79–108. Olijhoek JK, van der Graaf Y, Banga JD, Algra A, Rabelink TJ, Visseren FL, et al. The metabolic syndrome is associated with advanced vascular damage in patients with coronary heart disease, stroke, peripheral arterial disease or abdominal aortic aneurysm. Eur Heart J. 2004;25(4):342–8. Solymoss BC, Bourassa MG, Campeau L, Sniderman A, Marcil M, Lesperance J, et al. Effect of increasing metabolic syndrome score on atherosclerotic risk profile and coronary artery disease angiographic severity. Am J Cardiol. 2004;93(2):159–64. Turhan H, Erbay AR, Yasar AS, Bicer A, Sasmaz H, Yetkin E. Impaired coronary blood flow in patients with metabolic syndrome: documented by Thrombolysis in Myocardial Infarction (TIMI) frame count method. Am Heart J. 2004;148(5):789–94. Zeller M, Steg PG, Ravisy J, Laurent Y, Janin-Manificat L, L'Huillier I, et al. Prevalence and impact of metabolic syndrome on hospital outcomes in acute myocardial infarction. Arch Intern Med. 2005;165(10):1192–8. Isomaa B, Almgren P, Tuomi T, Forsen B, Lahti K, Nissen M, et al. Cardiovascular morbidity and mortality associated with the metabolic syndrome. Diabetes Care. 2001;24(4):683–9. Logstrup BB, Hofsten DE, Christophersen TB, Moller JE, Botker HE, Pellikka PA, et al. Influence of abnormal glucose metabolism on coronary microvascular function after a recent myocardial infarction. JACC Cardiovasc Imaging. 2009;2(10):1159–66. Fujimoto K, Hozumi T, Watanabe H, Tokai K, Shimada K, Yoshiyama M, et al. Acute hyperglycemia induced by oral glucose loading suppresses coronary microcirculation on transthoracic Doppler echocardiography in healthy young adults. Echocardiography. 2006;23(10):829–34. Gresele P, Guglielmini G, De Angelis M, Ciferri S, Ciofetta M, Falcinelli E, et al. Acute, short-term hyperglycemia enhances shear stress-induced platelet activation in patients with type II diabetes mellitus. J Am Coll Cardiol. 2003;41(6):1013–20. Marfella R, Siniscalchi M, Esposito K, Sellitto A, De Fanis U, Romano C, et al. Effects of stress hyperglycemia on acute myocardial infarction: role of inflammatory immune process in functional cardiac outcome. Diabetes Care. 2003;26(11):3129–35. Khot UN, Jia G, Moliterno DJ, Lincoff AM, Khot MB, Harrington RA, et al. Prognostic importance of physical examination for heart failure in non-ST-elevation acute coronary syndromes: the enduring value of Killip classification. JAMA. 2003;290(16):2174–81. Wu AH, Parsons L, Every NR, Bates ER. Hospital outcomes in patients presenting with congestive heart failure complicating acute myocardial infarction: a report from the Second National Registry of Myocardial Infarction (NRMI-2). J Am Coll Cardiol. 2002;40(8):1389–94. Steg PG, Dabbous OH, Feldman LJ, Cohen-Solal A, Aumont MC, Lo- Res Cardiovasc Med. 2015;4(1):e25018 Hajsadeghi S et al. 26. 27. 28. 29. 30. 31. 32. 33. 34. 35. 36. 37. 38. 39. pez-Sendon J, et al. Determinants and prognostic impact of heart failure complicating acute coronary syndromes: observations from the Global Registry of Acute Coronary Events (GRACE). Circulation. 2004;109(4):494–9. Aronson D, Rayfield EJ, Chesebro JH. Mechanisms determining course and outcome of diabetic patients who have had acute myocardial infarction. Ann Intern Med. 1997;126(4):296–306. Gibbons RJ, Valeti US, Araoz PA, Jaffe AS. The quantification of infarct size. J Am Coll Cardiol. 2004;44(8):1533–42. Kim RJ, Fieno DS, Parrish TB, Harris K, Chen EL, Simonetti O, et al. Relationship of MRI delayed contrast enhancement to irreversible injury, infarct age, and contractile function. Circulation. 1999;100(19):1992–2002. Jernberg T, James S, Lindahl B, Stridsberg M, Venge P, Wallentin L. NT-proBNP in unstable coronary artery disease--experiences from the FAST, GUSTO IV and FRISC II trials. Eur J Heart Fail. 2004;6(3):319–25. Galvani M, Ottani F, Oltrona L, Ardissino D, Gensini GF, Maggioni AP, et al. N-terminal pro-brain natriuretic peptide on admission has prognostic value across the whole spectrum of acute coronary syndromes. Circulation. 2004;110(2):128–34. Morrow DA, de Lemos JA, Sabatine MS, Murphy SA, Demopoulos LA, DiBattiste PM, et al. Evaluation of B-type natriuretic peptide for risk assessment in unstable angina/non-ST-elevation myocardial infarction: B-type natriuretic peptide and prognosis in TACTICS-TIMI 18. J Am Coll Cardiol. 2003;41(8):1264–72. Al Saady NM, Camm AJ. New soluble markers for assessment of infarct size. In: Kaski JC, Holt DW editors. Myocardial damage. Early detection by novel biochemical markers.. Dordrecht, The Netherlands: Kluwer Academic Publishers; 1998. pp. 137–48. Grande P, Christiansen C, Alstrup K. Comparison of ASAT, CK, CKMB, and LD for the estimation of acute myocardial infarct size in man. Clin Chim Acta. 1983;128(2-3):329–35. Pride YB, Giuseffi JL, Mohanavelu S, Harrigan CJ, Manning WJ, Gibson CM, et al. Relation between infarct size in ST-segment elevation myocardial infarction treated successfully by percutaneous coronary intervention and left ventricular ejection fraction three months after the infarct. Am J Cardiol. 2010;106(5):635–40. Katus HA, Remppis A, Scheffold T, Diederich KW, Kuebler W. Intracellular compartmentation of cardiac troponin T and its release kinetics in patients with reperfused and nonreperfused myocardial infarction. Am J Cardiol. 1991;67(16):1360–7. Remppis A, Ehlermann P, Giannitsis E, Greten T, Most P, MullerBardorff M, et al. Cardiac troponin T levels at 96 hours reflect myocardial infarct size: a pathoanatomical study. Cardiology. 2000;93(4):249–53. Gallegos RP, Swingen C, Xu XJ, Wang X, Bianco R, Jerosch-Herold M, et al. Infarct extent by MRI correlates with peak serum troponin level in the canine model. J Surg Res. 2004;120(2):266–71. Licka M, Zimmermann R, Zehelein J, Dengler TJ, Katus HA, Kubler W. Troponin T concentrations 72 hours after myocardial infarction as a serological estimate of infarct size. Heart. 2002;87(6):520–4. Steen H, Futterer S, Merten C, Junger C, Katus HA, Giannitsis E. Relative role of NT-pro BNP and cardiac troponin T at 96 Res Cardiovasc Med. 2015;4(1):e25018 40. 41. 42. 43. 44. 45. 46. 47. 48. 49. 50. 51. 52. 53. hours for estimation of infarct size and left ventricular function after acute myocardial infarction. J Cardiovasc Magn Reson. 2007;9(5):749–58. Steen H, Giannitsis E, Futterer S, Merten C, Juenger C, Katus HA. Cardiac troponin T at 96 hours after acute myocardial infarction correlates with infarct size and cardiac function. J Am Coll Cardiol. 2006;48(11):2192–4. Grande P, Christiansen C, Hansen BF. Myocardial infarct size and cardiogenic shock. Eur Heart J. 1983;4(5):289–94. Christenson RH, Vollmer RT, Ohman EM, Peck S, Thompson TD, Duh SH, et al. Relation of temporal creatine kinase-MB release and outcome after thrombolytic therapy for acute myocardial infarction. TAMI Study Group. Am J Cardiol. 2000;85(5):543–7. Turer AT, Mahaffey KW, Gallup D, Weaver WD, Christenson RH, Every NR, et al. Enzyme estimates of infarct size correlate with functional and clinical outcomes in the setting of ST-segment elevation myocardial infarction. Curr Control Trials Cardiovasc Med. 2005;6:12. Nienhuis MB, Ottervanger JP, de Boer MJ, Dambrink JH, Hoorntje JC, Gosselink AT, et al. Prognostic importance of creatine kinase and creatine kinase-MB after primary percutaneous coronary intervention for ST-elevation myocardial infarction. Am Heart J. 2008;155(4):673–9. Grande P, Christiansen C, Pedersen A. Influence of acute myocardial infarct size on acute and one-year mortality. Eur Heart J. 1983;4(1):20–5. Grande P, Nielsen A, Wagner GS, Christiansen C. Quantitative influence of serum creatine kinase isoenzyme MB estimated infarct size and other prognostic variables on one year mortality after acute myocardial infarction. Br Heart J. 1985;53(1):9–15. Halkin A, Stone GW, Grines CL, Cox DA, Rutherford BD, Esente P, et al. Prognostic implications of creatine kinase elevation after primary percutaneous coronary intervention for acute myocardial infarction. J Am Coll Cardiol. 2006;47(5):951–61. Clavijo LC, Pinto TL, Kuchulakanti PK, Torguson R, Chu WW, Satler LF, et al. Metabolic syndrome in patients with acute myocardial infarction is associated with increased infarct size and in-hospital complications. Cardiovasc Revasc Med. 2006;7(1):7–11. Kranjcec D, Altabas V. Metabolic syndrome influencing infarct size and heart failure in patients with acute coronary syndrome: does gender matter? Endocr J. 2012;59(12):1065–76. Bohmer E, Seljeflot I, Arnesen H, Hoffmann P, Abdelnoor M, Halvorsen S. The association between metabolic syndrome and infarct size in patients with acute myocardial infarction. Scand J Clin Lab Invest. 2010;70(4):287–93. Penjaskovic D, Sakac D, Dejanovic J, Zec R, Zec Petkovic N, Stojsic Milosavljevic A. Left ventricular diastolic dysfunction in patients with metabolic syndrome. Med Pregl. 2012;65(1-2):18–22. Khan AR, Khan MQ. Association and pattern of diastolic dysfunction in patients of metabolic syndrome. J Ayub Med Coll Abbottabad. 2008;20(2):70–5. Lebeau R, Serri K, Morice MC, Hovasse T, Unterseeh T, Piechaud JF, et al. Assessment of left ventricular ejection fraction using the wall motion score index in cardiac magnetic resonance imaging. Arch Cardiovasc Dis. 2012;105(2):91–8. 9


© Copyright 2026