
Dust count mode of LIDAR onboard Hayabusa
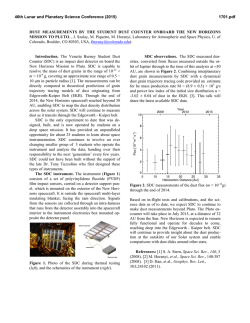
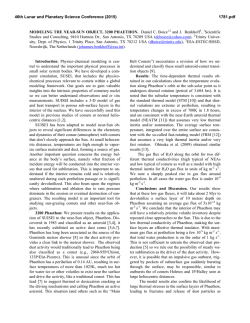
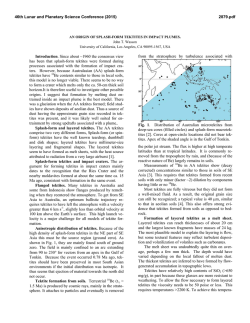
46th Lunar and Planetary Science Conference (2015)
1863.pdf
Dust count mode of LIDAR onboard Hayabusa-2. H. Senshu1, S. Oshigami2, R. Yamada2, M. Kobayashi1, N.
Namiki2, T. Mizuno3, and Hayabusa-2 LIDAR science team, 1Planetary Exploration Research Center, Chiba Institute of Technology ([email protected]), 2RISE Project Office, National Astronomical Observatory of Japan,
3
Institute of Space and Astronautical Science, Japan Aerospace Exploration Agency.
Introduction:
LIDAR (LIght Detection And
Ranging) is one of the satellite buses onboard Hayabusa-2. Basically LIDAR is used to measure the distance between the satellite and the target asteroid,
1999JU3. The distance is important information to control the satellite in descending operation such as closeup observation from low altitude and separation of
rover, lander, and small carry on impactor. Especially
an accurate measurement of the distance is required
during touch-down and sampling operations. Thus
LIDAR onboard Hayabusa-2 (hereafter we simply represent this instrument as “the LIDAR”) is required to
measure about 4 orders of magnitude variety of distance, from 30m to 25km. To satisfy this requirement,
the LIDAR has two types of receiver optics, one is for
near range (nearer than 1km) and another is for far
range (farer than 1km) [1,2].
The distance from the target asteroid, 1999JU3, is
one of the fundamental information for operational and
scientific observations. For example, the gravitational
acceleration is calculated from the change rate of the
distance from the target asteroid during free fall operation. Construction of a shape model requires a characteristic length scale in camera image. And also, the
measurement of the absolute reflectance from camera
image and/or spectrometer data requires an absolute
distance from the target [1,2].
The LIDAR can measure absolute reflectance at the
wavelength of 1064nm by itself since the LIDAR
monitors the energies of the laser pulse and receiving
signal. The accuracy of determining the reflectance is
so far estimated no better than 25%, but it would become better through further calibration tests using a
pre-flight model of the LIDAR [1].
Dust count mode is one of the operational modes of
the LIDAR in which the LIDAR detects faint scattered
light from dust grains on the line of sight. The distribution of dust grains along the line of sight is estimated
from the profile of received light and the effective reflectance of dust cloud. In this presentation we will
introduce the function of this mode.
Dust count mode: LIDAR is a common instrument in the field of terrestrial atmosphere observation.
In this case the energy profile of received light is recorded and by comparison with transmitting laser energy and predicted reflectance of an aerosol the energy
profile is transferred to the density distribution of aerosols along the line of sight. On the contrary, in the case
of deep space mission, we cannot take the same method
with terrestrial atmosphere observation. The profile of
received light makes a large data but there is a limitation on the amount of data traffic between the satellite
and the Earth.
To suppress the data size an observational range is
divided into 50 bins and the received energy at each
bin is compared with a threshold value. Then we obtain
only 50 bits of data for each shot. The minimum length,
or duration, of a bin is limited from the response time
of the circuit. On the other hand if we set the length of
each bins too short, the range of observations became
too narrow. We set the duration of each bins to 133.3ns
which corresponds to the special resolution of 20m,
resulting the total range of observation being 1km (see
Fig. 1).
The position of an observational range can be
changed by delaying the start of observation relative to
laser shot. The delay time is set by command from 0 to
126.7us in units of 3.33us which corresponds that the
start point of observational range changes from the
vicinity of the satellite to 19km far away from the satellite in units of 0.5km. Thus we can search a sign of dust
around the target asteroid even from an altitude of
20km (see Fig. 1). However, it is to be noted that the
farther the observational range is set, the fainter the
signal from dust grains becomes because of geometric
attenuation [2]. So we will try to detect dust grains
from as low altitude as possible.
Fig. 1: Schematic view of dust count mode. Thick
curve in the bottom figure represents hypothetical
profile of received light. Black-and-white line at
the bottom represent an output of dust count
mode observation (white=0, black=1).
46th Lunar and Planetary Science Conference (2015)
Fig. 2: Schematic view of the results of dust
count mode observation with various threshold
level (cyan, orange, red, purple and black). Thin
curve is an estimated profile of received light.
In dust count mode the receiver optics for far range
is used. The light energy received by far range optics at
an altitude of 1km is estimated about 3 orders magnitude or larger than a nominal noise level. In other
words the LIDAR can detect a signal from dust grains
even if it is fainter than the scattered light from the
surface of the target asteroid by 3 orders of magnitude
[2]. True noise level is to be confirmed in space and
expected to be lower than the nominal value.
One-time observation described above gives us only 50 bits data. So the energy profile of received light
cannot be obtained from single shot. To estimate the
energy profile of received light multiple shots by
changing the threshold is required (see Fig. 2). The
LIDAR provides 64 sets of threshold value, from a
larger value to be used in normal ranging mode to a
much smaller value than the nominal noise level. So we
can estimate the energy profile of received light by
changing the threshold properly.
Function test of dust count mode: Performance
of dust count mode was checked by two types of function tests. One is electric test and another is optic test.
In the electric test a single electrical pulse is applied directory to the circuit behind the optics to check
whether or not the pulse is detected in proper bin. The
electric tests were taken place for various bins with
Fig.3: A part of output obtained in function test of
dust count mode. The output of 50bins for a shot is
listed in one line and the series of results are shown
line by line. An output of 1 (over the threshold) is
represented by hatched pink.
In this part of test, the location (timing) of signals
are moved far (later) by 500m.
1863.pdf
Fig. 4: An example of a series of outputs obtained in function test of dust count mode for
various thresholds (red, orange, blue, purple and
black). The range (timing) of an output of 1
(above the threshold) is indicated by thick line.
Thin black curve represented an estimated profile
of input and hatched histogram represents true
input profile.
various delay time, and showed that the circuit behind
the optics works properly in dust count mode, at least
for a single pulse.
Fig. 3 and 4 show the results from the optic test in
which light with a known profile was conducted into
the optics to check the timing and the effect of the
change of threshold value. These results are almost
satisfiable, but additional test by using pre-flight model
is needed.
Summary: Dust count mode is one of the operational modes of LIDAR onboard Hayabusa-2 in which
the LIDAR detects faint scattered light from dust
around the target asteroid. Its function was tested both
electrically and optically, and it seemed working
properly.
Acknowledgement: We would like to sincerely
thank T. Kase (NEC Corporation) for his assistance in
developing and testing the dust count mode of the
LIDAR.
References: [1] Namiki et al. (2014) 45th LPSC,
Abstract #1922. [2] Namiki et al. (2015) 46th LPSC,
Abstract. [3] Oshigami et al. (2015) 46th LPSC, Abstract.


© Copyright 2026