
Resolved gas cavities in transitional disks inferred from CO
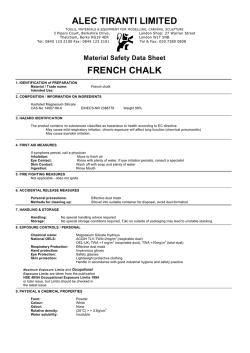
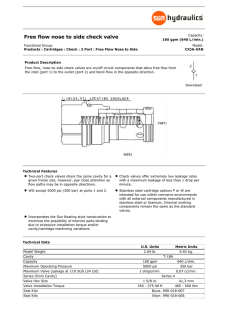
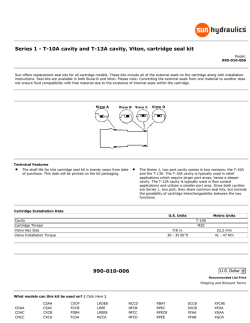
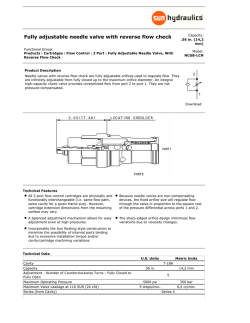
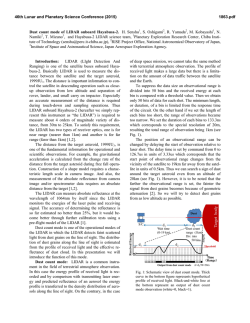
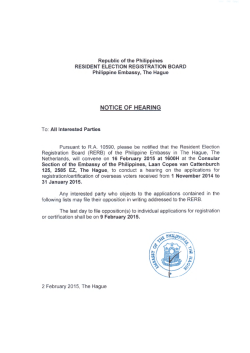
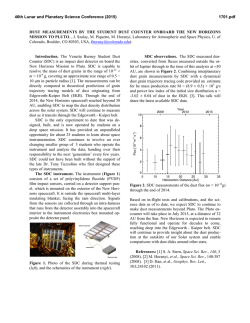
c ESO 2015 Astronomy & Astrophysics manuscript no. Paper˙acc November 24, 2015 Resolved gas cavities in transitional disks inferred from CO isotopologues with ALMA N. van der Marel1 , E.F. van Dishoeck1,2 , S. Bruderer2 , S.M. Andrews3 , K.M. Pontoppidan4 , G.J. Herczeg5 , T. van Kempen1 , and A. Miotello1 1 arXiv:1511.07149v1 [astro-ph.EP] 23 Nov 2015 2 3 4 5 Leiden Observatory, Leiden University, P.O. Box 9513, 2300 RA Leiden, the Netherlands Max-Planck-Institut für Extraterrestrische Physik, Giessenbachstrasse 1, 85748 Garching, Germany Harvard-Smithsonian Center for Astrophysics, 60 Garden Street, Cambridge, MA 02138, USA Space Telescope Science Institute, 3700 San Martin Drive, Baltimore, MD 21218, USA Kavli Institute for Astronomy and Astrophysics, Peking University, Yi He Yuan Lu 5, Haidijan district, Beijing 100871, China accepted by A&A ABSTRACT Context. Transitional disks around young stars are promising candidates to look for recently formed, embedded planets. Planet-disk interaction models predict that planets clear a gap in the gas while trapping dust at larger radii. Other physical mechanisms could be responsible for cavities as well. Previous observations have revealed that gas is still present inside these cavities, but the spatial distribution of this gas remains uncertain. Aims. We present high spatial resolution observations with the Atacama Large Millimeter/submillimeter Array (ALMA) of 13 CO and C18 O lines of four well-studied transitional disks. The observations are used to set constraints on the gas surface density, specifically cavity size and density drop inside the cavity. Methods. The physical-chemical model DALI is used to analyze the gas images of SR 21, HD 135344B, DoAr 44 and IRS 48. The main parameters of interest are the size, depth and shape of the gas cavity. CO isotope-selective photodissociation is included to properly constrain the surface density in the outer disk from C18 O emission. Results. The gas cavities are up to 3 times smaller than those of the dust in all four disks. Model fits indicate that the surface density inside the gas cavities decreases by a factor of 100-10000 compared with the surface density profile derived from the outer disk. A comparison with an analytical model of gap depths by planet-disk interaction shows that the disk viscosities are likely low, with α ∼ 10−3 − −10−4 for reasonable estimates of planet masses of <10 MJup . Conclusions. The resolved measurements of the gas and dust in transition disk cavities support the predictions of models that describe how planet-disk interactions sculpt gas disk structures and influence the evolution of dust grains. These observed structures strongly suggest the presence of giant planetary companions in transition disk cavities, although at smaller orbital radii than is typically indicated from the dust cavity radii alone. Key words. Astrochemistry - Protoplanetary disks - Stars: formation - ISM: molecules 1. Introduction Protoplanetary disks around young stars are the birth cradles of planets (e.g. Williams & Cieza 2011). Disks with inner dust cavities, also called transition disks, are good candidates to search for young planets that have recently been formed and cleared out their orbit. Dust cavities have been inferred from modeling of Spectral Energy Distributions (SEDs) (Espaillat et al. 2014, and references therein) and millimeter interferometry (e.g. Brown et al. 2009; Andrews et al. 2011). Planet candidates have been found in cavities of several transition disks (Kraus & Ireland 2012; Quanz et al. 2013, 2015). However, planet-disk interaction models indicate that dust cavities are only an indirect consequence of planet clearing: a planet will lower the gas surface density along its orbit, creating a gas gap with a pressure bump at its outer edge where the millimeter-sized dust gets trapped (e.g. Zhu et al. 2011; Dodson-Robinson & Salyk 2011; Pinilla et al. 2012). The result is a millimeter-dust ring (or in particular cases an azimuthal asymmetry, due to a Rossbywave instability of the pressure bump, van der Marel et al. 2013; Fukagawa et al. 2013; Casassus et al. 2013) and a gas cavity that can be up to two times smaller than the radius of the dust ring. Other mechanisms that could cause a dust cavity or dust ring are photoevaporation (Clarke et al. 2001) and instabilities at the edges of dead zones (e.g. Regály et al. 2012). Measuring the gas density inside the cavity is essential to distinguish between these mechanisms: photoevaporation clears the dust and gas from the inside out; dead zones do not change the gas density inside the cavity; planetary clearing creates a gas cavity. Furthermore, the decrease of gas surface density inside the gas cavity radius depends on the mass of the companion and the disk viscosity. More generally, the fundamental properties of a disk are the gas-todust ratio and gas surface density profile, as the gas does not necessarily follow the dust distribution. The presence of gas inside the dust cavities was discovered through accretion (e.g. Valenti et al. 1993; Najita et al. 2007) and H2 emission (Bergin et al. 2003; Ingleby et al. 2009). Other first indicators of warm molecular gas inside the cavities were near infrared observations of CO rovibrational lines, in several cases revealing a gas cavity that was indeed smaller than the dust cavity (Pontoppidan et al. 2008; Brittain et al. 2009; Salyk et al. 2009; Brown et al. 2012). Due to a combination of high critical densities and non-LTE excitation, rovibrational CO data can be 1 N. van der Marel et al.: Gas cavities in transitional disks difficult to interpret and derived gas masses are highly modeldependent. For a proper derivation of the molecular gas densities, CO pure rotational line observations are required. For a handful of disks, pioneering interferometers such as SMA and PdBI already revealed gas inside the cavity through CO rotational lines: AB Aur (Piétu et al. 2005), GM Aur (Dutrey et al. 2008) and HD 135344B (Lyo et al. 2011). Spatially resolved ALMA observations of 12 CO emission confirm the presence of gas inside the dust cavity for several other disks (van der Marel et al. 2013; Casassus et al. 2013; Pérez et al. 2014; Zhang et al. 2014; Canovas et al. 2015). Using a disk model based on the dust structure derived from the SED and millimeter imaging, the 12 CO data suggest a gas density decrease of 1 or 2 orders of magnitude inside the dust cavity compared to the density profile of the outer disk (van der Marel et al. 2015b). On the other hand, the dust density decreased by at least 3 orders of magnitude inside the cavity. In cases of IRS 48 and J1604-2130, the gas cavities are sufficiently empty so that 12 CO becomes optically thin inside the dust cavity, and it was found that the gas cavity radius is indeed smaller than the dust cavity (Bruderer et al. 2014; Zhang et al. 2014; van der Marel et al. 2015b), consistent with the planet-disk interaction predictions. The same result was found for HD 142527 using CO isotopologue observations (Perez et al. 2015). Since detection of planets in disks is challenging, quantifying the gas density structure of the disk inside the cavity can provide important clues on the properties of embedded unseen planets. The depth and shape of the gap depend primarily on the planet mass and the disk viscosity (Zhu et al. 2011; Pinilla et al. 2012; Fung et al. 2014). These models show that a planet does not create a steep gas gap, but a gradual decrease over several AUs. While spatially resolved 12 CO can provide some information on the gas density profile, the emission remains optically thick throughout most of the disk and is thus not a very good absolute density tracer. Spatially resolved CO isotopologue observations are required to constrain the outer disk mass and the gas cavity radius, as well as the depth and potentially the shape of the gas surface density profile. Converting CO emission into density is also not trivial: the CO abundance with respect to H2 is not constant throughout the disk due to photodissociation by the stellar UV radiation and freeze out onto dust grains in the cold regions in the midplane and outer disk (van Zadelhoff et al. 2001; Aikawa et al. 2002). CO photodissociation is subject to self-shielding. As CO isotopologues have lower abundances, they are not selfshielded until deeper into a cloud or disk (Bally & Langer 1982; van Dishoeck & Black 1988; Visser et al. 2009). Therefore, disk models that do not include isotope-selective photodissociation predict higher CO abundances than when this effect is included, as recently demonstrated by Miotello et al. (2014). Also, the gas temperature is decoupled from the dust temperature in the upper layers in the disk and at the directly heated cavity wall (e.g. Kamp & Dullemond 2004; Jonkheid et al. 2004; Gorti & Hollenbach 2008). For a proper interpretation of CO emission, the physical and chemical structure of gas and dust needs to be modeled. We make use of physical-chemical modeling with DALI (Bruderer et al. 2012; Bruderer 2013), which simultaneously solves the heating-cooling balance of the gas and chemistry to determine the gas temperature, molecular abundances and molecular excitation for a given density structure. In this paper, we present ALMA Cycle 1 and 2 observations of CO isotopologues 13 CO and C18 O at ∼ 0.2 − 0.25′′ resolution of 4 additional well-studied transitional disks: SR 21, 2 HD135344B, DoAr44 and IRS 48. For IRS 48, the 6–5 transitions are observed, for the other disks the lower 3–2 transitions. Previously derived models from 12 CO ALMA observations (Bruderer et al. 2014; van der Marel et al. 2015b) of IRS 48, SR 21 and HD135344B will be used as a starting point for analysis of the isotopologues. With DALI we determine a gas density structure that is consistent with the CO observations, SED and continuum dust interferometry. Information on the hot gas and dust from the literature is included. The goals of this study are to determine the gas surface density profile, specificially the size, depth and shape of the gas density structure inside the dust cavity in order to constrain the properties of potential embedded planets. The paper is structured as follows. In Section 2.1 we describe the details of the ALMA observations. In Section 2.2 we present moment maps of the 13 CO and 18 CO observations. The modeling approach is presented in Section 3. Section 4 presents the modeling results. Section 5 discusses the implications for embedded planets in the disk. 2. Data The observations were obtained during ALMA Cycle 1 and 2 in June and July 2014, with baselines ranging from 20 to 1100 m, probing scales from 0.15 to 8 arcseconds. The sources and their properties are summarized in Table 2. 2.1. Observational details The disks SR 21, HD 135344B and DoAr 44 were observed in ALMA Cycle 1 program 2012.1.00158.S (PI van Dishoeck) in Band 7 (∼335 GHz or 896 µm) with a resulting spatial resolution of 0.2–0.25”. The observations were taken in four spectral windows of 3840 channels: three windows have a bandwidth of 469 MHz (channel width 122 kHz, equivalent to 0.1 km s−1 ), centered on the 13 CO 3–2, C18 O 3–2 and CN 3–2 transitions with rest frequencies of 330.58796, 329.33056 and 340.24778 GHz, respectively. The fourth spectral window was centered on 342.15000 GHz with a bandwidth of 1875 MHz (channel width 488 kHz, equivalent to 0.5 km s−1 ) aimed at higher continuum sensitivity. The total continuum bandwidth was ∼3.2 GHz. For HD135344B, the flux was calibrated using Ceres, and J14274206 was used for calibration of both bandpass and gain. SR 21 and DoAr 44 were observed in one scheduling block, with Titan as flux calibrator, J1517-2422 as bandpass calibrator and J16252527 as gain calibrator. In both objects, the flux calibrator (Ceres resp. Titan) is highly resolved on long baselines. The gain calibration on the flux calibrator was thus performed using a subset of the antennas. The total on-source integration time was 30 minutes each for SR 21 and DoAr 44, and 54 minutes for HD 135344B. IRS 48 was observed in ALMA Cycle 2 program 2013.1.00100.S (PI van der Marel) in Band 9 (∼680 GHz or 440 µm) with a resulting spatial resolution of 0.15–0.2”. The observations were taken in four spectral windows of 1920 channels: three windows with a bandwidth of 937.5 MHz (channel width 488 kHz or 0.3 km s−1 ), centered on the 13 CO 6–5, C18 O 6–5 and H2 CO 9–8 transitions with rest frequencies of 661.067276, 658.553278 and 674.80978 GHz, respectively. The fourth spectral window was centered on 672 GHz with a bandwidth of 1875 MHz (channel width 977 kHz or 0.5 km s−1 ) aimed at higher continuum sensitivity. The total continuum bandwidth was ∼4.7 GHz. The flux was calibrated using J1517-243, the bandpass with J1427-4206 and the gain with J1626-2951. J1700-2610 was N. van der Marel et al.: Gas cavities in transitional disks Fig. 1. ALMA observations of the continuum, 13 CO and C18 O 3-2 lines of the first three targets. Top left: zero-moment 13 CO map. Top middle: Continuum map; Top right: 13 CO spectrum integrated over the entire disk; Bottom left: zero-moment C18 O map; Bottom middle: first moment 13 CO map (velocity map); Bottom right: C18 O spectrum integrated over the entire disk. The beam is indicated in each map by a white ellipse in the lower left corner. The dotted white ellipse indicates the dust cavity radius. set as secondary gain calibrator, but not used in the final calibration. The total on-source integration time was 52 minutes. The data were calibrated and imaged in CASA version 4.2.1. Given the high signal-to-noise ratio of these observations am- 3 N. van der Marel et al.: Gas cavities in transitional disks Fig. 2. ALMA observations of the continuum, the 13 CO and C18 O 6-5 lines of the fourth target. Top left: zero-moment 13 CO map. Top middle: Continuum map; Top right: 13 CO spectrum integrated over the entire disk; Bottom left: zero-moment C18 O map; Bottom middle: first moment 13 CO map (velocity map); Bottom right: C18 O spectrum integrated over the entire disk. The beam is indicated in each map by a white ellipse in the lower left corner. The dotted white ellipse indicates the dust cavity radius. Table 1. Stellar properties Target SpT L∗ M∗ R∗ T eff Ṁ d AV Ref. (L⊙ ) (M⊙ ) (R⊙ ) (K) (M⊙ yr−1 ) (pc) (mag) HD135344B F4 7.8 1.6 2.2 6590 6 · 10−9 140 0.3 1,2,3 SR21 G3 10 1.0 3.2 5830 < 1 · 10−9 120 6.3 4,5,6 DoAr44 K3 1.4 1.3 1.75 4730 9 · 10−9 120 2.2 5,6 IRS48 A0 14.3 2.0 1.3 10000 4 · 10−9 120 11.5 7,8 1) Prato et al. (2003), 2) Andrews et al. (2011), 3) Espaillat et al. (2010), 4) Dunkin et al. (1997), 5) Pontoppidan et al. (2008), 6) Grady et al. (2009), 7) Brown et al. (2012), 8) Salyk et al. (2013) Table 2. Properties of the ALMA observations Target HD135344B SR21 DoAr44 IRS48 Notes. (a) Derived position (J2000) 15:15:48.42 -37:09:16.36 16:27:10.27 -24:19:13.04 16:31:33.46 -24:27:37.53 16:27:37.18 -24:30:35.39 Beam size (”) 0.26×0.21 0.25×0.19 0.25×0.19 0.19×0.15 Beam PA (◦ ) 46 -65 -65 87 rmsC18O a (mJy beam−1 ) 14 8.9 8.9 25 rmscont (mJy beam−1 ) 0.26 0.12 0.14 0.59 PA (◦ ) 63 14 30 100 ib (◦ ) 16 16 20 50 3LSR (km/s) 7.25 3.0 4.35 4.55 Measured in 0.5 km s−1 bins (b) Derived from the 13 CO channel maps. plitude and phase self-calibration was performed after standard phase referencing. The data were cleaned using Briggs weighting with a robust factor of 0.5, resulting in a beam size of ∼ 0.25” × 0.20” (Cycle 1 data) and ∼ 0.19” × 0.15” (Cycle 2 data). Table 2 lists the observational properties of the continuum and spectral line maps of the imaging results. 2.2. Continuum and line maps Figures 1 and 2 show the zero-moment 13 CO and C18 O maps and spectra, the velocity map (first moment) of the 13 CO and the continuum. The spectrum was extracted from the region of the zero-moment map size. Channel maps of the 13 CO emission are given in the Appendix. Three of the four sources, HD135344B, DoAr44 and IRS48, show a clear hole in the 13 CO and C18 O images (Figure 1 and 2), that was not seen 4 rms13CO a (mJy beam−1 ) 9.8 6.4 6.8 23 in 12 CO (van der Marel et al. 2015b). IRS48 shows a full gas ring in 13 CO, which does not suffer from foreground absorption found in the 12 CO (Bruderer et al. 2014). On the other hand, the foreground absorption seen in the 12 CO emission of SR 21 (van der Marel et al. 2015b) also affects the 13 CO spectra. All CO data reveal rotating gas disks with inclination >15◦ , with a double-peaked velocity profile. The gas rings for HD135344B, DoAr44 and IRS 48 are in all cases smaller than the continuum cavities, as shown directly in the 13 CO panels in Figure 1 and 2 and in the radial cuts in Figure 3. The emission inside the gas cavities is at least a factor of 2 lower than in the surrounding rings. In contrast, SR 21 does not appear to have a cavity in the gas at this spatial resolution. The peak S/N in the integrated maps is 12-30 for the 13 CO and 5-20 for C18 O. The 13 CO channel maps and velocity maps are used to derive the stellar position, the position angle, inclination and source ve- N. van der Marel et al.: Gas cavities in transitional disks locity, which are within errors consistent with the values derived from the 12 CO data (van der Marel et al. 2015b). The derived parameters are given in Table 2. The continuum images show ring-like structures for SR21, HD135344B and DoAr44, and a highly asymmetric structure for IRS 48, as seen in previous Cycle 0 data (van der Marel et al. 2013). The S/N on the continuum ranges between 130 and 500 for the different disks. The Band 7 continuum data of SR21 and HD135344B show minor azimuthal asymmetries with a contrast of less than a factor 2, similar to the Band 9 continuum (Pérez et al. 2014; van der Marel et al. 2015b), although the asymmetry in SR21 appears to be less pronounced in Band 7 than in Band 9. The Band 9 and Band 7 continuum images are compared and analyzed in Pinilla et al. (2015). The continuum emission in IRS 48 is discussed in van der Marel et al. (2015a). Fig. 3. Normalized intensity cuts through the major axis of each disk of the 13 CO 3-2 emission (red) and the dust continuum emission (blue). In case of IRS48, the deprojected intensity cut of the minor axis is taken, to cover the (asymmetric) continuum profile. The cuts clearly reveal that the gas cavity radii are smaller than the dust cavity radii. 3. Modeling 3.1. Physical model As a starting point for our models we adopt the physical structure suggested by Andrews et al. (2011), as implemented by Bruderer (2013) and fully described in van der Marel et al. (2015b). The surface density Σ(r) is assumed to be a radial power-law with an exponential cut-off following the timedependent viscosity disk model ν ∼ rγ with γ = 1 (Lynden-Bell & Pringle 1974; Hartmann et al. 1998) !−γ ! r 2−γ r Σ(r) = Σc exp − (1) rc rc The gas and dust follow the same density profile, but the gasto-dust ratio is varied throughout the disk, as shown in Figure 4. Inside the cavity, the dust density is zero, apart from the inner disk, which is set by δdust . The gas density inside the cavity is varied with drops δgas . In the outer disk, the gas-to-dust ratio is fit by a constant number. The vertical structure is defined by the scale height hc and the flaring angle ψ, following h(r) = hc (r/rc )ψ . The fraction of large grains fls and the scale height of the large grains χ are used to describe the settling. More details on the star, the adopted stellar UV radiation, the dust composition and vertical structure are described in van der Marel et al. (2015b). 3.2. Model fitting approach The best fit models from Table 4 in van der Marel et al. (2015b) are used as initial model for the vertical structure and dust density structure for SR21 and HD135344B, based on a combination of SED, dust 690 GHz continuum visibility and 12 CO 6–5 modeling. These models were fit by eye, starting from a surface density and cavity size consistent with the millimeter visibility curve, followed by small adjustments on the inner disk parameter (δdust ) and vertical structure to fit the SED. For the fit to the 12 CO data, the gas surface density was taken initially assuming a gas-to-dust ratio of 100, and the amount of gas inside the cavity was subsequently constrained by varying the δgas parameter, where Σgas = δgas Σgas for r < rcav . The dust density inside the cavity (between rgap and rcavdust ) is set to be entirely empty of dust grains. SR21 is an exception: a small amount of dust is included between 7 and 25 AU, following van der Marel et al. (2015b). The dust structure of DoAr44 was analyzed in a similar way in Appendix B through SED and dust 345 GHz continuum visiblity modeling. For IRS48, we use the model derived by Bruderer et al. (2014), although we choose to use an exponential power-law density profile instead of a normal power-law, to be consistent with the other three disks in this study. With the new CO isotopologue data, we use the initial dust structure model and only vary a small number of parameters to fit the CO emission by eye by subsequent adjustments of the surface density, gas-to-dust-ratio, outer radius, and the δ parameters to fit the amount of gas inside the cavity. These are shown to be the most relevant parameters by our previous modeling. We do not use a χ2 or Markov-Chain-Monte-Carlo (MCMC) method, as the computational time of the models is too long and the number of parameters too large. Formal uncertainties of model parameters, the uniqueness of the fit and correlation between parameters cannot be computed directly, but the density and δ parameters are estimated to be within an order of magnitude and the radial parameters to within 5 AU based on a small model grid (see also Figure 5 and C.1). The outer disk CO emission and submillimeter continuum flux are fit simultaneously by varying Σc and the gas-to-dustratio GDR. The outer radius rout is set by fitting the CO spectrum (the maxima in the spectra or double peaks, arising from the Keplerian motion) and provides outer boundaries for computing the gas masses. Using this surface density profile, the emission inside the cavity is constrained by the δ parameters (Figure 4). The near infrared excess determines the dust density in the inner disk through δdust . The gas cavity radius rcavgas and drop δgas2 are fit to the CO emission. In some cases, an additional drop in gas surface density is required between rcavgas and the dust cavity radius rcavdust . This drop is indicated by δgas . The main parameters that are varied are the gas cavity radius rcavgas and the drop in gas density δgas2 between rsub and rcavgas . 5 N. van der Marel et al.: Gas cavities in transitional disks Fig. 4. Generic surface density profile for the gas and dust. Table 3. Results for the gas density profile of each transition disk. Parameter Surface density Radial structure Inner disk Vertical structure rc (AU) Σc (g cm−2 ) GDR (b) Mdust (10−3 M⊙ ) (b) Mgas (10−3 M⊙ ) rcavgas (AU) (d) δgas2 (d) rcavdust (AU) δgas (d) rout (AU) rsub (AU) rgap (AU) δdust (AU) hc (rad) ψ fls χ HD 13(a) 25 120 80 0.13 15 30 2·10−4 40 1 125 0.18 0.25 2·10−4 0.15 0.05 0.95 0.8 SR 21 15 400 100 0.075 7.7 7 10−20 (c) 25 5 · 10−2 60 0.18 1.0 1·10−6 0.07 0.15 0.85 0.2 DoAr 44 25 60 100 0.05 2.5 16 ≤ 10−4 32 10−2 60 0.08 1.0 1·10−2 0.1 0.1 0.85 0.2 IRS 48 60 0.5 12 0.015 0.55 25 ≤ 10−3 60 1 90 0.4 1.0 1·10−3 0.14 0.22 0.85 0.2 Notes. a) HD13=HD135344B. b) The masses are only constrained within rout for the detected surface brightness. c) The drop inside 7 AU could not be constrained by the ALMA data, we adopt the value from CO rovibrational spectroastrometry by Pontoppidan et al. (2008). d) The uncertainties on the gas cavity size is typically . 5 AU and less than one order of magnitude on the depth of the drop. The CO isotopologues provide better constraints on the density than the 12 CO because they are less optically thick (13 CO) or even optically thin (C18 O). The effects of isotope-selective photodissociation are properly considered in the modeling and discussed in Section 4.3. 4. Results Data and models are compared through the spectra and the zero moment maps (intensity maps) of both 13 CO and C18 O. For each target we show the direct comparison of the images of the intensity map of the best fit model, and the constraint on both rcavgas and δgas2 through spectra and intensity cuts through the major and minor axis of the zero-moment map. 6 In three of the four targets an inner gas cavity (smaller than the dust cavity) was required to fit the data. In SR21 the 7 AU cavity previously derived from rovibrational emission was adopted, but no gas cavity is resolved at the spatial resolution of ∼ 0.2” (24 AU) in our observations. In all disks, the depth is constrained to within an order of magnitude and the cavity size to within ±5 AU, mainly through the comparison of the spatially resolved emission, but further confirmed by the line wings in the spectra. In the intensity cuts in Figure 5 the δgas2 parameter is varied. The comparison shows that the uncertainty on the density drop is less than an order of magnitude. In Appendix C we show the intensity cuts for larger and smaller gas cavity radii, respectively. These plots show that the uncertainty on the gas cavity radius is typically .5 AU and the uncertainty on the depth is less than one order of magnitude. Furthermore, in both SR21 and DoAr44 an additional drop δgas between rcavgas and rcavdust is required to fit the data. The models of the 12 CO fits of van der Marel et al. (2015b) fit remarkably well the isotopologue data in the outer disk. Only minor corrections in surface density and gas-to-dust-ratio were required to fit the new data. However, inside the cavity the previously derived results for the gas surface density were found to be inconsistent. A modest drop in the gas density inside the dust cavity radius rcav was sufficient to explain the 12 CO data but no gas cavity was seen. Since the gas cavity becomes visible in the isotopologue data and turns out to be smaller than the dust cavity radius, the gas cavity radius rcavgas could be fit independently of the depth. 4.1. Results of individual targets HD135344B HD135344B shows a clear gas cavity, both in 13 CO and C18 O images, which is significantly smaller than the dust cavity (see top two panels of Figure 1). The modeling constrains the gas cavity radius to 30 AU (dust cavity radius is 40 AU) and the drop is 2 · 10−4 (top right panels in Figure 5). Previously, the model based on the 12 CO data required δgas of 10−1 − 10−2 for a cavity radius of 40 AU. A 30 AU gas cavity was also derived in van der Marel et al. (2015b) considering the inner radius of the small dust grains derived from the scattered light emission (Garufi et al. 2013), but a δgas value as low as ∼ 10−4 underproduces the 12 CO emission inside the cavity. As the 12 CO is optically thick and mainly traces the temperature at the τ = 1 surface, this new result suggests that the temperature structure is somewhat higher than in our model, perhaps due to some residual dust in the cavity (increasing the CO abundance due to its shielding and changing the heating-cooling balance) or the vertical structure (shadowing on the outer disk) (see Bruderer 2013, for a detailed discussion). The residual of the 13 CO emission (left panels in Figure 5) shows that the model overpredicts the emission in the outer disk (>0.5”). On the other hand, the C18 O residual has an underprediction of the emission in the outer disk. The residuals are spatially insignificant, but integrated over the whole disk they are likely related to real structure, suggesting an outer gas ring, with a possible gap. The radius of ∼ 100 AU coincides with a suggested planet that is launching one of the spiral arms observed in scattered light observations (Muto et al. 2012). If there is indeed a planet at this large orbit, it is expected to clear a gap in the gas, which could possibly explain the structure in the outer disk. As the focus of this study is only on the emission inside the dust cavity, this is not investigated further. N. van der Marel et al.: Gas cavities in transitional disks Fig. 5. Modeling results and observations of the 13 CO and C18 O emission for the best fitting models in derotated images and spectra. The left panels show the direct image comparison of the zero-moment map: derotated observations, model, convolved model and residual. In the residual map the overlaid contours indicate the 3σ levels, where dashed lines are negative. The central panels show the gas density profiles with different δgas2 drops in solid lines and the dust density profile in dashed lines. The right panels show the resulting intensity cuts for major and minor axis for both 13 CO and C18 O. The best-fitting model is indicated in red, other δgas2 values in blue. The drop in density can be constrained to within an order of magnitude. 7 N. van der Marel et al.: Gas cavities in transitional disks SR21 Unlike the other disks, the CO emission in SR21 does not appear to have a cavity. Rovibrational CO emission suggests a gas cavity of 7 AU radius (Pontoppidan et al. 2008), which remains unresolved at the ALMA spatial resolution (14 AU diameter∼0.12”). The physical model includes this 7 AU cavity. The 12 CO emission already indicated a drop in density between 7 AU and the dust cavity radius of 25 AU. The intensity cuts of the CO isotopologues also suggest a drop in density considering the strength of the emission (right panels in Figure 5). According to the model fitting, this drop is about two orders of magnitudes. nential power-law Σ(r) is replaced by an increasing exponential law between rcavdust and rcavgas , motivated by planet-disk interaction models, following: Σ(r) = Σ(rcav ) · e(r−rcav2 )/w where the width w is given by rcav − rcav2 w= ln(Σ(rcav )/δgas2 Σ(rcav2 ) (2) (3) DoAr44 is the only disk in this study with a symmetric dust ring. The dust cavity radius was found to be 32 AU (see Sect. B), using the same modeling approach as in van der Marel et al. (2015b). The cavity size and disk mass are similar to previous studies of SMA 345 GHz continuum data (Andrews et al. 2011). The drop in dust density inside the cavity (δdustcav ) is at least a factor 1000. The CO isotopologue intensity maps have low signal to noise compared to the other disks, likely due to the lower disk mass, but still show a gas cavity that is only half the size of the dust cavity: 16 AU. The δgas2 inside 16 AU is at most 10−4 . An additional drop in gas density between 16 and 32 AU of 10−2 is required to fit the emission (right panels in Figure 5). The width is just chosen to connect Σ(r) at rcavdust and rcavgas , fitting δgas2 , and no new parameters are introduced. This ’straight connection’ is further motivated by the shape of the gaps in Figure 7 in de Juan Ovelar et al. (2013) of planet-disk interaction models. Using the above relation and the derived cavity radii, the drop in density is derived again for the best fitting model (see Figure 6). The best fitting values are within a factor of 2 of the δgas2 values in the vertical drop model (Tabel 3): we find 2·10−4, 10−3 , 2·10−4 and 5·10−2 for HD135344B, SR21, DoAr44 and IRS48 respectively, although IRS48 is a poor fit compared to the double drop model. However, the outer radius of the slope (rcav ) of 60 AU has been constrained from the SED and VISIR image rather than from the millimeter continuum as in the other disks, due to the asymmetric structure, making this approach rather uncertain. Another possibility is that a combination with other clearing mechanisms are responsible for the different drop shapes. IRS48 4.3. Isotopologue selective photodissociation DoAr44 The CO isotopologue emission in IRS48 confirms the presence of a gas cavity with a considerably smaller radius than that of the peak of the dust asymmetry (60 AU), as found by Bruderer et al. (2014), consistent with the 30 AU gas ring found in rovibration CO emission (Brown et al. 2012). In order to be consistent with the models of the other disks, we assume a radial power-law with exponential cut-off rather than a simple power-law as done by Bruderer et al. (2014), but a similar vertical structure, density structure and mass are found as in their study. Because DALI considers only axisymmetric models, the millimeter continuum asymmetry is not fit: the total submillimeter flux, the VISIR 18µm image and the SED are again used to constrain the dust density and dust cavity radius. The gas cavity radius is found to be 25 rather than 20 AU found by Bruderer et al. (2014), but this is within the uncertainty on the radius, and no additional drop between 25 and 60 AU in density is required to fit the emission (right panels in Figure 5). 13 CO shows a full ring of emission. However, the emission is weaker at the location of the dust trap, as seen in the residual image (left panels in Figure 5). The 13 CO emission is barely optically thick at the dust trap radius of 60 AU (the τ = 1 surface is at the midplane) and the drop in emission is likely due to continuum optical depth or a drop in temperature due to the local increase of dust density. The S/N of the C18 O emission is too low to show the gas ring or this local drop in emission, but the data have been used to set constraints on the gas density. 4.2. A gradual drop The structure with two gas density drops inside the cavity found in DoAr44 and SR21 (and previously IRS 48, Bruderer et al. 2014) has been interpreted as implication of multiple planets at different orbits. An alternative explanation is a gradual drop or increasing surface density profile inside the cavity. In order to investigate this, we have run additional models where the expo- 8 The main process regulating the survival of CO in disks, photodissociation, does not equally affect different CO isotopologues (van Dishoeck & Black 1988). 12 CO becomes optically thick at low column densities and shield itself throughout the disk from the photodissociating flux. On the other hand, less abundant isotopologues, like C18 O, are not self-shielded until much deeper into the disk and continue being photodissociated. This results in regions where C18 O is less abundant than predicted by a constant [16 O/18 O] ratio found in the ISM. Accordingly, this leads to reduced C18 O line intensities. The importance of isotope selective effects varies depending disk parameters, dust properties and the stellar FUV field (Miotello et al. 2014). The UV field is calculated at each position in the DALI model taking into account the local dust density. For this reason, isotope-selective photodissociation has been implemented in the modeling of all disks in our sample. Isotopeselective effects are substantial only for C18 O line emission and in the outer disk regions, where the bulk of the gas phase CO is located (Figure 7). The effect on the outer disk emission is not detectable for SR21. On the other hand, IRS48 has an even lower disk mass but shows a significant difference. This may be related to the low gas-to-dust ratio in this disk. This shows how isotope-selective photodissociation depends on the combination of disk and stellar parameters and not only on the total disk gas mass. Interestingly, isotope-selective photodissociation only affects the CO isotopologue emission in the outer disk (rather than inside the cavity), likely because of the lower CO column densities and the temperatures, conditions where the isotopeselective photodissociation is more effective. A similar result was found in full disks, where the regions strongly affected by isotope-selective processes were located in the outer colder regions (Miotello et al. 2014). However, this is only true for conditions in these four disks. Possible effects in more extreme scenarios can not be excluded. N. van der Marel et al.: Gas cavities in transitional disks Fig. 7. Comparison of the spectra of the C18 O emission with (red, ISO) and without (blue, NOISO) implementing isotopeselective photodissociation. For HD135344B, SR21 and IRS48 there is a difference up to a factor of 2, while no difference is seen for DoAr44. Fig. 6. Comparison of the intensity cuts between the best fit models (blue) and a gradual model (red) as defined in Equation 2. The right panel gives the density profile. All disks except IRS48 can be fit equally well with this gradual increase profile. 5. Discussion The main outcome of Figure 3 and the modeling is that all four transition disks have gas inside the cavity, with a gas cavity that is smaller than the dust cavity (for SR21 adopted from Pontoppidan et al. (2008)). The CO isotopologues confirm the main result from the 12 CO data: gas is present inside the dust cavities and has a smaller decrease in density than the millimeter-dust. With the new optically thin isotopologue data, the density profiles are now much better constrained than based on just 12 CO data (van der Marel et al. 2015b). Two other transition disks have been sufficiently spatially resolved in CO and continuum to also confirm a gas cavity smaller than the dust cavity: HD142527 (Fukagawa et al. 2013; Perez et al. 2015) and J1604-2130 (Zhang et al. 2014; van der Marel et al. 2015b). To date, no counterexample has been found for which the gas follows the same distribution as the dust. This hints at the exciting possibility that the origin of transition disks indeed lies in embedded planets that have cleared their orbit in the gas and trapped the millimeter-dust at the edge. An upper limit on any embedded companions has been derived for HD135344B using direct imaging in Vicente et al. (2011): less than 1 brown dwarf mass at >37 AU radius. For SR21, companions with q > 0.01 or > 10MJup are ruled out for 11-21 AU orbital radius according to near-infrared aperture masking interferometry (Andrews et al. 2011). For the other two disks no limits on companions are known. Unfortunately the derived limits are outside the orbital range suggested by our gas cavity radii, assuming the companion orbital radius is close to the gas cavity radius. The difference between gas cavity radius and dust cavity radius can be compared with modeling results of planet-disk interaction by de Juan Ovelar et al. (2013). They show a relation between the observed dust cavity wall in the near infrared (SPHERE-ZIMPOL predictions), tracing the small dust grains, and the millimeter-dust cavity wall as observed by ALMA. Simulations were run for different planet masses at different radii (Figure 8 and Equation 1 in the mentioned paper). The simulations were performed assuming a viscosity of α ∼ 10−3 for a disk of 0.05 M⊙ . The ratio between the two radii f (M p ) is found to follow ! Mp γ f (M p ) = c · (4) MJup with c ∼ 0.85, and γ ∼ [−0.22, −0.18, −0.16] for planet orbital radius = [20, 40, 60] AU, respectively. Assuming that the small dust grains follow the gas, this relation can be applied directly to our cavity radii. The gas/dust cavity radii ratios for our targets are 0.75, 0.28, 0.5 and 0.42 for HD135344B, SR21, DoAr44 and IRS48, respectively, with gas cavity radii of 30, 7, 16 and 25 AU. Using the γ = −0.22 relation (closest to our gas cavity radii), planet masses are predicted to be 2, 11 and 25 MJup for HD135344B, DoAr44 and IRS48. For SR21, we extrapolate γ for the 7 AU gas cavity radius to be -0.26, resulting in a planet mass of 71 Jupiter masses. The derived masses remain uncertain due to the fixed viscosity in the models: a lower viscosity would result in lower masses. 9 N. van der Marel et al.: Gas cavities in transitional disks Another way to compare the observations with planet-disk interactions models is using the δgas2 drop value. The outcome of the gradual drop model is particularly interesting as it is a better resemblance to the shape of the gap carved by a planet as seen in planet-disk interaction simulations (Crida et al. 2006; Zhu et al. 2011; de Juan Ovelar et al. 2013; Fung et al. 2014). Fung et al. have derived an analytical prescription based on the outcome of numerical simulations of the depth of the gap, which can set constraints on the mass of the planet in combination with the viscosity in their Equation 14: Σgap /Σ0 = 4.7 × 10⁻³ −1 α 1.26 h/r !6.12 q 0.05 5 × 10⁻³ 10−2 (5) with q the mass ratio between planet and star, α the viscosity parameter, h/r the scale height and Σgap /Σ0 the drop in density, or δgas2 . The equation is only valid for q = 10−4 − 10−2 . A similar relation was recently derived by Kanagawa et al. (2015). The derived parameters can thus provide an estimate for the planet mass, assuming a certain viscosity value. The relation has a very strong dependence on h/r, due to the strong dependencies of the torque on the disk angular frequency. Note that the disks of these simulations are isothermal to make h/r constant as a function of radius. Since the gas temperature has in reality a strong vertical gradient due to the UV heating, especially at the cavity wall, this makes Equation 5 uncertain. On the other hand, these processes are happening close to the midplane and the isothermal approximation is not entirely incorrect. In applying the relation to our findings, h/r is only marginally constrained by our models due to the degeneracies√ in SED modeling. As h/r = c s /vk , with the sound speed c s ∝ T and vk the Keplerian velocity, it can be computed also directly from the derived midplane temperatures. We find h/r in our models at the gas cavity radius of 0.077, 0.063, 0.048 and 0.11 for HD135344B, SR21, DoAr44 and IRS48, respectively, which is generally not too far off from the h/r derived from our radiative transfer modeling. Using these values for h/r in combination with the δgas2 values derived for the gradual drop models for our disks, planet masses can be derived for α between 10−2 and 10−4 . For α = 10−2 , the q-values are > 0.01 (except for DoAr44), which is outside the range for which the analytical relation was derived. Higher qvalues, implying substellar mass companions, would result in eccentric gaps and/or entire disruption of the disk, which is why the relation is no longer valid. For reasonable planet masses (up to 10 Jupiter masses) that are consistent with the upper limits for companions mentioned above, this implies low viscosity values between α ∼ 10−3 and 10−4 , much lower than found in the TW Hya and HD163296 disks based on turbulent broadening (Hughes et al. 2011). The estimates derived here remain highly uncertain, due to the uncertainties in our modeling and the assumptions in the numerical models: the relation was empirically derived based on the outcome of numerical simulations with several important limitations: the vertical structure is isothermal, accretion onto the planet is ignored and the dust and gas are coupled, which is not true for a realistic physical disk. However, the δgas or Σgap /Σ0 , has been measured for the first time with an accuracy of better than an order of magnitude with these new observations. This parameter is inversely linear with q or planet mass and sets a constraint on the properties of these potential embedded planets. 10 6. Conclusions In this work, we have analyzed high spatial resolution ALMA submillimeter observations of 13 CO and C18 O line emission from 4 transition disks using full physical-chemical modeling. Using a previously derived surface density model of the dust, based on the SED and millimeter continuum visibilities, a physical model of the gas and dust was derived for each of the disks. The structure and amount of gas inside the cavity is the main point of interest as it gives direct information about potential embedded planets. 1. All four disks show a gas cavity that is up to two times smaller in radius than the dust cavity. Two other examples are known from the literature. 2. All disks can be fit to a gas density model with one or two drops in the gas density inside the cavity. 3. The gas density drop inside the cavity is at least a factor of 1000 compared to the gas surface density profile of the outer disk. 4. An alternative model with a gradual increase of surface density with radius inside the cavity fits the data equally well for three of the four disks. 5. The derived values of the gas mass from the CO isotopologues are within a factor of a few compared to previously derived values from spatially resolved 12 CO observations, submillimeter continuum and a gas to dust ratio of 100. The isotopologues are however crucial for the gas density profile inside the cavity. 6. The depth of the gas density drop indicates that the viscosities in these disks are low for reasonable companion masses. These spatially resolved isotopologue data point to embedded planets as by far the most likely explanation. Acknowledgements. The authors would like to thank P. Pinilla for useful discussions. Astrochemistry in Leiden is supported by the Netherlands Research School for Astronomy (NOVA), by a Royal Netherlands Academy of Arts and Sciences (KNAW) professor prize, and by the European Union A-ERC grant 291141 CHEMPLAN. This paper makes use of the following ALMA data: ADS/JAO.ALMA/X. ALMA is a partnership of ESO (representing its member states), NSF (USA) and NINS (Japan), together with NRC (Canada) and NSC and ASIAA (Taiwan), in cooperation with the Republic of Chile. The Joint ALMA Observatory is operated by ESO, AUI/NRAO and NAOJ. References Aikawa, Y., van Zadelhoff, G. J., van Dishoeck, E. F., & Herbst, E. 2002, A&A, 386, 622 Andrews, S. M., Wilner, D. J., Espaillat, C., et al. 2011, ApJ, 732, 42 Bally, J. & Langer, W. D. 1982, ApJ, 255, 143 Bergin, E., Calvet, N., D’Alessio, P., & Herczeg, G. J. 2003, ApJ, 591, L159 Brittain, S. D., Najita, J. R., & Carr, J. S. 2009, ApJ, 702, 85 Brown, J. M., Blake, G. A., Qi, C., et al. 2009, ApJ, 704, 496 Brown, J. M., Herczeg, G. J., Pontoppidan, K. M., & van Dishoeck, E. F. 2012, ApJ, 744, 116 Bruderer, S. 2013, A&A, 559, A46 Bruderer, S., van der Marel, N., van Dishoeck, E. F., & van Kempen, T. A. 2014, A&A, 562, A26 Bruderer, S., van Dishoeck, E. F., Doty, S. D., & Herczeg, G. J. 2012, A&A, 541, A91 Canovas, H., Schreiber, M. R., Cáceres, C., et al. 2015, ApJ, 805, 21 Casassus, S., van der Plas, G., M, S. P., et al. 2013, Nature, 493, 191 Clarke, C. J., Gendrin, A., & Sotomayor, M. 2001, MNRAS, 328, 485 Crida, A., Morbidelli, A., & Masset, F. 2006, Icarus, 181, 587 de Juan Ovelar, M., Min, M., Dominik, C., et al. 2013, A&A, 560, A111 Dodson-Robinson, S. E. & Salyk, C. 2011, ApJ, 738, 131 Dunkin, S. K., Barlow, M. J., & Ryan, S. G. 1997, MNRAS, 290, 165 Dutrey, A., Guilloteau, S., Piétu, V., et al. 2008, A&A, 490, L15 Espaillat, C., D’Alessio, P., Hernández, J., et al. 2010, ApJ, 717, 441 Espaillat, C., Muzerolle, J., Najita, J., et al. 2014, Protostars and Planets VI, 497 N. van der Marel et al.: Gas cavities in transitional disks Fukagawa, M., Tsukagoshi, T., Momose, M., et al. 2013, PASJ, 65, L14 Fung, J., Shi, J.-M., & Chiang, E. 2014, ApJ, 782, 88 Garufi, A., Quanz, S. P., Avenhaus, H., et al. 2013, A&A, 560, A105 Gorti, U. & Hollenbach, D. 2008, ApJ, 683, 287 Grady, C. A., Schneider, G., Sitko, M. L., et al. 2009, ApJ, 699, 1822 Hartmann, L., Calvet, N., Gullbring, E., & D’Alessio, P. 1998, ApJ, 495, 385 Hughes, A. M., Wilner, D. J., Andrews, S. M., Qi, C., & Hogerheijde, M. R. 2011, ApJ, 727, 85 Ingleby, L., Calvet, N., Bergin, E., et al. 2009, ApJ, 703, L137 Jonkheid, B., Faas, F. G. A., van Zadelhoff, G.-J., & van Dishoeck, E. F. 2004, A&A, 428, 511 Kamp, I. & Dullemond, C. P. 2004, ApJ, 615, 991 Kanagawa, K. D., Muto, T., Tanaka, H., et al. 2015, ApJ, 806, L15 Kraus, A. L. & Ireland, M. J. 2012, ApJ, 745, 5 Lynden-Bell, D. & Pringle, J. E. 1974, MNRAS, 168, 603 Lyo, A.-R., Ohashi, N., Qi, C., Wilner, D. J., & Su, Y.-N. 2011, AJ, 142, 151 Miotello, A., Bruderer, S., & van Dishoeck, E. F. 2014, A&A, 572, A96 Muto, T., Grady, C. A., Hashimoto, J., et al. 2012, ApJ, 748, L22 Najita, J. R., Strom, S. E., & Muzerolle, J. 2007, MNRAS, 378, 369 Pérez, L. M., Isella, A., Carpenter, J. M., & Chandler, C. J. 2014, ApJ, 783, L13 Perez, S., Casassus, S., Ménard, F., et al. 2015, ApJ, 798, 85 Piétu, V., Guilloteau, S., & Dutrey, A. 2005, A&A, 443, 945 Pinilla, P., Benisty, M., & Birnstiel, T. 2012, A&A, 545, A81 Pinilla, P., van der Marel, N., Perez, L., et al. 2015, A&A, in rev. Pontoppidan, K. M., Blake, G. A., van Dishoeck, E. F., et al. 2008, ApJ, 684, 1323 Prato, L., Greene, T. P., & Simon, M. 2003, ApJ, 584, 853 Quanz, S. P., Amara, A., Meyer, M. R., et al. 2015, ApJ, 807, 64 Quanz, S. P., Amara, A., Meyer, M. R., et al. 2013, ApJ, 766, L1 Regály, Z., Juhász, A., Sándor, Z., & Dullemond, C. P. 2012, MNRAS, 419, 1701 Salyk, C., Blake, G. A., Boogert, A. C. A., & Brown, J. M. 2009, ApJ, 699, 330 Salyk, C., Herczeg, G. J., Brown, J. M., et al. 2013, ApJ, 769, 21 Valenti, J. A., Basri, G., & Johns, C. M. 1993, AJ, 106, 2024 van der Marel, N., Pinilla, P., Tobin, J., et al. 2015a, acc. by ApJL van der Marel, N., van Dishoeck, E. F., Bruderer, S., et al. 2013, Science, 340, 1199 van der Marel, N., van Dishoeck, E. F., Bruderer, S., Pérez, L., & Isella, A. 2015b, A&A, 579, A106 van Dishoeck, E. F. & Black, J. H. 1988, ApJ, 334, 771 van Zadelhoff, G.-J., van Dishoeck, E. F., Thi, W.-F., & Blake, G. A. 2001, A&A, 377, 566 Vicente, S., Merı́n, B., Hartung, M., et al. 2011, A&A, 533, A135 Visser, R., van Dishoeck, E. F., & Black, J. H. 2009, A&A, 503, 323 Williams, J. P. & Cieza, L. A. 2011, ARA&A, 49, 67 Zhang, K., Isella, A., Carpenter, J. M., & Blake, G. A. 2014, ApJ, 791, 42 Zhu, Z., Nelson, R. P., Hartmann, L., Espaillat, C., & Calvet, N. 2011, ApJ, 729, 47 11 N. van der Marel et al.: Gas cavities in transitional disks Appendix A: Channel maps In this section we present the 13 CO channel maps for each observed target. Fig. A.1. 13 CO channel maps for each observed target. Overlaid in white contours are the Keplerian velocity profiles for the derived inclination and given stellar mass. 12 N. van der Marel et al.: Gas cavities in transitional disks Appendix B: Dust model DoAr44 Unlike the other disks, the dust surface density profile of DoAr44 was not yet constrained by ALMA data from previous papers. Using the same approach as in (van der Marel et al. 2015b), a model was found by fitting the SED, the 345 GHz continuum visibility curve and the 345 GHz continuum intensity cuts. The cavity size is 32 AU, similar to the previous result by Andrews et al. (2011). The depth of the dust density inside the cavity was constrained by varying the δdustcav between rgap and rcavdust . It was found that the dust density drops by at least a factor 103 , similar to the other disks. Fig. B.1. Modeling results and observations of DoAr44 of the dust surface density, comparing δdustcav ranging between 10−2 and 10−4 as indicated in the right panel. The observations are plotted in black. Left: Spectral Energy Distribution; middle left: Amplitude of the 345 GHz continuum visibility for the deprojected baselines. The null line is indicated with a dashed line; middle right: Normalized intensity cuts through the major (bottom) and minor (top) axis of the 345 GHz continuum image. The model images are convolved with the same beam as the ALMA observations; right: The dust surface density profile. Indicated are the δdust , the drop in density to fit the inner disk through the near infrared emission, and δdustcav , the minimum drop in dust density inside the cavity to fit the observations. Appendix C: Additional models Figure C.1 shows the modeling results for 13 CO for the baseline model (Table 3) for different gas cavity sizes. The plots demonstrate that the gas cavity radius is determined to within 5 AU uncertainty. Fig. C.1. Modeling results for different cavity sizes for three of the four sources. The plots show the 13 CO intensity cuts of the data (black) and the models (colors) for different density drops δgas2 . The central panel uses the gas cavity size rcavgas of the final model (see Table 3), the left panel the results for a 5 AU smaller gas cavity and the right panel the results for a 5 AU larger cavity. For SR21 the 7 AU radius remains unresolved in the ALMA data so the radius is not explored. The plots reveal that the gas cavity radius is determined to within 5 AU uncertainty. 13 N. van der Marel et al.: Gas cavities in transitional disks Fig. C.1. Continued. 14
© Copyright 2026