
Pathogenesis of type 2 diabetes mellitus
Med Clin N Am 88 (2004) 787–835
Pathogenesis of type 2 diabetes mellitus
Ralph A. DeFronzo, MD
Diabetes Division, University of Texas Health Science Center, 7703 Floyd Curl Drive,
San Antonio, TX 78229, USA
Normal glucose homeostasis
A discussion of the pathogenesis of type 2 diabetes mellitus must start
with a review of mechanisms involved in the maintenance of normal glucose
homeostasis in the basal or postabsorptive state (10–12 h overnight fast)
and following ingestion of a typical mixed meal [1–9]. In the postabsorptive
state the majority of total body glucose disposal takes place in insulinindependent tissues. Thus, approximately 50% of all glucose use occurs in
the brain, which is insulin-independent and becomes saturated at a plasma
glucose concentration of approximately 40 mg/dL [10]. Another 25% of
glucose disposal occurs in the splanchnic area (liver plus gastrointestinal
tissues), which is also insulin-independent. The remaining 25% of glucose
use in the postabsorptive state takes place in insulin-dependent tissues,
primarily muscle, and to a lesser extent adipose tissue. Basal glucose use,
approximately 2.0 mg/kg/min, is precisely matched by the rate of endogenous glucose production (Fig. 1). Approximately 85% of endogenous
glucose production is derived from the liver, and the remaining 15% is
produced by the kidney. Glycogenolysis and gluconeogenesis contribute
equally to the basal rate of hepatic glucose production.
Following glucose ingestion, the increase in plasma glucose concentration
stimulates insulin release, and the combination of hyperinsulinemia and
hyperglycemia (1) stimulates glucose uptake by splanchnic (liver and gut)
and peripheral (primarily muscle) tissues and (2) suppresses endogenous
(primarily hepatic) glucose production (Box 1) [1–9].
The majority ($80%–85%) of glucose uptake by peripheral tissues occur
in muscle, with a small amount ($4%–5%) metabolized by adipocytes.
Although fat tissue is responsible for only a small amount of total body
glucose disposal, it plays a very important role in the maintenance of total
body glucose homeostasis by regulating the release of free fatty acids (FFA)
from stored triglycerides (see discussion below) and through the production
of adipocytokines that influence insulin sensitivity in muscle and liver
0025-7125/04/$ - see front matter Ó 2004 Elsevier Inc. All rights reserved.
doi:10.1016/j.mcna.2004.04.013
788
R.A. DeFronzo / Med Clin N Am 88 (2004) 787–835
Fig. 1. Postabsorptive state. Glucose production and glucose use in the normal human in the
postabsorptive state. (From DeFronzo RA. Pathogenesis of type 2 diabetes mellitus: metabolic
and molecular implications for identifying diabetes genes. Diabetes 1997;5:117–9; with
permission.)
[11–14]. Insulin is a potent antilipolytic hormone, and even small increments
in the plasma insulin concentration markedly inhibit lipolysis, leading to
a decline in the plasma level of free fatty acid [12]. The decline in plasma
FFA concentration augments muscle glucose uptake and contributes to the
inhibition of hepatic glucose production. Thus, changes in the plasma FFA
concentration in response to increased plasma levels of insulin and glucose
play an important role in the maintenance of normal glucose homeostasis
[11–14].
Glucagon also plays a central role in the regulation of glucose
homeostasis [9,15]. Under postabsorptive conditions, approximately half
of total hepatic glucose output is dependent on the maintenance of normal
basal glucagon levels, and inhibition of basal glucagon secretion with
somatostatin causes a reduction in hepatic glucose production and plasma
Box 1. Factors responsible for the maintenance of normal
glucose tolerance in healthy subjects
A. Insulin secretion
B. Tissue glucose uptake
1. Peripheral (primarily muscle)
2. Splanchnic (liver plus gut)
C. Suppression of HGP
1. Decreased FFA
2. Decreased glucagons
D. Route of glucose administration
R.A. DeFronzo / Med Clin N Am 88 (2004) 787–835
789
glucose concentration. After a glucose-containing meal, glucagon secretion
is inhibited by hyperinsulinemia, and the resultant hypoglucagonemia
contributes to the suppression of hepatic glucose production and maintenance of normal postprandial glucose tolerance.
The route of glucose entry into the body also plays an important role in the
distribution of administered glucose and overall glucose homeostasis
[9,16,17]. Intravenous insulin exerts only a small stimulatory effect on
splanchnic (liver plus gut) glucose uptake, whereas intravenous glucose
augments splanchnic glucose uptake in direct proportion to the increase in
plasma glucose concentration. In contrast, oral glucose administration
markedly enhances splanchnic glucose uptake. The portal signal that
stimulates hepatic glucose uptake after glucose ingestion is directly proportional to the negative hepatic artery–portal vein glucose concentration
gradient [9]. As this gradient widens, the splanchnic nerves are stimulated, and
this activates a neural reflex in which vagal activity is enhanced, and
sympathetic nerves innervating the liver are inhibited. These neural changes
augment liver glucose uptake and stimulate hepatic glycogen synthase, while
simultaneously inhibiting glycogen phosphorylase. In contrast to intravenous
glucose/insulin administration, in which muscle accounts for the majority
($80%–85%) of glucose disposal, the splanchnic tissues are responsible for
the removal of approximately 30%–40% of an ingested glucose load. Glucose
administration through the gastrointestinal tract also has a potentiating effect
on insulin secretion. Thus, the plasma insulin response following oral glucose
is approximately twice as great as that following intravenous glucose, despite
equivalent increases in the plasma glucose concentration. This increase in
effect is related to the release of glucagon-like peptide (GLP)-1 and glucosedependent insulinotropic polypeptide (GIP) (previously called gastric inhibitory polypeptide) from the intestinal tissues cells [18,19].
Glucose homeostasis in type 2 diabetes mellitus
Type 2 diabetic subjects manifest multiple disturbances in glucose
homeostasis, including: (1) impaired insulin secretion; (2) insulin resistance
in muscle, liver, and adipocytes; and (3) abnormalities in splanchnic glucose
uptake [1,2,20,21].
Insulin secretion in type 2 diabetes mellitus
Impaired insulin secretion is found uniformly in type 2 diabetic patients in
all ethnic populations [1,2,20–29]. Early in the natural history of type 2
diabetes, insulin resistance is well established but glucose tolerance remains
normal because of a compensatory increase in insulin secretion. This dynamic
interaction between insulin secretion and insulin resistance has been well
documented. Within the normal glucose tolerant population, approximately
790
R.A. DeFronzo / Med Clin N Am 88 (2004) 787–835
20%–25% of individuals are severely resistant to the stimulatory effect of
insulin on glucose uptake (Fig. 2) (measured with the euglycemic insulin
clamp), and subjects in the lowest quartile of insulin sensitivity are as insulin
resistant as type 2 diabetics (see Fig. 2). Insulin secretion (measured with the
hyperglycemic clamp technique) in these insulin-resistant, nondiabetic
individuals, however, is increased in proportion to the severity of the insulin
resistance, and glucose tolerance remains normal. Thus, the beta cells are able
to ‘‘read’’ the severity of insulin resistance and adjust their secretion of insulin
to maintain normal glucose tolerance.
In type 2 diabetics, the fasting plasma insulin concentration is normal or
increased and basal insulin secretion (measured from C-peptide kinetics) is
elevated. The relationship between the fasting plasma glucose (FPG) and
Fig. 2. (A) Whole-body rate of glucose disposal during euglycemic insulin clamps in 32 women
divided according to quartiles of insulin sensitivity. * P
0.001 for each quartile versus the
adjacent quartile. (B) Time course of plasma insulin response during the hyperglycemic clamp in
the same 32 women divided into quartiles of insulin sensitivity. Insulin secretion rose
progressively from the highest to the lowest quartile of insulin sensitivity (P 0.01). , Quartile
1; 6, quartile 2; Ã, quartile 3; C, quartile 4. (From Diamond MP, Thornton K, ConnollyDiamond M, Sherwin RS, DeFronzo RA. Reciprocal variations in insulin-stimulated glucose
uptake and pancreatic insulin secretion in women with normal glucose tolerance. J Soc Gynecol
Invest 1995;2:708–15.)
R.A. DeFronzo / Med Clin N Am 88 (2004) 787–835
791
insulin concentrations resembles an inverted U shape or horseshoe [1,2].
Because this curve resembles Starling’s curve of the heart, it has been
referred to as Starling’s curve of the pancreas. As the fasting glucose rises
from 80 to 140 mg/dL, the fasting plasma insulin concentration increases
progressively, reaching a peak value 2.0–2.5-fold greater than in normal
weight, nondiabetic, age-matched controls. The progressive rise in fasting
plasma insulin level can be viewed as an adaptive response of the pancreas
to offset the progressive deterioration in glucose homeostasis. When the
FPG exceeds 140 mg/dL, the beta cell is unable to maintain its elevated rate
of insulin secretion, and the fasting insulin concentration declines precipitously. This decrease in fasting insulin level has important physiologic
implications, because it is at this point that hepatic glucose production (the
primary determinant of the FPG concentration) begins to rise.
The relationship between the mean plasma insulin response during an
OGTT and the FPG concentration also resembles an inverted U-shaped curve
(Fig. 3) [1,2]. The curve, however, is shifted to the left compared with the basal
insulin secretory rate, and the glucose-stimulated insulin response begins to
decline at a fasting glucose concentration of approximately 120 mg/dL. A
typical type 2 diabetic subject with a FPG level of 150–160 mg/dL secretes an
amount of insulin similar to that in a healthy nondiabetic individual; however,
a ‘‘normal’’ insulin response in the presence of hyperglycemia and underlying
insulin resistance is markedly abnormal. At FPG levels in excess of 150–160
mg/dL, the plasma insulin response, when viewed in absolute terms, becomes
Fig. 3. Starling’s curve of the pancreas for insulin secretion. In normal-weight patients with
IGT and mild diabetes, the plasma insulin response to OGTT increases progressively until the
fasting glucose reaches 120 mg/dL. Thereafter, further increases in the fasting glucose
concentration are associated with a progressive decline in insulin secretion. (From DeFronzo
RA. Lilly lecture 1987. The triumvirate: beta-cell, muscle, liver. A collusion responsible for
NIDDM. Diabetes 1988;37(6):667–87; with permission.)
792
R.A. DeFronzo / Med Clin N Am 88 (2004) 787–835
insulinopenic. Finally, when the fasting glucose exceeds 200–220 mg/dL, the
plasma insulin response to a glucose challenge is markedly blunted. Nonetheless, the fasting hyperinsulinemia persists despite FPG concentrations as high
as 250–300 mg/dL, and 24-hour integrated plasma insulin and C-peptide
profiles in lean type 2 diabetic patients remain normal. These normal day-long
values result from the combination of elevated fasting and decreased
postprandial insulin and C-peptide secretory rates [30,31].
It should be emphasized that, even though the plasma insulin response is
increased in absolute terms early in the development of type 2 diabetes (FPG
140 mg), this does not mean that beta-cell function is normal. The beta
cell responds to an increment in plasma insulin (DI) by an increment in
plasma glucose (DG) and this response is modulated by the severity of
insulin resistance, that is, the more severe the insulin resistance, the greater
the insulin response. When this index of beta-cell function is plotted against
the 2-hour plasma glucose concentration during the OGTT, the loss of
60%–70% of beta-cell function can be appreciated in individuals with
impaired glucose tolerance. In fact, normal glucose tolerant individuals in
the upper tertile of glucose tolerance (2-h plasma glucose, 120–140 mg/dL)
already have lost 50% of their beta-cell function [32].
The natural history of type 2 diabetes, starting with normal glucose
tolerance, insulin resistance, and compensatory hyperinsulinemia, with progression to impaired glucose tolerance (IGT) and overt diabetes mellitus, has
been observed in a variety of populations including whites, Native Americans,
Mexican Americans, and Pacific Islanders, and in the rhesus monkey, an
animal model that closely resembles type 2 diabetes in humans [1, 2,20–28,33–
35]. These population studies have demonstrated a strong association between
obesity and type 2 diabetes, leading to the new-world syndrome of
‘‘diabesity.’’ In high-risk populations, the progression from normal to IGT
is associated with marked increases in both fasting and glucose-stimulated
plasma insulin levels and a decrease in tissue sensitivity to insulin (Fig. 4). The
progression from IGT to type 2 diabetes with mild fasting hyperglycemia
(120–140 mg/dL, 6.7–7.8 mmol/L) is heralded by an inability of the beta cell to
maintain its previously high rate of insulin secretion in response to a glucose
challenge without further or only minimal deterioration in tissue sensitivity to
insulin. Increased basal insulin secretion and fasting hyperinsulinemia,
however, are maintained until the FPG exceeds 140 mg/dL. A similar pattern
of insulin secretion has been observed during the development of diabetes in
the rhesus monkey [33]. The aging monkey becomes obese, and a high
percentage of monkeys develop typical type 2 diabetes. The earliest detectable
abnormality (preceding the onset of diabetes mellitus) is a decrease in tissue
sensitivity to insulin, with a compensatory increase in fasting and glucosestimulated plasma insulin concentrations. With time, the high rate of insulin
secretion cannot be maintained, the beta cell starts on downward slope of
Starling’s curve (see Fig. 3), and fasting hyperglycemia and glucose intolerance ensue. In summary, these studies are consistent in demonstrating
R.A. DeFronzo / Med Clin N Am 88 (2004) 787–835
793
Fig. 4. Summary of the plasma insulin (top, ) and plasma glucose (bottom, C) responses
during a 100-g OGTT and tissue sensitivity to insulin (top, C) in control (CON), obese
nondiabetic (OB), obese glucose intolerant (OB-GLU INTOL), obese hyperinsulinemic diabetic
(OB-DIAB Hi INS), and obese hypoinsulinemic diabetic subjects (OB-DIAB Lo INS). See text
for a detailed discussion. (From DeFronzo RA. Lilly lecture 1987. The triumvirate: beta-cell,
muscle, liver. A collusion responsible for NIDDM. Diabetes 1988;37(6):667–87; with
permission.)
that hyperinsulinemia precedes the development of type 2 diabetes, and
hyperinsulinemia is a strong predictor of the development of IGT and type 2
diabetes. It should be emphasized, however, that overt diabetes (fasting
glucose ! 126 mg/dL) does not develop in the absence of a significant defect in
beta-cell function. The nature of this beta-cell defect is considered in
subsequent sections.
Type 2 diabetes with hypoinsulinemia
A large body of clinical and experimental evidence documents that
hyperinsulinemia and insulin resistance precede the onset of type 2 diabetes.
Nonetheless, a number of studies have shown that absolute insulin deficiency,
with or without impaired tissue insulin sensitivity, can lead to the development
794
R.A. DeFronzo / Med Clin N Am 88 (2004) 787–835
of type 2 diabetes. This scenario is best exemplified by patients with maturity
onset diabetes of youth (MODY) [36–38]. This familial subtype of type 2
diabetes is characterized by early age of onset, autosomal dominant inheritance with high penetrance, mild to moderate fasting hyperglycemia, and
impaired insulin secretion.
MODY originally was described by Fajans and coworkers [39], and
subsequently it was demonstrated that MODY1 resulted from a nonsense
mutation in exon 7 of the hepatic nuclear factor (HNF)4a gene. It later was
demonstrated that the occurrence of MODY in French families resulted
from mutations in the glucokinase gene on chromosome 7p (MODY2) [40].
Six specific mutations in different genes have been implicated in the MODY
profile, including glucokinase and five transcription factors [36–40]:
MODY1, HNF4a; MODY2, glucokinase; MODY3, HNF1a; MODY4,
insulin promoter factor 1; MODY5, HNF1b; and MODY6, neurogenic
differentiation 1/beta-cell E-box transactivator 2. The hallmark defect in
MODY individuals is impaired insulin secretion in response to glucose and
other secretagogues; however, peripheral tissue resistance to insulin and
abnormalities in hepatic glucose metabolism also have been shown to play
some role in the development of impaired glucose homeostasis [41,42].
Although glucokinase mutations are characteristic of MODY2, genetic
studies in typical older-onset type 2 diabetic individuals have shown that
glucokinase mutations account for less than 1% of the common form of
type 2 diabetes [43].
Cerasi [21] and Luft [44] and Hales [45] and coworkers proposed that
insulin deficiency represents the primary defect responsible for glucose
intolerance in typical type 2 diabetics who do not have glucokinase or other
MODY mutations. According to these investigators, impaired early insulin
secretion leads to an excessive rise in plasma glucose concentration, and the
resultant hyperglycemia is responsible for late hyperinsulinemia. Hales and
colleagues [45] have demonstrated that many lean whites with mild fasting
hyperglycemia ( 140 mg/dL, 7.8 mmol/L) are characterized by insulin
deficiency at all time points during an OGTT. An impaired early insulin
response also has been a characteristic finding in Japanese Americans who
progress to type 2 diabetes [46]. Unfortunately, none of these studies provide
information about insulin sensitivity. In whites, several investigating groups
[47,48] have demonstrated normal insulin sensitivity in a minority of type 2
diabetic individuals, and it has been suggested that up to 50% of AfricanAmerican type 2 diabetic patients who reside in New York City are
characterized by severely impaired insulin secretion and normal insulin
sensitivity [49]. A similar defect in insulin secretion has been described in
black African type 2 diabetics living in Cameroon [50]. In summary, it is
clear that impaired insulin secretion, in the absence of insulin resistance, can
lead to the development of full-blown type 2 diabetes, but it remains to be
clarified how frequently a pure beta-cell defect results in typical type 2
diabetes in the general population.
R.A. DeFronzo / Med Clin N Am 88 (2004) 787–835
795
First-phase insulin secretion
In response to intravenous glucose, insulin is secreted in a biphasic
pattern, with an early burst of insulin release within the first 10 minutes
followed by a progressively increasing phase of insulin secretion that persists
as long as the hyperglycemic stimulus is present [51]. This biphasic insulin
response is not observed after taking oral glucose because of the more
gradual rise in plasma glucose concentration. Loss of first-phase insulin
secretion is a characteristic and early abnormality in patients destined to
develop type 2 diabetes. In most type 2 diabetic subjects, a reduction in the
early phase of insulin secretion during the OGTT (0–30 min) and during the
intravenous glucose tolerance test (0–10 min) becomes evident when FPG
concentration exceeds 110–120 mg/dL (6.1–6.7 mmol/L) [34,35,51–53].
During the OGTT, the defect in early insulin secretion is most obvious if
the incremental plasma insulin response at 30 min is expressed relative to the
incremental plasma glucose response at 30 min (DI30 ‚DG30). Although the
first-phase insulin secretory response to intravenous glucose characteristically is diminished or lost in type 2 diabetes, this defect is not consistently
observed until the FPG concentration rises to approximately115–120 mg/dL
(6.4–6.7 mmol/L). The defect in first-phase insulin response can be partially
restored with tight metabolic control [54,55], indicating that at least part of
the defect is acquired, most likely secondary to glucotoxicity or liptoxicity
[11,56–59] (see subsequent discussion). Loss of the first phase of insulin
secretion has important pathogenic consequences, because this early burst of
insulin primes insulin target tissues, especially the liver, that are responsible
for the maintenance of normal glucose homeostasis [60,61].
Causes of impaired insulin secretion in type 2 diabetes mellitus
Progression from normal glucose tolerance to IGT to type 2 diabetes with
mild fasting hyperglycemia ( 120–140 mg/dL, 6.7–7.8 mmol/L) is characterized by hyperinsulinemia (see Figs. 3 and 4) [1,2,32]. When the fasting
glucose concentration exceeds approximately 120 mg/dL (6.7 mmol/L) and
approximately140 mg/dL (7.8 mmol/L), respectively, the fasting and
glucose-stimulated plasma insulin levels decline progressively. A number
of pathogenic genetic and acquired factors have been implicated in the
progressive impairment in insulin secretion. Pancreatic beta cells are in
a constant state of dynamic change, with continued regeneration of islets
from ductal endothelial cells of the exocrine pancreas and simultaneous
apoptosis [62]. Multiple abnormalities have been shown to disturb the
delicate balance between islet neogenesis and apoptosis (see subsequent
discussion).
Studies in first degree relatives of type 2 diabetic patients and in twins
have provided strong evidence for the genetic basis of beta-cell dysfunction
[63–66]. Impaired insulin secretion also has been shown to be an inherited
trait in Finnish families with type 2 diabetes mellitus with evidence for
a susceptibility locus on chromosome 12 [67].
796
R.A. DeFronzo / Med Clin N Am 88 (2004) 787–835
Both ‘‘glucotoxicity’’ [2,56] and ‘‘lipotoxicity’’ [11,57–59] are among the
acquired defects that can lead to impaired insulin secretion (Fig. 5). The
glucotoxicity hypothesis is supported by the observation that improved
glycemic control, however it is achieved (diet, insulin therapy, sulfonylureas,
metformin), leads to enhanced insulin secretion [54,55]. More direct support
of the glucotoxicity hypothesis comes from animal studies in which diabetic
rats were treated with phlorizin, a potent renal tubular glucose transporter
inhibitor that reduces the plasma glucose concentration without altering
other circulating substrate levels [68]. When administered to partially
pancreatectomized, chronically hyperglycemic diabetic rats, phlorizin restores normoglycemia and results in a dramatic improvement in both firstand second-phase insulin secretion. Conversely, when nondiabetic rats with
a reduced beta-cell mass are exposed in vivo to a chronic physiologic
increment in plasma glucose concentration of as little as 15 mg/dL, insulin
secretion by the pancreas perfused in vitro is inhibited by 75% [69,70]. These
provocative results suggest that a minimal elevation in mean plasma glucose
concentration, in the presence of a reduced beta-cell mass, can lead to
a major impairment in insulin secretion by the remaining pancreatic tissue.
Prolonged beta cell exposure to high glucose concentrations in vitro also has
been shown to impair insulin gene transcription, leading to decreased insulin
synthesis and secretion [71].
Lipotoxicity [11,57–59,72] also has been implicated as an acquired cause
of impaired beta-cell function, as individuals progress from IGT to overt
type 2 diabetes mellitus. Short-term exposure of beta cells to physiologic
increases in free fatty acids stimulates insulin secretion. Within the beta cell,
long-chain fatty acids are converted to their fatty acyl-CoA derivatives,
which lead to increased formation of phosphatidic acid and diacylglycerol.
These lipid intermediates activate specific protein kinase C isoforms, which
enhances the exocytosis of insulin. Long-chain fatty acyl-CoA also stimulate
Fig. 5. Pathogenetic factors implicated in the progressive impairment in insulin secretion in
type 2 diabetes mellitus. TNFa, tumor necrosis factor-a.
R.A. DeFronzo / Med Clin N Am 88 (2004) 787–835
797
exocytosis, cause closure of the Kþ-ATPase channel, stimulate Ca2þATPase and increase intracellular calcium, thus augmenting insulin secretion. In contrast to these acute effects, chronic beta cell exposure to elevated
fatty acyl-CoA inhibits insulin secretion through operation of the Randle
cycle. Increased fatty acyl-CoA levels within the beta cells also stimulate
ceramide synthesis, which augments inducible nitric-oxide synthase. The
resultant increase in nitric oxide increases the expression of inflammatory
cytokines, including interleukin-1 and tumor necrosis factor a, which impair
beta-cell function and promote beta cell apoptosis.
Most recently, deficiency of or resistance to ‘‘incretins’’ have been
implicated in the pathogenesis of beta-cell dysfunction in type 2 diabetic
patients [18,19,73–78]. When glucose is administered through the gastrointestinal route, a much greater stimulation of insulin secretion is observed
compared with a similar level of hyperglycemia created with intravenous
glucose [73]. This observation prompted a search for the responsible
‘‘incretins’’ or gut-derived hormones that enhance glucose-stimulated insulin secretion following the oral route of glucose administration. Two
gastrointestinal hormones, GIP and GLP-1, have been shown to account for
more than 90% of the incretin effect observed following glucose or mixedmeal ingestion [74–78]. Both GIP and GLP-1 are released from endocrine
cells of the duodenum and jejunum in response to intraluminal carbohydrate but not in response to circulating glucose. The stimulation of insulin
secretion by both GIP and GLP-1 is dependent on the ambient glucose
concentration, which is greater when plasma glucose concentration is high
and absent when the plasma glucose concentration returns to basal levels.
Antibodies that neutralize GIP and GLP-1 impair glucose tolerance in
a variety of animal species, including primates. Although the amount of
GLP-1 released is considerably less than that of GIP, GLP-1 is such a potent
potentiator of insulin secretion that it is thought to be the major incretin. In
type 2 diabetic humans, the GIP response to glucose ingestion is normal,
indicating the presence of beta-cell resistance to the incretin-effect of GIP. In
contrast, the GLP-1 response to oral glucose is reduced. Acute intravenous
administration of GLP-1 in type 2 diabetic patients enhances the postprandial insulin secretory response, and chronic continuous GLP-1 administration restores near-normal glycemia in type 2 diabetic patients [74,79].
GLP-1 also has been shown to augment islet regeneration in rodents [80].
Amylin (islet amyloid polypeptide [IAPP]) has been implicated in
progressive beta-cell failure in type 2 diabetes mellitus [81–83]. IAPP, which
is packaged with insulin in secretory granules and co-secreted into the
sinusoidal space, is the precursor for the amyloid deposits that are
frequently observed in type 2 diabetic and occur spontaneously in diabetic
monkeys. At very high doses, amylin has been shown to inhibit insulin
secretion by the perfused rat pancreas in vitro. Elevated plasma islet
amyloid polypeptide levels have been demonstrated in type 2 diabetic
subjects, obese glucose-intolerant subjects, glucose-intolerant first-degree
798
R.A. DeFronzo / Med Clin N Am 88 (2004) 787–835
relatives of type 2 diabetic patients, and in animal models of diabetes [81–
83]. Following its secretion, amylin accumulates extracellularly in close
proximity to the beta cell, and it has been suggested that amylin deposits
cause beta-cell dysfunction. Although it is attractive, this theory has been
challenged by Bloom and coworkers [84], who failed to find any inhibitory
effect of amylin on insulin secretion when the peptide was infused in
pharmacologic doses in rats, rabbits, and humans. Studies in transgenic
mice [85], which express the gene encoding either human or rat IAPP under
control of an insulin promoter, also mitigate against an important role of
IAPP in the development of beta-cell dysfunction. Thus, although pancreatic and plasma amyloid polypeptide levels were significantly elevated in
these transgenic mice, hyperglycemia and hyperinsulinemia did not develop.
A recent provocative review [86] even suggests that IAPP in the islets of
Langerhans may serve a protective role under conditions of increased
insulin secretion. In summary, definitive evidence that amylin contributes to
beta-cell dysfunction in human type 2 diabetes remains elusive, although
recent evidence [81] suggests that the combination of elevated plasma FFA
levels and amylin hypersecretion may interact synergistically to impair
insulin secretion and cause beta-cell injury.
The number of beta cells within the pancreas is an important determinant
of the amount of insulin that is secreted. Most [87–90] but not all [91,92]
studies have demonstrated a modest reduction (20%–40%) in beta-cell mass
in patients with long-standing type 2 diabetes. Obesity, another insulinresistant state, is characterized by a significant increase in beta-cell mass
[88], and the majority of type 2 diabetics are overweight. Thus, even a modest
reduction (20%–40%) in beta-cell mass is most impressive. On routine
histologic examination, the islets of Langerhans appear normal with the
exception of beta-cell degranulation [87–90]. Insulitis is not observed. The
factors responsible for the decrease in beta-cell mass in type 2 diabetics
remain to be identified. Several studies suggest that new islet formation from
exocrine ducts is reduced in type 2 diabetic individuals [93]. In animal model
of diabetes, there is evidence that islet neogenesis is reduced and beta-cell
apoptosis is accelerated [94]. Although recent studies with well-matched
controls (age, gender, and obesity) suggest that beta-cell mass is reduced,
even during the early stages of the development of type 2 diabetes, it seems
likely that factors in addition to beta-cell loss must be responsible for the
impairment in insulin secretion.
Low birth weight is associated with the development of IGT and type 2
diabetes in a number of populations [95]. Developmental studies in animals
and humans have demonstrated that poor nutrition and impaired fetal
growth (small babies at birth) are associated with impaired insulin secretion
or reduced beta-cell mass. Fetal malnutrition also can lead to the development of insulin resistance later in life [96]. One could hypothesize that
an environmental influence, for example, impaired fetal nutrition leading to
an acquired defect in insulin secretion or reduced beta-cell mass, when
R.A. DeFronzo / Med Clin N Am 88 (2004) 787–835
799
superimposed on insulin resistance, could eventuate in type 2 diabetes later
in life. Thus, during the normal aging process, with the onset of obesity or
with a worsening of the genetic component of the insulin resistance, the beta
cell would be called on to augment its secretion of insulin to offset the defect
in insulin action. If beta-cell mass (or function) is reduced (or impaired) by
an environmental insult during fetal life, this would lead to the development
of IGT and eventually to overt type 2 diabetes. Although such a defect
would limit the maximum amount of insulin that could be secreted, it would
not explain the progressive decline in insulin secretion in response to
physiological stimuli as individuals progress from IGT to type 2 diabetes
(see Fig. 4).
Insulin resistance and type 2 diabetes
In cross-sectional studies and long-term, prospective longitudinal studies,
hyperinsulinemia has been shown to precede the onset of type 2 diabetes in
all ethnic populations with a high incidence of type 2 diabetes [1,2,20–
27,34,35,97–102]. Studies using the euglycemic insulin clamp, minimal
model, and insulin suppression techniques have provided direct quantitative
evidence that the progression from normal to impaired glucose tolerance is
associated with the development of severe insulin resistance, whereas plasma
insulin concentrations, both in the fasting state and in response to a glucose
load (see Figs. 3 and 4) are increased when viewed in absolute terms (see
above discussion of insulin secretion). It should be emphasized, however,
that, even though the absolute insulin secretory rate is increased, beta-cell
sensitivity to glucose is markedly reduced in individuals with IGT.
Himsworth and Kerr [103], using a combined oral glucose and intravenous insulin tolerance test, were the first to demonstrate that tissue
sensitivity to insulin is diminished in type 2 diabetic patients. In 1975,
Reaven and colleagues [104], using the insulin suppression test, provided
further evidence that the ability of insulin to promote tissue glucose uptake
in type 2 diabetes was severely reduced. A defect in insulin action in type 2
diabetes also has been demonstrated with the arterial infusion of insulin into
the brachial artery (forearm muscle) and femoral artery (leg muscle) as well
as with radioisotope turnover studies, the frequently sampled intravenous
glucose tolerance test, and the minimal model technique [1,2,5,105–107].
DeFronzo et al [1,2,5,12,105,108,109], using the more physiologic euglycemic insulin clamp technique, have provided the most conclusive documentation that insulin resistance is a characteristic feature of lean, as well as obese,
type 2 diabetic individuals. Because diabetic patients with severe fasting
hyperglycemia (!180–200 mg/dL, 10.0–11.1 mmol/L) are insulinopenic (see
Fig. 3), and because insulin deficiency is associated with the emergence of
a number of intracellular defects in insulin action, these initial studies focused
on diabetics with mild to modest elevations in the FPG concentration (mean,
150 Æ 8 mg/dL, 8.3 Æ 0.4 mmol/L). Insulin-mediated whole-body glucose
800
R.A. DeFronzo / Med Clin N Am 88 (2004) 787–835
disposal in these lean diabetics was reduced by approximately 40%–50%,
providing conclusive proof of the presence of moderate to severe insulin
resistance. Three additional points are noteworthy: (1) lean type 2 diabetics
with more severe fasting hyperglycemia (198 Æ 10 mg/dL) have a severity of
insulin resistance that only is slightly greater (10%–20%) than diabetics with
mild fasting hyperglycemia; (2) the defect in insulin action is observed at all
plasma insulin concentrations, spanning the physiologic and pharmacologic
range (Fig. 6); and in (3) diabetic patients with overt fasting hyperglycemia
even maximally stimulating plasma insulin concentrations (under euglycemic
conditions) cannot elicit a normal glucose metabolic response. With a few
exceptions, the majority of investigators have demonstrated that lean type 2
diabetic subjects are resistant to the action of insulin [24–27,29,34,35,97,
101,107,110–112]. The ability of glucose (hyperglycemia) to stimulate its own
uptake, that is, the mass action effect of hyperglycemia, also is impaired in type
2 diabetics [113].
Site of insulin resistance in type 2 diabetes
Maintenance of normal whole-body glucose homeostasis requires a normal insulin secretory response and normal tissue sensitivity to the independent effects of hyperinsulinemia and hyperglycemia to augment
glucose uptake [1–7]. The combined effects of insulin and hyperglycemia
to promote glucose disposal are dependent on three tightly coupled
mechanisms (see Box 1): (1) suppression of endogenous (primarily hepatic)
glucose production; (2) stimulation of glucose uptake by the splanchnic
Fig. 6. Dose-response curve relating the plasma insulin concentration to the rate of insulinmediated whole-body glucose uptake in control (C) and type 2 diabetic () subjects. * P 0.01
versus control subjects. (From Groop LC, Bonadonna RC, DelPrato S, Ratheiser K, Zyck K,
Ferrannini E, DeFronzo RA. Glucose and free fatty acid metabolism in non-insulin-dependent
diabetes mellitus. Evidence for multiple sites of insulin resistance. J Clin Invest 1989;84(1):205–
13; with permission.)
R.A. DeFronzo / Med Clin N Am 88 (2004) 787–835
801
(hepatic plus gastrointestinal) tissues; and (3) stimulation of glucose uptake
by peripheral tissues, primarily muscle. Muscle glucose uptake is regulated
by flux through two major metabolic pathways: glycolysis (of which $90%
represents glucose oxidation) and glycogen synthesis.
Hepatic glucose production
In the postabsorptive state, the liver of healthy subjects produces glucose at
the rate of 2.0 mg/kg/min [1,2,12,114]. This glucose efflux is essential to meet
the needs of the brain and other neural tissues, which use glucose at a constant
rate of approximately 1.0 to 1.2 mg/kg/min [10,115]. Brain glucose uptake is
insulin-independent and accounts for approximately 50% to 60% of glucose
disposal under fasting conditions. Therefore, brain glucose uptake occurs at
the same rate during absorptive and postabsorptive periods, and it is not
altered in type 2 diabetes. During glucose ingestion, insulin is secreted into the
portal vein where it is taken up by the liver and suppresses hepatic glucose
output. If the liver does not perceive this insulin signal and continues to
produce glucose, there will be two inputs of glucose into the body, one from the
liver and a second from the gastrointestinal tract, and marked hyperglycemia
will ensue.
In type 2 diabetics with mild fasting hyperglycemia ( 140 mg/dL), the
postabsorptive level of hyperinsulinemia is sufficient to offset the hepatic
insulin resistance and maintain a normal basal rate of hepatic glucose output
[114]. In diabetic subjects with mild to moderate fasting hyperglycemia (140–
200 mg/dL, 7.8–11.1 mmol/L), however, basal hepatic glucose production is
increased by approximately 0.5 mg/kg/min (Fig. 7) [1,2,12,114]. Thus, during
overnight sleeping hours (20:00 h to 08:00 h), the liver of an 80-kg diabetic
individual with modest fasting hyperglycemia adds approximately 30 g of
additional glucose to the systemic circulation. The increase in basal hepatic
glucose production (HGP) is closely correlated with the severity of fasting
hyperglycemia (see Fig. 7) [1,2,12,114], and this has been demonstrated in
numerous studies [116–118]. In conclusion, in type 2 diabetics with overt
fasting hyperglycemia (!140 mg/dL, 7.8 mmol/L), an excessive rate of hepatic
glucose output is the major abnormality responsible for the elevated FPG
concentration.
Under postabsorptive conditions, the fasting plasma insulin concentration
in type 2 diabetics is 2- to 4-fold greater than in nondiabetic subjects [1,2].
Because hyperinsulinemia is a potent inhibitor of HGP, it is obvious that
hepatic resistance to the action of insulin must be present to explain the
excessive output of glucose by the liver. Because hyperglycemia per se exerts
a powerful suppressive action on HGP, the liver also must be resistant to
the inhibitory effect of hyperglycemia on hepatic glucose output, and this has
been well documented.
The dose response relationship between hepatic glucose production and
the plasma insulin concentration has been examined with the euglycemic
802
R.A. DeFronzo / Med Clin N Am 88 (2004) 787–835
Fig. 7. Summary of hepatic glucose production (HGP) in 77 normal-weight type 2 diabetic
subjects () with fasting plasma glucose concentrations ranging from 105 to greater than 300 mg/
dL. Seventy-two control subjects matched for age and weight are shown by filled circles. In the 33
diabetic subjects with fasting plasma glucose levels less than 140 mg/dL (shaded area), the mean
rate of hepatic glucose production was identical to that of control subjects. In diabetic subjects
with fasting plasma glucose concentrations greater than 140 mg/dL, there was a progressive rise in
hepatic glucose production that correlated closely (r, 0.847; P 0.001) with the fasting plasma
glucose concentration. (From DeFronzo RA, Ferrannini E, Simonson DC. Fasting hyperglycemia
in non-insulin-dependent diabetes mellitus: contributions of excessive hepatic glucose production
and impaired tissue glucose uptake. Metabolism 1989;38(4):387–95; with permission.)
insulin clamp technique and radioisotopic glucose (Fig. 8) [12]. The
following points deserve emphasis: (1) the dose-response curve relating
inhibition of HGP to the plasma insulin level is very steep, with a halfmaximal insulin concentration (ED50) of approximately 30 to 40 lU/mL; (2)
Fig. 8. Dose-response curve relating the plasma insulin concentration to the suppression of
hepatic glucose production in control (C) and type 2 diabetic () subjects with moderately
severe fasting hyperglycemia. * P 0.05; ** P 0.01 versus control subjects. (From Groop LC,
Bonadonna RC, DelPrato S, Ratheiser K, Zyck K, Ferrannini E, DeFronzo RA. Glucose and
free fatty acid metabolism in non-insulin-dependent diabetes mellitus. Evidence for multiple
sites of insulin resistance. J Clin Invest. 1989;84(1):205–13; with permission.)
R.A. DeFronzo / Med Clin N Am 88 (2004) 787–835
803
in type 2 diabetics, the dose-response curve is shifted to the right, indicating
resistance to the inhibitory effect of insulin on hepatic glucose production.
Elevation of the plasma insulin concentration to the high physiologic range
($100 lU/mL), however, can overcome the hepatic insulin resistance and
cause a near normal suppression of HGP; and (3) the severity of the hepatic
insulin resistance is related to the level of glycemic control. In type 2
diabetics with mild fasting hyperglycemia, an increment in plasma insulin
concentration of 100 lU/mL causes a complete suppression of HPG;
however, in diabetic subjects with more severe fasting hyperglycemia, the
ability of the same plasma insulin concentration to suppress HGP is
impaired. These observations indicate that there is an acquired component
of hepatic insulin resistance, which becomes progressively worse as the
diabetic state decompensates over time.
Hepatic glucose production can be derived from either glycogenolysis or
gluconeogenesis [9]. Using the hepatic vein catheter technique, the uptake by
the liver of gluconeogenic precursors, especially lactate, has been shown to
increased in type 2 diabetic subjects [119], and this has been confirmed with
radioisotope turnover studies using radiolabeled lactate, alanine, glutamine,
and glycerol [120,121]. More recent studies using 13C-labeled magnetic
resonance imaging [122] and D2O [123] have confirmed that approximately
90% of the increase in HGP above baseline can be accounted for by
accelerated gluconeogenesis. A variety of mechanisms has been shown to
contribute to the increase in hepatic gluconeogenesis, including hyperglucagonemia, enhanced sensitivity to glucagon, increased circulating levels of
gluconeogenic precursors (lactate, alanine, glycerol), increased FFA oxidation, and decreased sensitivity to insulin.
Because of the inaccessibility of the liver in humans, it has been difficult to
examine the role of key enzymes involved in the regulation of gluconeogenesis
(pyruvate carboxylase, phosphoenol-pyruvate carboxykinase), glycogenolysis (glycogen phosphorylase), and net hepatic glucose output (glucokinase,
glucose-6-phosphatase). Considerable evidence from animal models of type 2
diabetes and some evidence in humans, however, has implicated increased
activity of phosphoenolpyruvate carboxykinase and glucose-6-phosphatase
in the accelerated rate of hepatic glucose production [123,124].
The kidney possesses all of the gluconeogenesis enzymes required to
produce glucose, and estimates of the renal contribution to total endogenous
glucose production have ranged from 5% to 20% [125,126]. These varying
estimates of the contribution of renal gluconeogenesis to total glucose production are largely related to the methodology used to measure renal glucose
production [127]. One unconfirmed study suggests that the rate of renal
gluconeogenesis is increased in type 2 diabetics with fasting hyperglycemia
[128], but studies using the hepatic vein catheter technique have shown that all
of the increase in total body endogenous glucose production (measured with
[3-3H]glucose) in type 2 diabetics can be accounted for by increased hepatic
glucose output (measured by the hepatic vein catheter technique) [5].
804
R.A. DeFronzo / Med Clin N Am 88 (2004) 787–835
Peripheral (muscle) glucose uptake
Muscle is the major site of insulin-stimulated glucose disposal in humans
[1–3,5,129,130]. Under euglycemic conditions, studies using the euglycemic
insulin clamp in combination with femoral artery or vein catheterization
have shown that approximately 80% of total body glucose uptake occurs in
skeletal muscle. In response to a physiologic increase in plasma insulin
concentration ($80–100 lU/mL), leg muscle glucose uptake increases
progressively in healthy subjects and reaches a plateau value of approximately 10 mg/kg leg weight/min (Fig. 9) [5]. In contrast, in lean type 2
diabetic subjects, the onset of insulin action is delayed by approximately 40
min, and the amount of glucose taken up by the leg is markedly blunted,
even though the insulin infusion is continued for an additional 60 min to
allow insulin to more fully express its biologic effects. During the last hour
of the insulin clamp study, the rate of glucose uptake was reduced by 50% in
the type 2 diabetic group. These results provide conclusive evidence that
muscle represents the primary site of insulin resistance during euglycemic
insulin clamp studies performed in type 2 diabetic subjects. Using the
forearm and leg catheterization techniques, a number of investigators have
demonstrated a decrease in insulin-stimulated muscle glucose uptake.
Studies using positron emission tomography have provided additional
support for the presence of severe muscle insulin resistance in type 2
diabetic subjects.
Fig. 9. Time course of change in leg glucose uptake in type 2 diabetic () and control (C)
subjects. In the postabsorptive state, glucose uptake in the diabetic group was significantly
greater than that in control subjects. The ability of insulin (euglycemic insulin clamp) to
stimulate leg glucose uptake, however, was reduced by 50% in the diabetic subjects. * P \ 0.05;
** P \ 0.01. (From DeFronzo RA, Gunnarsson R, Bjorkman O, Olsson M, Wahren J. Effects
of insulin on peripheral and splanchnic glucose metabolism in noninsulin-dependent (type II)
diabetes mellitus. J Clin Invest 1985;76(1):149–55; with permission.)
R.A. DeFronzo / Med Clin N Am 88 (2004) 787–835
805
Splanchnic (hepatic) glucose uptake
Because of the difficulty in catheterizing the portal vein in humans, glucose
disposal by the liver has not been examined directly. Use of the hepatic vein
catheterization technique in combination with the euglycemic insulin clamp,
however, has allowed investigators to examine the contribution of the
splanchnic (liver plus gastrointestinal) tissues to overall glucose homeostasis
in lean type 2 diabetic subjects [3,5,129]. In the postabsorptive state, there is
a net release of glucose from the splanchnic area (ie, negative balance) in both
control and diabetic subjects, reflecting glucose production by the liver.
When insulin is infused while maintaining euglycemia, splanchnic glucose
output is promptly suppressed (reflecting inhibition of HGP) and, within 20
min, the net glucose balance across the splanchnic region decreases to zero
(i.e., no net uptake or release). After 2 hours of sustained hyperinsulinemia,
the splanchnic area manifests a small net uptake of glucose, approximately
0.5 mg/kg/min (i.e., positive balance), which is virtually identical to the rate
of splanchnic glucose uptake during in the basal state. These results indicate
that the splanchnic tissues, like the brain, are largely insensitive to insulin
with respect to the stimulation of glucose uptake. There were no differences
between diabetic and control subjects in the amount of glucose taken up by
the splanchnic tissues at any time during the insulin clamp study.
In summary, under conditions of euglycemic hyperinsulinemia, very little
infused glucose is taken up by the splanchnic (and therefore hepatic) tissues.
Because the difference in insulin-mediated total body glucose uptake
between type 2 diabetic and control subjects during the euglycemic insulin
clamp study was 2.5 mg/kg/min, it is obvious that a defect in splanchnic
(hepatic) glucose removal cannot account for the impairment in total body
glucose uptake following intravenous glucose/insulin administration; however, following glucose ingestion, the gastrointestinal route of glucose entry
and the resultant hyperglycemia conspire to enhance splanchnic (hepatic)
glucose uptake [4,9,16,17,131] and, under these conditions, diminished
hepatic glucose uptake has been shown to contribute to impaired glucose
tolerance in type 2 diabetes (see discussion below).
Summary: whole-body glucose use
A summary of insulin-mediated whole-body glucose metabolism during
the euglycemic insulin clamp is depicted in (Fig. 10). The height of each bar
represents the total amount of glucose taken up by all tissues in the body
during the insulin clamp in control and type 2 diabetic subjects. Net
splanchnic glucose uptake (quantitated by hepatic vein catheterization) is
similar in both groups and averaged 0.5 mg/kg/min. Adipose tissue glucose
uptake accounts for no more than 5% of total glucose disposal. Brain
glucose uptake, estimated to be 1.0–1.2 mg/kg/min in the postabsorptive
state, is unaffected by hyperinsulinemia. Muscle glucose uptake (extrapolated from leg catheterization data) in control subjects accounts for
806
R.A. DeFronzo / Med Clin N Am 88 (2004) 787–835
Fig. 10. Summary of glucose metabolism during euglycemic insulin (100 lU/mL) clamp studies
performed in normal-weight type 2 diabetic and control subjects (see text for a more detailed
discussion). NIDD, non-insulin-dependent diabetes. (From DeFronzo RA. Pathogenesis of type
2 diabetes mellitus: metabolic and molecular implications for identifying diabetes genes.
Diabetes 1997;5:117–269; with permission.)
approximately 75%–80% of glucose uptake by the body. In type 2 diabetic
subjects, the largest part of the impairment in insulin-mediated glucose
uptake is explained by the defect in muscle glucose disposal. Numerous
studies have demonstrated that adipocytes from type 2 diabetics are
resistant to insulin, but because the total amount of glucose taken up by
fat cells during the insulin clamp is small [130], even if adipose tissue of type
2 diabetic subjects took up no glucose, it could, at best, explain only a small
fraction of the defect in whole-body glucose metabolism.
Glucose disposal during OGTT
During daily life, the normal route of glucose entry into the body is
through the gastrointestinal tract. To assess tissue glucose disposal
following glucose ingestion, Ferrannini, DeFronzo, and colleagues [131–
133] administered oral glucose combined with hepatic vein catheterization to
healthy control subjects to examine splanchnic glucose metabolism. The oral
glucose load and endogenous glucose pool were labeled with [1-14C]glucose
and [3-3H]glucose, respectively, to quantitate total body glucose disposal
(from tritiated glucose turnover) and endogenous HGP (difference between
the total rate of glucose appearance, measured with tritiated glucose, and
the rate of oral glucose appearance, measured with [1-14C]glucose).
During the 3.5 hours after glucose (68 g) ingestion: (1) 28% (19 g) of the
oral load was taken up by splanchnic tissues; (2) 72% (48 g) was removed by
nonsplanchnic tissues; (3) of the 48 g taken up by peripheral tissues, the
R.A. DeFronzo / Med Clin N Am 88 (2004) 787–835
807
brain (an insulin-independent tissue) disposed of 22% (15 g or 1 mg/kg/min)
of the total glucose load; and (4) basal HGP declined by 53% [131]. Similar
percentages for splanchnic glucose uptake (24%–29%) and suppression of
HGP (50%–60%) in normal subjects have been reported by other investigators [8,134–136]. The contribution of skeletal muscle to the disposal of
an oral glucose load has been reported to vary from a low of 26% [135] to
a high of 56% [136], with a mean of 45% [8,131,134–136]. These results
demonstrate a number of important differences between oral and intravenous glucose administration. After glucose ingestion, HGP is less
completely suppressed, most likely because of activation of local sympathetic nerves that innervate the liver, peripheral tissue (primarily muscle)
glucose uptake is quantitatively less important [3], and splanchnic glucose
uptake quantitatively is much more important.
When an oral glucose is given to type 2 diabetic individuals, marked
glucose intolerance is observed, and this results from decreased tissue
(muscle) glucose uptake and impaired suppression of HGP. The uptake of
glucose by the splanchnic tissues is similar in diabetic and control groups.
Impaired suppression of HGP accounts for approximately one third of the
defect in total-body glucose homeostasis, whereas reduced peripheral
(muscle) glucose uptake accounts for the remaining two thirds. It should
be noted that, even though the total amount of glucose taken up by the
splanchnic region in type 2 diabetics is ‘‘normal,’’ splanchnic glucose
metabolism is quite abnormal. Because hyperglycemia per se enhances
splanchnic (hepatic) glucose uptake in proportion to the increase in plasma
glucose concentration, and because the rise in plasma glucose concentration
in diabetics is excessive, the splanchnic glucose clearance (splanchnic glucose
uptake ‚ plasma glucose concentration) following glucose ingestion is
markedly reduced in type 2 diabetic subjects. Using a combined insulin
clamp/OGTT technique, an impairment in glucose uptake by the splanchnic
tissues in type 2 diabetics has been demonstrated directly [137].
In summary, following glucose ingestion both impaired suppression of
HGP and decreased muscle glucose uptake are responsible for the glucose
intolerance of type 2 diabetes. The efficiency of the splanchnic (hepatic)
tissues to take up glucose (as reflected by the splanchnic glucose clearance)
also is impaired in type 2 diabetic individuals.
Summary: insulin resistance in type 2 diabetes
Insulin resistance in muscle and liver is a characteristic feature of type 2
diabetes mellitus. In the basal state, the hepatic insulin resistance is
manifested by overproduction of glucose despite fasting hyperinsulinemia,
and the increased rate of hepatic glucose output is the primary determinant of
the elevated FPG concentration in type 2 diabetic individuals. Although
muscle glucose uptake in the postabsorptive state is increased when viewed in
absolute terms, the efficiency with which glucose is taken up (ie, the glucose
808
R.A. DeFronzo / Med Clin N Am 88 (2004) 787–835
clearance) by muscle is diminished. During insulin-stimulated conditions,
both decreased muscle glucose uptake and impaired suppression of HGP
contribute to the glucose intolerance.
Dynamic interaction between insulin sensitivity and insulin secretion in type 2
diabetes
Insulin resistance is present in approximately 25% of the adult population
[138–140]. The majority of these individuals, however, have normal glucose
tolerance because the pancreatic beta cells are able to read the severity of
insulin resistance and appropriately augment their insulin secretory rate. This
dynamic interaction between insulin sensitivity and insulin secretion is
demonstrated by results obtained in healthy, lean, young normal-glucosetolerant women who received a euglycemic insulin clamp (1 mU/kg/min) and
were stratified into quartiles based on the rate of insulin-mediated glucose
disposal (see Fig. 2A) [141]. Women in the lowest quartile were as insulin
resistant as type 2 diabetic individuals. Insulin secretion was measured on
a separate day with a þ125-mg/dL hyperglycemic clamp (see Fig. 2B). Women
who were the most insulin resistant (quartile 1) had the highest fasting plasma
insulin concentrations and highest early and late-phase plasma insulin responses (see Fig. 2B). Conversely, women who were the most insulin sensitive
(quartile 4) had the lowest plasma insulin response. A very strong positive
correlation (r, 0.79, P 0.001) was observed between the severity of insulin
resistance and the insulin secretory response. Similar results relating the
plasma insulin response and the severity of insulin resistance have been
reported in normal-glucose-tolerant subjects with the minimal model technique and the insulin suppression/OGTT.
The dynamic interaction between insulin secretion and insulin sensitivity in type 2 diabetic individuals has been the subject of intensive
investigation. DeFronzo [2] studied lean (ideal body weight
120%) and
obese (ideal body weight ! 125%) subjects with varying degrees of glucose
tolerance: group I, obese subjects (n = 24) with normal glucose tolerance;
group II, obese subjects (n = 23) with impaired glucose tolerance; group III,
obese subjects (n = 35) with overt diabetes, who were subdivided into those
with a hyperinsulinemic response and those with a hypoinsulinemic response
during an OGTT; group IV, normal weight type 2 diabetics (n = 26); and
group V, normal weight subjects (n = 25) with normal glucose tolerance (see
Fig. 4). All subjects received a euglycemic insulin ($100 lU/mL) clamp to
quantitate whole-body insulin sensitivity and an OGTT to provide a measure
of glucose tolerance and insulin secretion. The insulin clamp was performed
with indirect calorimetry to quantitate rates of glucose oxidation and
nonoxidative glucose disposal, which primarily reflects glycogen synthesis.
In normal weight type 2 diabetic subjects, insulin-mediated whole-body
glucose uptake was reduced by 40%–50%, and the impairment in insulin
R.A. DeFronzo / Med Clin N Am 88 (2004) 787–835
809
action resulted from defects in both glucose oxidation and glycogen
synthesis. It is particularly noteworthy that obese, normal glucose tolerant
individuals were as insulin resistant as the lean normal-weight diabetic
subjects (see Fig. 4) and that the insulin resistance resulted from defects in
both glucose oxidation and glycogen synthesis. Thus, from the metabolic
standpoint, obesity and type 2 diabetes closely resemble each other. Similar
results concerning reduced whole-body insulin sensitivity in obese and type
2 diabetic individuals have been reported by other investigators [142,143].
Despite nearly identical degrees of insulin resistance, the normal-weight
diabetic subjects (see Fig. 4) had fasting hyperglycemia and marked glucose
intolerance, whereas the obese nondiabetic individuals had normal oral
glucose tolerance. This apparent paradox is explained by the plasma insulin
response during the OGTT (see Fig. 4). Compared with control subjects, the
obese group secreted more than twice as much insulin, and this hyperinsulinemic response was sufficient to offset the insulin resistance. In
contrast, the pancreas of normal-weight diabetic subjects, when faced with
the same challenge, was unable to augment its secretion of insulin
sufficiently to compensate for the insulin resistance. This imbalance between
insulin secretion and the severity of insulin resistance in liver and muscle
resulted in a frankly diabetic state, with fasting hyperglycemia and marked
glucose intolerance.
The coexistence of obesity and diabetes in the same individual resulted in
a severity of insulin resistance that was only slightly greater than that in
either the normal-weight diabetic or nondiabetic obese groups (see Fig. 4).
Although hyperinsulinemic and hypoinuslinemic obese diabetic subjects
were equally insulin resistant, the glucose intolerance was much worse in the
hypoinsulinemic group, and this was related entirely to the presence of
severe insulin deficiency (see Fig. 4).
The interaction between insulin secretion and insulin resistance in lean,
obese, and diabetic groups can be summarized as follows. In the obese
nondiabetic subjects, tissue sensitivity to insulin (Fig. 4, top) is markedly
reduced, but glucose tolerance (bottom) remains normal because the
pancreas is able to augment its secretion of insulin (top) to offset the defect
in insulin action. The development of IGT, the mean plasma glucose
concentration during the OGTT, increases only minimally because the
pancreas is able to further augment its secretion of insulin to counteract the
deterioration in insulin sensitivity. Progression from IGT to overt diabetes is
signaled by a decrease in insulin secretion without any worsening of insulin
resistance (see Fig. 4). The obese diabetic has tipped over the top of
Starling’s curve of the pancreas and is now on the descending portion (see
Figs. 3 and 4). Although, compared with nondiabetic control subjects, the
plasma insulin response is increased, the hyperinsulinemia is insufficient to
offset the severity of insulin resistance. In the normal-weight diabetic group,
there is a further decline in glucose tolerance, which results from a greater
impairment in insulin secretion without any additional deterioration in
810
R.A. DeFronzo / Med Clin N Am 88 (2004) 787–835
insulin sensitivity. Last, the obese diabetic group with a low insulin response
manifests the greatest glucose intolerance owing to the presence of marked
insulin deficiency without further worsening of insulin sensitivity (see Fig. 4).
The natural history of type 2 diabetes described above (see Fig. 4) is
consistent with that described by other investigators in humans and
monkeys [1,2,20,22–27,29,33–35,97–99,102,144–146]. In lean subjects spanning a wide range of glucose tolerance, Reaven et al [97] demonstrated that
the progression from normal glucose tolerance to IGT was signaled by the
development of severe insulin resistance, which was largely counterbalanced
by increased insulin secretion. Progression from IGT to type 2 diabetes was
associated with a marked decline in insulin secretion with no (or only slight)
further deterioration in tissue sensitivity to insulin (Fig. 11). A similar
sequence of events has been documented prospectively in Pima Indians,
Pacific Islanders, and rhesus monkeys.
In summary, insulin resistance is an early and characteristic feature of the
natural history of type 2 diabetes in high-risk populations. Overt diabetes
develops only when the beta cells are unable to appropriately augment their
secretion of insulin to compensate for the defect in insulin action. It should
be recognized, however, that there are well-described type 2 diabetic
populations in whom insulin sensitivity is normal at the onset of diabetes,
whereas insulin secretion is severely impaired. This insulinopenic variety of
type 2 diabetes appears to be more common in African Americans, elderly
subjects, and lean whites. In this latter group, it is important to exclude type
1 diabetes, because approximately 10% of white individuals with older onset
diabetes are islet cell antibody, or glutamic acid decarboxylase, positive.
Fig. 11. Insulin-mediated glucose clearance (measured with the insulin suppression test) and the
plasma insulin response (measured with an OGTT) in controls (top), in subjects with IGT
(bottom), and in type 2 diabetic individuals (top) with varying severity of glucose intolerance (see
text for a more detailed discussion). (Data from Reaven GM, Hollenbeck CB, Chen YDI.
Relationship between glucose tolerance, insulin secretion, and insulin action in non-obese
individuals with varying degrees of glucose tolerance. Diabetologia 1989;32:52–5.)
R.A. DeFronzo / Med Clin N Am 88 (2004) 787–835
811
Role of the adipocyte in the pathogenesis of type 2 diabetes mellitus: the
harmonious quartet
The majority (! 80%–90%) of type 2 diabetics in the United States are
overweight or obese [147]. Both lean and especially obese type 2 diabetics
are characterized by day-long elevation in plasma free fatty-acid concentration, which fails to suppress normally following ingestion of a mixed meal
or oral glucose load [30]. FFA are stored as triglycerides in adipocytes and
serve as an essential energy source during fasting conditions. Insulin is
a potent antilipolytic hormone and restrains the release of FFA from the
adipocyte by inhibiting the enzyme hormone-sensitive lipase [11,12]. The fat
cells of type 2 diabetics (and nondiabetic obese individuals) are markedly
resistant to the inhibitory effect of insulin on lipolysis. In the postabsorptive
state, the rate of lipolysis (as reflected by impaired suppression of
radioactive palmitate turnover) is increased despite plasma insulin levels
that are 2- to 4-fold elevated. Moreover, the ability of exogenous insulin to
inhibit the elevated basal rate of lipolysis and to reduce the plasma FFA
concentration is markedly impaired. Many studies have shown that
chronically elevated plasma FFA concentrations cause insulin resistance
in muscle and liver and impair insulin secretion (Fig. 12) [1,2,11,14,58,148–
152]. Thus, increased plasma FFA levels can cause or aggravate the three
major pathogenic disturbances that are responsible for impaired glucose
homeostasis in type 2 diabetic individuals, and the time has arrived for the
‘‘triumvirate’’ (muscle, liver, beta cell) to be joined by the ‘‘fourth
musketeer’’ [152] to form the ‘‘harmonious quartet’’ (Fig. 13) [11]. In
addition to the FFA that circulate in plasma in increased amounts, type 2
diabetic and obese nondiabetic individuals have increased stores of
triglycerides in muscle and liver, and the increased fat content correlates
closely with the presence of insulin resistance in these tissues [153–156].
Triglycerides in liver and muscle are in a state of constant turnover, and the
intracellular metabolites of triglycerides and FFA (ie, fatty acyl-CoA,
ceramides, and diacylglycerol) have been shown to impair insulin action
Fig. 12. Etiology of type 2 diabetes mellitus (T2DM). The deleterious effect of chronically
elevated plasma FFA concentrations on basal or insulin-suppressed rate of hepatic glucose
production, insulin-stimulated glucose uptake in muscle, and glucose-stimulated insulin
secretion.
812
R.A. DeFronzo / Med Clin N Am 88 (2004) 787–835
Fig. 13. Harmonious quartet. Insulin resistance in adipocytes, muscle, and liver in combination
with impaired insulin secretion by the pancreatic beta cells, represent the four major organ
system abnormalities that play a central role in the pathogenesis of type 2 diabetes mellitus.
in both liver and muscle [11,157–159]. Evidence also has accumulated to
implicate lipotoxicity as an important cause of beta-cell dysfunction (see
earlier discussion) [11,58,150,151]. The sequence of events whereby elevated
plasma FFA and increased lipid deposition in tissues cause insulin resistance
and promote beta-cell failure has been referred to as ‘‘lipotoxicity,’’ and
several recent in depth reviews of this subject have been published [11,58].
Cellular mechanisms of insulin resistance
The cellular events through which insulin initiates its stimulatory effect
on glucose metabolism start with binding of the hormone to specific
receptors that are present on the cell surface of all insulin target tissues
[2,160–162]. After insulin has bound to and activated its receptor, ‘‘second
messengers’’ are generated, and these second messengers activate a cascade
of phosphorylation-dephosphorylation reactions that eventually result in
the stimulation of intracellular glucose metabolism. The first step in glucose
use involves activation of the glucose transport system, leading to glucose
influx into insulin target tissues, primarily muscle. The free glucose, which
has entered the cell, subsequently is metabolized by a series of enzymatic
steps that are under the control of insulin. Of these, the most important are
glucose phosphorylation (catalyzed by hexokinase), glycogen synthase
(which controls glycogen synthesis), and phosphofructokinase (PFK) and
pyruvate dehydrogenase (PDH) (which regulate glycolysis and glucose
oxidation, respectively).
Insulin receptor/insulin receptor tyrosine kinase
The insulin receptor is a glycoprotein that consists of two a-subunits and
two b-subunits linked by disulfide bonds (Fig. 14) [2,160–162]. The two asubunits of the insulin receptor are entirely extracellular and contain the
insulin-binding domain. The b-subunits have an extracellular domain,
a transmembrane domain, and an intracellular domain that expresses
R.A. DeFronzo / Med Clin N Am 88 (2004) 787–835
813
Fig. 14. Insulin transduction system. Insulin receptor and the cascade of intracellular signaling
molecules that have been implicated in insulin action (see text for a more detailed discussion).
insulin-stimulated kinase activity directed toward its own tyrosine residues.
Phosphorylation of the b-subunit, with subsequent activation of insulin
receptor tyrosine kinase, represents the first step in the action of insulin on
glucose metabolism. Mutagenesis of any of the three major phosphorylation
sites (at residues 1158, 1163, and 1162) impairs insulin receptor kinase
activity, leading to a decrease in the metabolic and growth-promoting effects
of insulin [163,164].
Insulin receptor signal transduction
Following its activation, insulin receptor tyrosine kinase phosphorylates
specific intracellular proteins, of which at least nine have been identified
[160,165]. In muscle insulin-receptor substrate (IRS)-1 serves as the major
docking protein that interacts with the insulin receptor tyrosine kinase and
undergoes tyrosine phosphorylation in regions containing specific amino
acid sequence motifs that, when phosphorylated, serve as recognition sites
for proteins containing src-homology 2 (SH2) domains. Mutation of these
specific tyrosines severely impairs the ability of insulin to stimulate muscle
glycogen synthesis, glucose oxidation, and other acute metabolic- and
growth-promoting effects of insulin [164]. In liver, IRS-2 serves as the
primary docking protein that undergoes tyrosine phosphorylation and
mediates the effect of insulin on hepatic glucose production, gluconeogenesis, and glycogen formation [166].
In muscle, the phosphorylated tyrosine residues of IRS-1 mediate an
association with the 85-kDa regulatory subunit of phosphatidylinositol
3-kinase (PI3K), leading to activation of the enzyme (see Fig. 14) [160–
162,165,167]. PI3K is composed of an 85-kDa regulatory subunit and a 110kDa catalytic subunit. The latter catalyzes the 39 phosphorylation of PI
4-phosphate and PI 4,5-diphosphate, resulting in the stimulation of glucose
814
R.A. DeFronzo / Med Clin N Am 88 (2004) 787–835
transport. Activation of PI3K by phosphorylated IRS-1 also leads to
activation of glycogen synthase through a process that involves activation of
protein kinase B/Akt and subsequent inhibition of kinases, such as glycogen
synthase kinase-3, and activation of protein phosphatase 1 (PP1) (also called
glycogen synthase phosphatase, see later discussion). Inhibitors of PI3K
impair glucose transport and block the activation of glycogen synthase and
hexokinase (HK)-II expression [160–162,165,167–169]. The action of insulin
to increase protein synthesis and inhibit protein degradation also is
mediated by PI3K.
Other proteins with SH2 domains, including the adapter protein Grb2
and Shc, also interact with IRS-1 and become phosphorylated following
exposure to insulin [160–162,165]. Grb2 and Shc link IRS-1/IRS-2 to the
mitogen-activated protein kinase (MAPK)-signaling pathway (see Fig. 14),
which plays an important role in the generation of transcription factors and
promotes cell growth, proliferation, and differentiation [160,165]. Inhibition
of the MAPK kinase pathway prevents the stimulation of cell growth by
insulin but has no effect on the metabolic actions of the hormone [170].
Under anabolic conditions, insulin augments glycogen synthesis by
simultaneously activating glycogen synthase and inhibiting glycogen phosphorylase [171,172]. The effect of insulin is mediated through the PI3K
pathway, which inactivates kinases such as glycogen synthase kinase-3 and
activates phosphatases, particularly PP1. PP1 is believed to be the primary
regulator of glycogen metabolism. In skeletal muscle, PP1 associates with
a specific glycogen-binding regulatory subunit, causing dephosphorylation
(activation) of glycogen synthase. PP1 also phosphorylates (inactivates)
glycogen phosphorylase. The precise steps that link insulin receptor tyrosine
kinase/PI3K activation to stimulation of PP1 have yet to be defined. Studies
[160,173] have demonstrated convincingly that inhibitors of PI3K inhibit
glycogen synthase activity and abolish glycogen synthesis.
Insulin receptor signal transduction defects in type 2 diabetes
Insulin receptor number and affinity
Both receptor and postreceptor defects have been shown to contribute to
insulin resistance in individuals with type 2 diabetes mellitus. Some studies
have demonstrated a modest 20%–30% reduction in insulin binding to
monocytes and adipocytes from type 2 diabetic patients, but this has not
been a consistent finding [1,174–177]. The decrease in insulin binding is
caused by a reduction in the number of insulin receptors without change
in insulin receptor affinity. Some caution, however, should be used in
interpreting these studies because muscle and liver not adipocytes are the
major tissues responsible for the regulation of glucose homeostasis in vivo,
and insulin binding to solubilized receptors obtained from skeletal muscle
and liver has been shown to be normal in obese and lean diabetic individuals
[175,176,178]. Moreover, a decrease in insulin receptor number cannot be
R.A. DeFronzo / Med Clin N Am 88 (2004) 787–835
815
demonstrated in over half of type 2 diabetic subjects, and it has been difficult
to demonstrate a correlation between reduced insulin binding and the
severity of insulin resistance [179–181]. A variety of defects in insulin
receptor internalization and processing have been described in syndromes of
severe insulin resistance and diabetes. The insulin receptor gene, however,
has been sequenced in a large number of type 2 diabetic patients from
diverse ethnic populations and, with very rare exceptions, physiologically
significant mutations in the insulin receptor gene have not been observed
[182,183]. This excludes a structural gene abnormality in the insulin receptor
as a cause of common type 2 diabetes mellitus.
Insulin receptor tyrosine kinase activity
Insulin receptor tyrosine kinase activity has been examined in skeletal
muscle, adipocytes, and hepatocytes from normal-weight and obese diabetic
subjects. Most [1,175,176,179,184,185] but not all [178] investigators have
found a reduction in tyrosine kinase activity (Fig. 15) that cannot be explained
by alterations in insulin receptor number or insulin receptor binding affinity.
Restoration of normoglycemia by weight loss, however, has been shown to
correct the defect in insulin receptor tyrosine kinase activity [186], suggesting
that the defect in tyrosine kinase is acquired secondary to some combination of
hyperglycemia, distributed intracellular glucose metabolism, hyperinsulinemia, and insulin resistance, all of which improved after weight loss. Exposure
of cultured fibroblasts to high glucose concentration also has been shown to
Fig. 15. Insulin signaling cascade in T2DM. Effect of insulin on insulin receptor (top) and IRS1 tyrosine phosphorylation (bottom) and the association of IRS-1 with the p85 regulatory
subunit of PI3K and PI3K activity in muscle from T2DM and control (CON) subjects. Data are
expressed as percentages of the mean insulin-stimulated values in the control groups. Open bars,
basal state; filled bars, insulin-stimulated state; * P 0.05, T2DM versus CON.
816
R.A. DeFronzo / Med Clin N Am 88 (2004) 787–835
inhibit insulin receptor tyrosine kinase activity [187]. Because insulin receptor
tyrosine kinase activity assays are performed in vitro, the results of these
assays could provide misleading information with regard to insulin receptor
function in vivo. To circumvent this problem, investigators have used the
euglycemic hyperinsulinemic clamp with muscle biopsies and anti-phosphotyrosine immunoblot analysis to provide a ‘‘snap shot’’ of the insulinstimulated tyrosine phosphorylation state of the receptor in vivo [185]. In
insulin-resistant obese nondiabetic and type 2 diabetic subjects, a substantial
decrease in insulin receptor tyrosine phosphorylation has been demonstrated;
however, when insulin-stimulated insulin receptor tyrosine phosphorylation
was examined in normal-glucose-tolerant insulin-resistant individuals (offspring of two diabetic parents) at high risk for developing type 2 diabetes,
a normal increase in tyrosine phosphorylation of the insulin receptor was
observed [188]. These findings are consistent with the concept that impaired
insulin receptor tyrosine kinase activity in type 2 diabetic patients is acquired
secondary to hyperglycemia or some other metabolic disturbance.
Insulin-signaling (IRS-1 and PI3K) defects
In insulin-resistant obese nondiabetic subjects, the ability of insulin to
activate insulin receptor and IRS-1 tyrosine phosphorylation in muscle is
modestly reduced, whereas in type 2 diabetics insulin-stimulated insulin
receptor and IRS-1 tyrosine phosphorylation are severely impaired (see
Fig. 15) [185]. Association of the p85 subunit of PI3K with IRS-1 and
activation of PI3K also are greatly attenuated in obese nondiabetic and type
2 diabetic subjects compared with lean healthy controls (see Fig. 15)
[185,189,190]. The decrease in insulin-stimulated association of the p85
regulatory subunit of PI3K with IRS-1 is closely correlated with the
reduction in insulin-stimulated muscle glycogen synthase activity and in
vivo insulin-stimulated glucose disposal [185]. Impaired regulation of PI3K
gene expression by insulin also has been demonstrated in skeletal muscle
and adipose tissue of type 2 diabetic subjects [191]. In animal models of
diabetes, an 80%–90% decrease in insulin-stimulated IRS-1 phosphorylation and PI3K activity has been reported [192].
In the insulin-resistant, normal glucose tolerant offspring of two type 2
diabetic parents, IRS-1 tyrosine phosphorylation and the association of p85
protein/PI3K activity with IRS-1 are markedly decreased despite normal
tyrosine phosphorylation of the insulin receptor; these insulin signaling
defects are correlated closely with the severity of insulin resistance measured
with the euglycemic insulin clamp technique [188]. In summary, impaired
association of PI3K with IRS-1 and its subsequent activation are characteristic abnormalities in type 2 diabetics, and these defects are correlated
closely with in vivo muscle insulin resistance. A common mutation in the
IRS-1 gene (Gly-972-Arg) has been associated with type 2 diabetes, insulin
resistance, and obesity, but the physiologic significance of this mutation
remains to be established [193].
817
R.A. DeFronzo / Med Clin N Am 88 (2004) 787–835
Insulin resistance of the PI3K signaling pathway contrasts with an intact
stimulation of the MAPK pathway by insulin in insulin-resistant type 2
diabetic and obese nondiabetics individuals [185,189]. Physiologic
hyperinsulinemia increases mitogen-activated protein kinase/extracellular
signal-regulated kinase 1 activity (MEK-1) and extracellular signal-regulated
kinase1/2 phosphorylation activity (ERK) similarly in lean healthy subjects,
insulin-resistant obese nondiabetic, and type 2 diabetic patients. Intact
stimulation of the MAPK pathway by insulin in the presence of insulin
resistance in the PI3K pathway may play an important role in the development of atherosclerosis [185]. If the metabolic (PI3K) pathway is impaired,
plasma glucose levels rise, resulting in increased insulin secretion and hyperinsulinemia. Because insulin receptor function is normal or only modestly
impaired, especially early in the natural history of type 2 diabetes, this leads to
excessive stimulation of the MAPK (mitogenic) pathway in vascular tissues,
with resultant proliferation of vascular smooth muscle cells, increased
collagen formation, and increased production of growth factors and
inflammatory cytokines [194,195].
Glucose transport
Activation of the insulin signal transduction system in insulin target
tissues stimulates glucose transport through a mechanism that involves
translocation of a large intracellular pool of glucose transporters (associated
with low-density microsomes) to the plasma membrane and their subsequent
activation after insertion into the cell membrane [196,197]. There are five
major, different facilitative glucose transporters (GLUT) with distinctive
tissue distributions (Table 1) [198,199]. GLUT4, the insulin regulatable
transporter, is found in insulin-sensitive tissues (muscle and adipocytes), has
a Km of approximately 5 mmol/L, which is close to that of the plasma
glucose concentration, and is associated with HK-II [198,199]. In adipocytes
and muscle, GLUT4 concentration in the plasma membrane increases
markedly after exposure to insulin, and this increase is associated with
Table 1
Classification of glucose transport and HK activity according to their tissue distribution and
functional regulation
Organ
Glucose transporter
Hexokinase computer
Classification
Brain
Erythrocyte
Adipocyte
Muscle
Liver
Glucokinase beta cell
Gut
Kidney
GLUT1
GLUT1
GLUT4
GLUT4
GLUT2
GLUT2
GLUT3-symporter
GLUT3-symporter
HK-I
HK-I
HK-II
HK-II
HK-IVL
HK-IVB (glucokinase)
—
—
Glucose dependent
Glucose dependent
Insulin dependent
Insulin dependent
Glucose sensor
Glucose sensor
Sodium dependent
Sodium dependent
Data from DeFronzo RA. Pathogenesis of type 2 diabetes mellitus: metablic and molecular
implications for identifying diabetes genes. Diabetes 1997;5:177–269.
818
R.A. DeFronzo / Med Clin N Am 88 (2004) 787–835
a reciprocal decline in the intracellular GLUT4 pool. GLUT1 is the
predominant glucose transporter in the insulin-independent tissues (brain
and erythrocytes) but also is found in muscle and adipocytes. GLUT1 is
located primarily in the plasma membrane where its concentration is
unchanged following exposure to insulin. It has a low Km ($1 mmol/L)
and is well suited for its function, which is to mediate basal glucose uptake.
It is found in association with HK-I [200]. GLUT2 is the predominant
transporter in liver and pancreatic beta cells where it is found in association
with a specific hexokinase, HK-IV or glucokinase [201]. GLUT2 has a very
high Km ($15–20 mmol/L), which allows the glucose concentration in cells
expressing this transporter to increase in direct proportion to the increase in
plasma glucose concentration. This unique characteristic allows these cells
to function as glucose sensors.
In adipocytes and muscle of type 2 diabetic patients, glucose transport
activity is severely impaired [179,196,197,202–204]. In adipocytes from
human and rodent models of type 2 diabetes, GLUT4 mRNA and protein
content are markedly reduced, and the ability of insulin to elicit a normal
translocation response and to activate the GLUT4 transporter after insertion
into the cell membrane is decreased. In contrast to the adipocytes, muscle
tissue from lean and obese type 2 diabetic subjects exhibits normal or
increased levels of GLUT4 mRNA expression and normal levels of GLUT4
protein, thus demonstrating that transcriptional and translational regulation
of GLUT4 is not impaired [205,206]. In contrast to the normal expression of
GLUT4 protein and mRNA in muscle of type 2 diabetic subjects, every study
that has examined adipose tissue has reported reduced basal and insulinstimulated GLUT4 mRNA levels and decreased GLUT4 transporter number
in all subcellular fractions. These observations demonstrate that GLUT4
expression in humans is subject to tissue-specific regulation. Using a novel
triple-tracer technique, the in vivo dose-response curve for the action of
insulin on glucose transport in forearm skeletal muscle has been examined in
type 2 diabetic subjects, and insulin-stimulated inward muscle glucose
transport has been shown to be severely impaired [207,208]. Impaired in
vivo muscle glucose transport in type 2 diabetics also has been demonstrated
using magnetic resonance imaging [209] and positron emission tomography
[210]. Because the number of GLUT4 transporters in the muscle of diabetic
subjects is normal, impaired GLUT4 translocation and decreased intrinsic
activity of the glucose transporter must be responsible for the defect in muscle
glucose transport. Large populations of type 2 diabetics have been screened
for mutations in the GLUT4 gene [211]. Such mutations are very uncommon
and, when detected, have been of questionable physiologic significance.
Glucose phosphorylation
Glucose phosphorylation and glucose transport are tightly coupled
phenomena [212]. Hexokinase isoenzymes (HK-I–IV) catalyze the first
R.A. DeFronzo / Med Clin N Am 88 (2004) 787–835
819
committed step of glucose metabolism, the intracellular conversion of free
glucose to glucose-6-phosphate (Glu-6-P) (see Table 1) [198–200,213]. HK-I,
HK-II, and HK-III are single-chain peptides that have a very high affinity
for glucose and demonstrate product inhibition by Glu-6-P. HK-IV, also
called glucokinase, has a lower affinity for glucose and is not inhibited by
Glu-6-P. Glucokinase (HK-IVB) represents the glucose sensor in the beta
cell, whereas HK-IVL plays a central role in the regulation of hepatic
glucose metabolism.
In human skeletal muscle, HK-II transcription is regulated by insulin,
whereas HK-I mRNA and protein levels are not affected by insulin [214–
216]. In response to physiologic euglycemic hyperinsulinemia of 2 to 4
hours’ duration, HK-II cytosolic activity, protein content, and mRNA levels
increase by 50% to 200% in healthy nondiabetic subjects, and this is
associated with the translocation of hexokinase II from the cytosol to the
mitochondria. In forearm muscle, insulin-stimulated glucose transport
(measured with the triple-tracer technique) is markedly impaired in lean
type 2 diabetics [207,208], but the rate of intracellular glucose phosphorylation is impaired to an even greater extent, resulting in an increase in the
free glucose concentration within the intracellular space that is accessible to
glucose. These observations indicate that in type 2 diabetic individuals,
although both glucose transport and glucose phosphorylation are severely
resistant to the action of insulin, impaired glucose phosphorylation (HK-II)
appears to be the rate-limiting step for insulin action. Studies using 31P
nuclear magnetic resonance in combination with [1-14C]glucose also have
demonstrated that both insulin-stimulated muscle glucose transport and
glucose phosphorylation are impaired in type 2 diabetic subjects, but the
defect in transport exceeds the defect in phosphorylation [209]. Because of
methodologic differences, the results of the triple-tracer technique [207,208]
and magnetic resonance imaging [209] studies cannot be reconciled at
present. Nonetheless, these studies are consistent in demonstrating that
abnormalities in both muscle glucose phosphorylation and glucose transport
are well established early in the natural history of type 2 diabetes and cannot
be explained by glucose toxicity.
In healthy nondiabetic subjects, a physiologic increase in the plasma
insulin concentration for as little as 2 to 4 hours increases muscle HK-II
activity, gene transcription, and translation [214]. In lean type 2 diabetics, the
ability of insulin to augment HK-II activity and mRNA levels are markedly
reduced compared with controls [215]. Decreased basal muscle HK-II activity
and mRNA levels and impaired insulin-stimulated HK-II activity in type 2
diabetic subjects have been reported by other investigators [216,217]. A
decrease in insulin-stimulated muscle HK-II activity also has been described
in subjects with IGT [218]. Several groups have looked for point mutations in
the HK-II gene in individuals with type 2 diabetes, and, although several
nucleotide substitutions have been found, none are close to the glucose and
ATP binding sites and none have been associated with insulin resistance
820
R.A. DeFronzo / Med Clin N Am 88 (2004) 787–835
[218–220]. Thus, an abnormality in the HK-II gene is unlikely to explain the
inherited insulin resistance in common variety type 2 diabetes mellitus.
Glycogen synthesis
Following phosphorylation by hexokinase II, glucose either can be
converted to glycogen or enter the glycolytic pathway. Of the glucose that
enters the glycolytic pathway, approximately 90% is oxidized, and the
remaining 10% is released as lactate. At low physiologic plasma insulin
concentrations, glycogen synthesis and glucose oxidation contribute equally
to glucose disposal; however, with increasing plasma insulin concentrations,
glycogen synthesis predominates [1,2,221]. Impaired insulin-stimulated
glycogen synthesis is a characteristic finding in all insulin-resistant states,
including obesity, IGT, diabetes, and diabesity in all ethnic groups, and
accounts for the majority of the defect in insulin-mediated whole-body
glucose disposal [1,2,12,98,210,222–224]. Impaired glycogen synthesis also
has been documented in the normal-glucose tolerant offspring of two
diabetic parents, in the first-degree relatives of type 2 diabetic individuals,
and in the normoglycemic twin of a monozygotic twin pair in which the
other twin has type 2 diabetes [65,98,225].
Glycogen synthase is the key insulin-regulated enzyme that controls the
rate of muscle glycogen synthesis [171,173,216, 226–228]. Insulin activates
glycogen synthase by stimulating a cascade of phosphorylation-dephosphorylation reactions (see above discussion of insulin receptor signal
transduction), which ultimately lead to the activation of PP1 (also called
glycogen synthase phosphatase). The regulatory subunit of PP1 has two
serine phosphorylation sites, called site 1 and site 2. Phosphorylation of site
2 by cAMP-dependent protein kinase inactivates PP1, whereas phosphorylation of site 1 by insulin activates PP1, leading to the stimulation of
glycogen synthase. Phosphorylation of site 1 of PP1 by insulin in muscle is
catalyzed by insulin-stimulated protein kinase (ISPK)-1. Because of their
central role in muscle glycogen formation, the three enzymes, glycogen
synthase, PP1, and ISPK-1, have been extensively studied in individuals
with type 2 diabetes.
Glycogen synthase exists in an active (dephosphorylated) and an inactive
(phosphorylated) form [171–173]. Under basal conditions, total glycogen
synthase activity in type 2 diabetic subjects is reduced, and the ability of
insulin to activate glycogen synthase is severely impaired [185,229–231]. The
ability of insulin to stimulate glycogen synthase also is diminished in the
normal glucose-tolerant, insulin-resistant relatives of type 2 diabetic
individuals [232]. In insulin-resistant nondiabetic and diabetic Pima Indians,
activation of muscle PP1 (glycogen synthase phosphatase) by insulin is
severely reduced [233]. Because PP1 dephosphorylates glycogen synthase,
leading to its activation, a defect in PP1 appears to play an important role in
the muscle insulin resistance of type 2 diabetes mellitus.
R.A. DeFronzo / Med Clin N Am 88 (2004) 787–835
821
The effect of insulin on glycogen synthase gene transcription and translation in vivo has been studied extensively. Most studies have demonstrated
that insulin does not increase glycogen synthase mRNA or protein expression
in human muscle [214,234,235]. Glycogen synthase mRNA and protein
levels, however, are decreased in muscle of type 2 diabetic patients, partly
explaining the decreased glycogen synthase activity [235,236]. The major
abnormality in glycogen synthase regulation in type 2 diabetes is its lack of
dephosphorylation and activation by insulin, as a result of insulin receptor
signaling abnormalities (see previous discussion).
The glycogen synthase gene has been the subject of intensive investigation,
and DNA sequencing has revealed either no mutations or rare nucleotide
substitutions that cannot explain the defect in insulin-stimulated glycogen
synthase activity [237–239]. The genes encoding the catalytic subunits of PP1
and ISPK-1 have been examined in Pima Indians and Danes with type 2
diabetes [240,241]. Several silent nucleotide substitutions were found in the
PP1 and ISPK-1 genes in the Danish population, but the mRNA levels of
both genes were normal in skeletal muscle. No structural gene abnormalities
in the catalytic subunit of PP1 were detected in Pima Indians. Thus, neither
mutations in the PP1 and ISPK-1 genes nor abnormalities in their translation
can explain the impaired enzymatic activities of glycogen synthase and PP1
that have been observed in vivo. Similarly, there is no evidence that an
alteration in glycogen phosphorylase plays any role in the abnormality in
glycogen formation in type 2 diabetes [242].
In summary, glycogen synthase activity is severely impaired in type 2
diabetic individuals, and the molecular cause of the defect most likely is
related to impaired insulin signal transduction.
Glycolysis/Glucose oxidation
Glucose oxidation accounts for approximately 90% of total glycolytic
flux, whereas anaerobic glycolysis accounts for the other 10%. The two
enzymes PFK and PDH play pivotal roles in the regulation of glycolysis and
glucose oxidation, respectively. In type 2 diabetic individuals, the glycolytic/
glucose oxidative pathway has been shown to be impaired [243]. Although
one study [244] has suggested that PFK activity is modestly reduced in
muscle biopsies from type 2 diabetic subjects, most evidence indicates that
the activity of PFK is normal [230,235]. Insulin has no effect on muscle PFK
activity, mRNA levels, or protein content in either nondiabetic or diabetic
individuals [235]. PDH is a key insulin-regulated enzyme with activity in
muscle that is acutely stimulated by insulin [245]. In type 2 diabetic patients,
insulin-stimulated PDH activity has been shown to be decreased in human
adipocytes and in skeletal muscle [245,246].
Obesity and type 2 diabetes mellitus are associated with accelerated FFA
turnover and oxidation [1,2,12,247], which would be expected, according to
the Randle cycle [248], to inhibit PDH activity and consequently glucose
822
R.A. DeFronzo / Med Clin N Am 88 (2004) 787–835
oxidation. Therefore, it is likely that the observed defects in glucose oxidation
and PDH activity are acquired secondary to increased FFA oxidation and
feedback inhibition of PDH by elevated intracellular levels of acetyl-CoA and
reduced availability of NAD. Consistent with this scenario, the rates of basal
and insulin-stimulated glucose oxidation are not reduced in the normal
glucose-tolerant offspring of two diabetic parents and in the first-degree
relatives of type 2 diabetic subjects, whereas it is decreased in overtly diabetic
subjects.
Summary
In summary, postbinding defects in insulin action primarily are responsible for the insulin resistance in type 2 diabetes. Diminished insulin
binding, when present, is modest and secondary to down-regulation of the
insulin receptor by chronic hyperinsulinemia. In type 2 diabetic patients
with overt fasting hyperglycemia, a number of postbinding defects have
been demonstrated, including reduced insulin receptor tyrosine kinase
activity, insulin signal transduction abnormalities, decreased glucose transport, diminished glucose phosphorylation, and impaired glycogen synthase
activity. The glycolytic/glucose oxidative pathway is largely intact and,
when defects are observed, they appear to be acquired secondary to
enhanced FFA/lipid oxidation. From the quantitative standpoint, impaired
glycogen synthesis represents the major pathway responsible for the insulin
resistance in type 2 diabetes and is present long before the onset of overt
diabetes, that is, in normal glucose-tolerant, insulin-resistant prediabetic
subjects and in individuals with IGT. Recent studies link the impairment
in glycogen synthase activation to a defect in the ability of insulin to
phosphorylate IRS-1, causing a reduced association of the p85 subunit of PI
3-kinase with IRS-1 and decreased activation of the enzyme PI3K.
References
[1] DeFronzo RA. Pathogenesis of type 2 diabetes mellitus: metabolic and molecular
implications for identifying diabetes genes. Diabetes 1997;5:177–269.
[2] DeFronzo RA. Lecture Lilly. The triumvirate: beta cell, muscle, liver. A collusion
responsible for NIDDM. Diabetes 1988;37:667–87.
[3] DeFronzo RA, Jacot E, Jequier E, Maeder E, Wahren J, Felber JP. The effect of insulin
on the disposal of intravenous glucose: results from indirect calorimetry. Diabetes 1981;
30:1000–7.
[4] DeFronzo RA, Ferrannini E. Regulation of hepatic glucose metabolism in humans.
Diabetes Metab Rev 1987;3:415–59.
[5] DeFronzo RA, Gunnarsson R, Bjorkman O, Olsson M, Wahren J. Effects of insulin on
peripheral and splanchnic glucose metabolism in non-insulin dependent diabetes mellitus.
J Clin Invest 1985;76:149–55.
[6] Mari A, Wahren J, DeFronzo RA, Ferrannini E. Glucose absorption and production
following oral glucose: comparison of compartmental and arteriovenous-difference
methods. Metabolism 1994;43:1419–25.
R.A. DeFronzo / Med Clin N Am 88 (2004) 787–835
823
[7] Mandarino L, Bonadonna R, McGuinness O, Wasserman D. Regulation of muscle
glucose uptake in vivo. In: Jefferson LS, Cherrington AD, editors. Handbook of
physiology. The endocrine system, vol. II The endocrine pancreas and regulation of
metabolism. Oxford: Oxford University Press; 2001. p. 803–48.
[8] Mitrakou A, Kelley D, Veneman T, Jensen T, Pangburn T, Reilly J, et al. Contribution of
abnormal muscle and liver glucose metabolism to postprandial hyperglycemia in NIDDM.
Diabetes 1990;39:1381–90.
[9] Cherrington AD. Control of glucose uptake and release by the liver in vivo. Diabetes
1999;48:1198–214.
[10] Grill V. A comparison of brain glucose metabolism in diabetes as measured by positron
emission tomography or by arteriovenous techniques. Ann Med 1990;22:171–5.
[11] Bays H, Mandarino L, DeFronzo RA. Role of the adipocyte, free fatty acids, and ectopic
fat in pathogenesis of type 2 diabetes mellitus: peroxisomal proliferator-activated receptor
agonsits provide a rational therapeutic approach. J Clin Endocrinol Metab 2004;89:
463–78.
[12] Groop LC, Bonadonna RC, Del Prato S, Ratheiser K, Zych K, Ferrannini E, DeFronzo
RA. Glucose and free fatty acid metabolism in non-insulin dependent diabetes mellitus.
Evidence for multiple sites of insulin resistance. J Clin Invest 1989;84:205–15.
[13] Bergman RN. Non-esterified fatty acids and the liver: why is insulin secreted into the
portal vein? Diabetologia 2000;43:946–52.
[14] Boden G. Role of fatty acids in the pathogenesis of insulin resistance and NIDDM.
Diabetes 1997;46:3–10.
[15] Baron AD, Schaeffer L, Shragg P, Kolterman OG. Role of hyperglucagonemia in
maintenance of increased rates of hepatic glucose output in type II diabetics. Diabetes
1987;36:274–83.
[16] DeFronzo RA, Ferrannini E, Hendler R, Wahren J, Felig P. Influence of hyperinsulinemia, hyperglycemia, and the route of glucose administration on splanchnic
glucose exchange. Proc Natl Acad Sci USA 1978;75:5173–7.
[17] Ferrannini E, Wahren J, Felig P, DeFronzo RA. Role of fractional glucose extraction in
the regulation of splanchnic glucose metabolism in normal and diabetic man. Metabolism
1980;29:28–35.
[18] Drucker DJ. Glucagon-like peptides. Diabetes 1998;47:159–69.
[19] Holst JJ, Gromada J, Nauck MA. The pathogenesis of NIDDM involves a defective
expression of the GIP receptor. Diabetologia 1997;40:984–6.
[20] Polonsky KS, Sturis J, Bell GI. Non-insulin-dependent diabetes mellitus: a genetically
programmed failure of the beta cell to compensate for insulin resistance. N Engl J Med
1996;334:777–83.
[21] Cerasi E. Insulin deficiency and insulin resistance in the pathogenesis of NIDDM: is
a divorce possible? Diabetologia 1995;38:992–7.
[22] Sicree RA, Zimmet P, King HO, Coventry JO. Plasma insulin response among Nauruans.
Prediction of deterioration in glucose tolerance over 6 years. Diabetes 1987;36:179–86.
[23] Saad MF, Knowler WC, Pettitt DJ, Nelson RG, Mott DM, Bennett PH. Sequential
changes in serum insulin concentration during development of non-insulin-dependent
diabetes. Lancet 1989;i:1356–9.
[24] Saad MF, Knowler WC, Pettitt DJ, Nelson RG, Mott DM, Bennett PH. The natural
history of impaired glucose tolerance in the Pima Indians. N Engl J Med 1988;319:
1500–5.
[25] Haffner SM, Miettinen H, Gaskill SP, Stern MP. Decreased insulin secretion and
increased insulin resistance are independently related to the 7-year risk of NIDDM in
Mexican-Americans. Diabetes 1995;44:1386–91.
[26] Weyer C, Hanson RL, Tataranni PA, Bogardus C, Pratley RE. A high fasting plasma
insulin concentration predicts type 2 diabetes independent of insulin resistance. Evidence
for a pathogenic role of relative hyperinsulinemia. Diabetes 2000;49:2094–101.
824
R.A. DeFronzo / Med Clin N Am 88 (2004) 787–835
[27] Weyer C, Tataranni PA, Bogardus C, Pratley RE. Insulin resistance and insulin secretory
dysfunction are independent predictors of worsening of glucose tolerance during each
stage of type 2 diabetes development. Diabetes Care 2000;24:89–94.
[28] Pimenta W, Korytkowski M, Mitrakou A, Jenssen T, Yki-Jarvinen H, Evron W, et al.
Pancreatic beta-cell dysfunction as the primary genetic lesion in NIDDM. Evidence from
studies in normal glucose-tolerant individuals with a first degree NIDDM relative. JAMA
1995;273:1855–61.
[29] Eriksson J, Franssila-Kallunki A, Ekstrand A, Saloranta C, Widen E, Schalin C, et al. Early
metabolic defects in persons at increased risk for non-insulin-dependent diabetes mellitus.
N Engl J Med 1989;321:337–43.
[30] Reaven GM, Hollenbeck C, Jeng C-Y, Wu MS, Chen Y-DI. Measurement of plasma
glucose, free fatty acid, lactate, and insulin for 24 hours in patients with NIDDM. Diabetes
1988;37:1020–4.
[31] Garvey WT, Olefsky JM, Rubenstein AH, Kolterman OG. Day-long integrated urinary
C-peptide excretion. Diabetes 1988;37:590–9.
[32] Gastaldelli A, Ferrannini E, Miyazaki Y, Matsuda M, DeFronzo RA. Beta-cell
dysfunction and glucose intolerance: results from the San Antonio metabolism (SAM)
study. Diabetologia 2004;47:31–9.
[33] Hansen BC, Bodkin NH. Heterogeneity of insulin responses: phases leading to type 2
(noninsulin-dependent) diabetes mellitus in the rhesus monkey. Diabetologia 1986;29:
713–9.
[34] Kahn SE. Clinical Review 135. The importance of b-cell failure in the development and
progression of type 2 diabetes. J Clin Endocrinol Metab 2001;86:4047–58.
[35] Bergman RN, Finegood DT, Kahn SE. The evolution of b-cell dysfunction and insulin
resistance in type 2 diabetes. Eur J Clin Invest 2002;32:35–45.
[36] Polonsky KS. Lilly Lecture 1994. The beta cell in diabetes: from molecular genetics to
clinical research. Diabetes 1995;44:705–17.
[37] Bell GI, Polonsky KS. Diabetes mellitus and genetically programmed defects in b-cell
function. Nature 2001;414:788–91.
[38] McCarthy MI, Froguel P. Genetic approaches to the molecular understanding of type 2
diabetes. Am J Physiol 2002;283:E217–25.
[39] Bell GI, Zian K, Newman M, Wu S, Wright L, Fajans S, Spielman RS, Cox NJ. Gene for
non-insulin-dependent diabetes mellitus (maturity-onset diabetes of the young subtype) is
linked to DNA polymorphism on human chromosome 20q. Proc Natl Acad Sci USA
1991;88:1484–8.
[40] Froguel PH, Zouali H, Vionnet N, Velho G, Vaxillaire M, Sun F, et al. Familial
hyperglycaemia due to mutations in glucokinase: definition of a subtype of diabetes
mellitus. N Engl J Med 1993;328:697–702.
[41] Beck-Nielsen H, Nielsen OH, Pedersen O, Bak J, Faber O, Schmitz O. Insulin action and
insulin secretion in identical twins with MODY: evidence for defects in both insulin action
and insulin secretion. Diabetes 1988;37:730–5.
[42] Mohan V, Sharp PS, Aber VR, Mather HM, Kohner EM. Insulin resistance in maturityonset diabetes of the young. Diabetes Metab 1988;13:193–7.
[43] Elbein SC, Hoffman M, Qin H, Chiu K, Tanizawa Y, Permutt MA. Molecular screening
of the glucokinase gene in familial type 2 (non-insulin-dependent) diabetes mellitus.
Diabetologia 1994;37:182–7.
[44] Efendic S, Grill V, Luft R, Wajngot A. Low insulin response: a marker of pre-diabetes.
Adv Exp Med Biol 1988;246:167–74.
[45] Davies MJ, Metcalfe J, Gray IP, Day JL, Hales CN. Insulin deficiency rather than
hyperinsulinaemia in newly diagnosed type 2 diabetes mellitus. Diabet Med 1993;10:
305–12.
[46] Chen K-W, Boyko EJ, Bergstrom RW, Leonetti DL, Newell-Morris L, Wahl PW, et al.
Earlier appearance of impaired insulin secretion than of visceral adiposity in the
R.A. DeFronzo / Med Clin N Am 88 (2004) 787–835
[47]
[48]
[49]
[50]
[51]
[52]
[53]
[54]
[55]
[56]
[57]
[58]
[59]
[60]
[61]
[62]
[63]
[64]
[65]
[66]
[67]
825
pathogenesis of NIDDM. 5-year follow-up of initially nondiabetic Japanese-American
men. Diabetes Care 1995;18:747–53.
Arner P, Pollare T, Lithell H. Different etiologies of Type 2 (non-insulin-dependent)
diabetes mellitus in obese and non-obese subjects. Diabetologia 1991;34:483–7.
Ferrannini E, Natali A, Bell P, Cavallo-Perin P, Lalic N, Mingrone G. Insulin resistance
and hypersecretion in obesity. European Group for the Study of Insulin Resistance
(EGIR). J Clin Invest 1997;100:1166–73.
Banjeri MA, Lebovitz HE. Insulin action in black Americans with NIDDM. Diabetes
Care 1992;15:1295–302.
Mbanya J-CN, Pani LN, Mbanya DNS, Sobngwi E, Ngogang J. Reduced insulin
secretion in offspring of African type 2 diabetic patients. Diabetes Care 2000;23:1761–5.
DeFronzo RA, Tobin JD, Andres R. Glucose clamp technique: a method for quantifying
insulin secretion and resistance. Am J Physiol 1979;6:E214–23.
Hales CN. The pathogenesis of NIDDM. Diabetologia 1994;37:S162–8.
Brunzell JD, Robertson RP, Lerner RL, Hazzard WR, Ensinck JW, Bierman EL, et al.
Relationships between fasting plasma glucose levels and insulin secretion during
intravenous glucose tolerance tests. J Clin Endocrinol 1976;46:222–9.
Vague P, Moulin J-P. The defective glucose sensitivity of the B cell in insulin dependent
diabetes. Improvement after twenty hours of normoglycaemia. Metabolism 1982;31:
139–42.
Kosaka K, Kuzuya T, Akanuma Y, Hagura R. Increase in insulin response after
treatment of overt maturity onset diabetes mellitus is independent of the mode of
treatment. Diabetologia 1980;18:23–8.
Rossetti L, Giaccari A, DeFronzo RA. Glucose toxicity. Diabetes Care 1990;13:610–30.
Unger RH. Lipotoxicity in the pathogenesis of obesity-dependent NIDDM. Genetic and
clinical implications. Diabetes 1995;44:863–70.
McGarry JD. Banting lecture 2001: dysregulation of fatty acid metabolism in the etiology
of type 2 diabetes. Diabetes 2002;51:7–18.
Shimabukuro M, Zhou Y-T, Levi M, Unger RH. Fatty acid induced b cell apoptosis:
a link between obesity and diabetes. Proc Natl Acad Sci USA 1998;95:2498–502.
Bruce DG, Chisholm DJ, Storlien LH, Kraegen EW. Physiological importance of
deficiency in early prandial insulin secretion in non-insulin dependent diabetes. Diabetes
1988;37:736–44.
Luzi L. Effect of the loss of first phase insulin secretion on glucose production and
disposal in man. Am J Physiol 1989;257:E241–6.
Bonner-Weir S. b-cell turnover. Its assessment and implications. Diabetes 2001;50:S20–4.
Gautier J-F, Wilson C, Weyer C, Mott D, Knowler WC, Cavaghan M, et al. Low acute
insulin secretory responses in adult offspring of people with early onset type 2 diabetes.
Diabetes 2001;50:1828–33.
Vauhkonen N, Niskanen L, Vanninen E, Kainulainen S, Uusitupa M, Laakso M. Defects
in insulin secretion and insulin action in non-insulin-dependent diabetes mellitus are
inherited. Metabolic studies on offspring of diabetic probands. J Clin Invest 1997;100:
86–96.
Vaag A, Henriksen JE, Madsbad S, Holm N, Beck-Nielsen H. Insulin secretion, insulin
action, and hepatic glucose production in identical twins discordant for non-insulindependent diabetes mellitus. J Clin Invest 1995;95:690–8.
Barnett AH, Spilipoulos AJ, Pyke DA, Stubbs WA, Burrin J, Alberti KGMM. Metabolic
studies in unaffected co-twins of non-insulin-dependent diabetics. BMJ 1981;282:1656–8.
Watanabe RM, Valle T, Hauser ER, Ghosh S, Eriksson J, Kohtamaki K, Ehnholm C,
Tuomilehto J, Collins FS, Bergman RN, Boehnke M. Familiality of quantitative metabolic
traits in Finnish families with non-insulin-dependent diabetes mellitus. Finland-United
States Investigation of NIDDM Genetics (FUSION) Study investigators. Hum Hered
1999;49(3):159–68.
826
R.A. DeFronzo / Med Clin N Am 88 (2004) 787–835
[68] Rossetti L, Shulman Gi, Zawalich W, DeFronzo RA. Effect of chronic hyperglycemia on
in vivo insulin secretion in partially pancreatectomized rats. J Clin Invest 1987;80:
1037–44.
[69] Leahy JL, Bonner-Weir S, Weir GC. Minimal chronic hyperglycemia is a critical
determinant of impaired insulin secretion after an incomplete pancreatectomy. J Clin
Invest 1988;81:1407–14.
[70] Leahy JL, Cooper HE, Weir GC. Impaired insulin secretion associated with near
normoglycemia. Diabetes 1987;36:459–64.
[71] Robertson RP, Olson IK, Zhang H-J. Differentiating glucose toxicity from glucose
desensitization: a new message from the insulin gene. Diabetes 1994;43:1085–9.
[72] Prentki M, Corkey BE. Are the beta cell signaling molecules malonyl-CoA and cytosolic
long-chain acyl-CoA implicated in multiple tissue defects of obesity and NIDDM?
Diabetes 1996;45:273–83.
[73] Creutzfeldt W. The incretin concept today. Diabetologia 1979;16:75–85.
[74] Drucker DJ. The glucagon-like peptides. Endocrinology [minireview] 2001;142:521–7.
[75] Nauck MA, Bartels E, Orskov C, Ebert R, Creutzfeldt W. Additive insulinotropic effects
of exogenous synthetic human gastric inhibitory polypeptide and glucagon-like peptide-1(7–36) amide infused at near-physiological insulinotropic hormone and glucose
concentrations. J Clin Endocrinol Metab 1993;76:912–7.
[76] Vilsboll T, Krarup T, Deacon CF, Madsbad S, Holst JJ. Reduced postprandial
concentrations of intact biologically active glucagon-like peptide 1 in type 2 diabetic
patients. Diabetes 2001;50:609–13.
[77] Ahren B, Larsson H, Holst JJ. Effects of glucagon-like peptide-1 on islet function and
insulin sensitivity in noninsulin-dependent diabetes mellitus. J Clin Endocrinol Metab
1997;82:473–8.
[78] D’Alessio DA, Vogel R, Prigeon R, Laschansky E, Koerker D, Eng J, Ensinck JW.
Elimination of the action of glucagon-like peptide 1 causes an impairment of glucose
tolerance after nutrient ingestion by healthy baboons. J Clin Invest 1996;97:133–8.
[79] Nanauck MA, Kleine N, Orskov C, Holst JJ, Willms B, Creutzfeldt W. Normalization of
fasting hyperglycaemia by exogenous glucagon-like peptide 1 (7–36 amide) in type 2 (noninsulin-dependent) diabetic patients. Diabetologia 1993;36:741–4.
[80] Xu G, Stoffers DA, Habener JF, Bonner-Weir S. Exendin-4 stimulates both beta-cell
replication and neogenesis, resulting in increased beta-cell mass and improved glucose
tolerance in diabetic rats. Diabetes 1999;48:2270–6.
[81] Kahn SE, Andrikopoulos S, Verchere CB. Islet amyloid. A long-recognized but
underappreciated pathological feature of type 2 diabetes. Diabetes 1999;48:241–53.
[82] Johnson KH, O’Brien TD, Betysholtz C, Westermark P. Islet amyloid, islet-amyloid
polypeptide, and diabetes mellitus. N Engl J Med 1989;321:513–8.
[83] Howard CF. Longitudinal studies on the development of diabetes in individual Macaca
nigra. Diabetologia 1986;29:301–6.
[84] Bretherton-Watt D, Gilbey SG, Ghatei MA, Beacham J, Bloom SR. Failure to establish
islet amyloid polypeptide (amylin) as a circulating beta cell inhibiting hormone in man.
Diabetologia 1990;33:115–7.
[85] Hoppener JWM, Verbeek JS, de Koning EJP, Oosterwijk C, van Hulst KL, VisserVernooy HJ, et al. Chronic overproduction of islet amyloid polypeptide-amylin in
transgenic mice: lysosomal localization of human islet amyloid polypeptide and lack of
marked hyperglycaemia or hyperinsulinaemia. Diabetologia 1993;36:1258–65.
[86] Gebre-Medhin S, Olofsson C, Mulder H. Islet amyloid polypeptide in the islets of
Langerhans: friend or foe? Diabetologia 2000;43:687–95.
[87] Gepts W, Lecompte PM. The pancreatic islets in diabetes. Am J Med 1981;70:105–14.
[88] Kloppel G, Lohr M, Habich K, Oberholzer M, Heitz PU. Islet pathology and the
pathogenesis of type I and type 2 diabetes mellitus revisited. Surv Synth Path Res 1985;4:
110–25.
R.A. DeFronzo / Med Clin N Am 88 (2004) 787–835
827
[89] Clark A, Wells CA, Buley ID, Cruickshank JK, Vanhegan RI, Matthews DR, et al. Islet
amyloid, increased alpha-cells, reduced beta-cells and exocrine fibrosis: quantitative
changes in the pancreas in type 2 diabetes. Diabetes Res 1988;9:151–9.
[90] Butler AE, Janson J, Bonner-Weir S, Ritzel RA, Butler PC. Beta-cell deficit and increased
beta-cell apoptosis in humans with type 2 diabetes. Diabetes 2003;52:102–10.
[91] Stefan Y, Orci L, Malaisse-Lagae F, Perrelet A, Patel Y, Unger R. Quantitation of
endocrine cell content in the pancreas of non-diabetic and diabetic humans. Diabetes
1982;31:694–700.
[92] Rahier J, Sempoux C, Moulin P, Guiot Y. No decrease of the B cell mass in type 2
diabetic patients. Diabetologia 2000;43(Suppl 1):A65.
[93] Janson J, Butler AE, Bonner-Weir S, Ritzel RA, Sultana C, Butler PC. Failure of
compensatory increase in new islet formation in humans with type-2 diabetes mellitus.
Diabetes 2002;51(Suppl 2):A377.
[94] Finegood DT, McArthur D, Kojwang M, Thomas J, Topp BG, Leonard T, et al. b-cell
mass dynamics in Zucker diabetic fatty rats: rosiglitazone prevents the rise in net cell
death. Diabetes 2000;50:1021–9.
[95] Eriksson UJ. Lifelong consequences of metabolic adaptations in utero? Diabetologia
1996;39:1123–5.
[96] Phillips DIW. Insulin resistance as a programmed response to fetal under nutrition.
Diabetologia 1996;39:1119–22.
[97] Reaven GM, Hollenbeck CB, Chen YDI. Relationship between glucose tolerance, insulin
secretion, and insulin action in non-obese individuals with varying degrees of glucose
tolerance. Diabetologia 1989;32:52–5.
[98] Gulli G, Ferrannini E, Stern M, Haffner S, DeFronzo RA. The metabolic profile of
NIDDM is fully established in glucose-tolerant offspring of two Mexican-American
NIDDM parents. Diabetes 1992;41:1575–86.
[99] Martin BC, Warram JH, Krolewski AS, Bergman RN, Soeldner JS, Kahn RC. Role of
glucose and insulin resistance in development of type 2 diabetes mellitus: results of a
25-year follow-up study. Lancet 1992;340:925–9.
[100] Hara H, Egusa G Yamakido M, Kawate R. The high prevalence of diabetes mellitus and
hyperinsulinemia among the Japanese-Americans living in Hawaii and Los Angeles.
Diabetes Res Clin Pract 1994;24(Suppl 1):S37–42.
[101] Lillioja S, Nyomba BL, Saad MF, Ferraro R, Castillo C, Bennett PH, et al.
Exaggerated early insulin release and insulin resistance in a diabetes-prone population:
a metabolic comparison of Pima Indians and Caucasians. J Clin Endocrinol Metab
1991;73:866–76.
[102] Lillioja S, Mott DM, Howard BV, Bennett PH, Yki-Jarvinen H, Freymond D, Nyomba
BL, Zurlo F, Swinburn B, Bogardus C. Impaired glucose tolerance as a disorder of insulin
action. Longitudinal and cross-sectional studies in Pima Indians. N Engl J Med 1988;318:
1217–25.
[103] Himsworth HP, Kerr RB. Insulin-sensitive and insulin-insensitive types of diabetes
mellitus. Clin Sci (Lond) 1939;4:120–52.
[104] Ginsberg H, Kimmerling G, Olefsky JM, Reaven GM. Demonstration of insulin
resistance in untreated adult-onset diabetic subjects with fasting hyperglycemia. J Clin
Invest 1975;55:454–61.
[105] Butterfield WJH, Whichelow MJ. Peripheral glucose metabolism in control subjects and
diabetic patients during glucose, glucose-insulin, and insulin sensitivity tests. Diabetologia
1965;1:43–53.
[106] Katz H, Homan M, Jensen M, Caumo A, Cobelli C, Rizza R. Assessment of insulin
action in NIDDM in the presence of dynamic changes in insulin and glucose
concentration. Diabetes 1994;43:289–96.
[107] Bergman RN, Lecture Lilly. Toward physiological understanding of glucose tolerance:
minimal-model approach. Diabetes 1989;38:1512–26.
828
R.A. DeFronzo / Med Clin N Am 88 (2004) 787–835
[108] DeFronzo RA, Deibert D, Hendler R, Felig P. Insulin sensitivity and insulin binding to
monocytes in maturity-onset diabetes. J Clin Invest 1982;63:939–46.
[109] DeFronzo RA, Sherwin RS, Hendler R, Felig P. Insulin binding to monocytes and insulin
action in human obesity, starvation, and refeeding. J Clin Invest 1978;62:204–13.
[110] Firth R, Bell P, Rizza R. Insulin action in non-insulin-dependent diabetes mellitus: the
relationship between hepatic and extrahepatic insulin resistance and obesity. Metabolism
1987;36:1091–5.
[111] Campbell PJ, Mandarino LJ, Gerich JE. Quantification of the relative impairment in
actions of insulin on hepatic glucose production and peripheral glucose uptake in noninsulin dependent diabetes mellitus. Metabolism 1988;37:15–21.
[112] Bogardus C, Lillioja S, Howard BV, Reaven G, Mott D. Relationships between insulin
secretion, insulin action, and fasting plasma glucose concentration in non-diabetic and
noninsulin-dependent subjects. J Clin Invest 1984;74:1238–46.
[113] Del Prato S, Simonson DC, Sheehan P, Cardi F, DeFronzo RA. Studies on the mass effect of
glucose in diabetes. Evidence for glucose resistance. Diabetologia 1997;40:687–97.
[114] DeFronzo RA, Ferrannini E, Simonson DC. J Fasting hyperglycemia in non-insulindependent diabetes mellitus: contributions of excessive hepatic glucose production and
impaired tissue glucose uptake. Metabolism 1989;38:387–95.
[115] Huang SC, Phelps ME, Hoffman EJ, Sideris K, Selin CJ, Kuhl DE. Non-invasive
determination of local cerebral metabolic rate of glucose in man. Am J Physiol 1980;238:
E69–82.
[116] Best JD, Judzewitsch RG, Pfeiffer MA, Beard JC, Halter JB, Porte D. The effect of
chronic sulfonylurea therapy on hepatic glucose production in non-insulin-dependent
diabetes mellitus. Diabetes 1982;31:333–8.
[117] Fery F. Role of hepatic glucose production and glucose uptake in the pathogenesis of
fasting hyperglycemia in Type 2 diabetes: normalization of glucose kinetics by short-term
fasting. J Clin Endocrinol Metab 1994;78:536–42.
[118] Jeng C-Y, Sheu WHH, Fuh MM-T, Chen I, Reaven GM. Relationship between hepatic
glucose production and fasting plasma glucose concentration in patients with NIDDM.
Diabetes 1994;43:1440–4.
[119] Waldhausl W, Bratusch-Marrain P, Gasic S, Korn A, Nowotny P. Insulin production
rate, hepatic insulin retention, and splanchnic carbohydrate metabolism after oral glucose
ingestion in hyperinsulinemic type II (non-insulin dependent) diabetes mellitus.
Diabetologia 1982;23:6–15.
[120] Nurjhan N, Consoli A, Gerich J. Increased lipolysis and its consequences on
gluconeogenesis in noninsulin-dependent diabetes mellitus. J Clin Invest 1992;89:169–75.
[121] Stumvoll M, Perriello G, Nurjhan N, Bucci A, Welle S, Jansson P-A, et al. Glutamine and
alanine metabolism in NIDDM. Diabetes 1996;45:863–8.
[122] Magnusson I, Rothman D, Katz L, Shulman R, Shulman G. Increased rate of
gluconeogenesis in type II diabetes: a 13C nuclear magnetic resonance study. J Clin Invest
1992;90:1323–7.
[123] Gastaldelli A, Baldi S, Pettiti M, Toschi E, Camastra S, Natali A, et al. Influence of
obesity and type 2 diabetes on gluconeogenesis and glucose output in humans:
a quantitative study. Diabetes 2000;49:1367–73.
[124] Clore JN, Stillman J, Sugerman H. Glucose-6-phosphatase flux in vitro is increased in
type 2 diabetes. Diabetes 2000;49:969–74.
[125] Gerich JE, Meyer C, Woerle HJ, Stumvoll M. Renal gluconeogenesis. Its importance in
human glucose homeostasis. Diabetes Care 2001;24:382–91.
[126] Ekberg K, Landau BR, Wajngot A, Chandramouli V, Efendic S, Brunengraber H, et al.
Contributions by kidney and liver to glucose production in the postabsorptive state and
after 60 h of fasting. Diabetes 1999;48:292–8.
[127] Moller N, Rizza RA, Ford GC, Nair KS. Assessment of postabsorptive renal glucose
metabolism in humans with multiple glucose tracers. Diabetes 2001;50:747–51.
R.A. DeFronzo / Med Clin N Am 88 (2004) 787–835
829
[128] Meyer C, Stumvoll M, Nadkarni V, Dostou J, Mitrakou A, Gerich J. Abnormal renal
and hepatic glucose metabolism in type 2 diabetes mellitus. J Clin Invest 1998;102:619–24.
[129] DeFronzo RA, Ferrannini E, Hendler R, Felig P, Wahren J. Regulation of splanchnic
and peripheral glucose uptake by insulin and hyperglycemia. Diabetes 1983;32:35–45.
[130] Frayn KN, Coppack SW, Humphreys SM, Whyte PL. Metabolic characteristics of
human adipose tissue in vivo. Clin Sci 1989;76:509–16.
[131] Ferrannini E, Bjorkman O, Reichard GA Jr, Pilo A, Olsson M, Wahren J, et al. The
disposal of an oral glucose load in healthy subjects. Diabetes 1985;34:580–8.
[132] Katz LD, Glickman MG, Rapoport S, Ferrannini E, DeFronzo RA. Splanchnic and
peripheral disposal of oral glucose in man. Diabetes 1983;32:675–9.
[133] Ferrannini E, Simonson DC, Katz LD, Reichard G Jr, Bevilacqua S, Barrett EJ, et al.
The disposal of an oral glucose load in patients with non-insulin dependent diabetes.
Metabolism 1988;37:79–85.
[134] Firth RG, Bell PM, Marsh HM, Hansen I, Rizza RA. Postprandial hyperglycemia in
patients with non-insulin-dependent diabetes mellitus. J Clin Invest 1986;77:1525–32.
[135] Kelley D, Mitrakou A, Marsh H, Schwenk F, Benn J, Sonnenberg G, et al. Skeletal muscle
glycolysis oxidation, and storage of an oral glucose load. J Clin Invest 1988;81:1563–71.
[136] Jackson RA, Roshania RD, Hawa MI, Sim BM, DiSilvio L. Impact of glucose ingestion on
hepatic and peripheral glucose metabolism in man: an analysis based on simultaneous use
of the forearm and double isotope techniques. J Clin Endocrinol Metab 1986;63:541–9.
[137] Ludvik B, Nolan JJ, Roberts A, Baloga J, Joyce M, Bell Jo M, et al. Evidence for
decreased splanchnic glucose uptake after oral glucose administration in non-insulindependent diabetes mellitus. J Clin Invest 1997;100:2354–61.
[138] Ford ES, Giles WH, Dietz WH. Prevalence of the metabolic syndrome among US adults:
findings from the third National Health and Nutrition Examination Survey. JAMA 2002;
287:356–9.
[139] DeFronzo RA, Ferrannini E. Insulin resistance: a multifaceted syndrome responsible for
NIDDM, obesity, hypertension, dyslipidemia, and ASCVD. Diabetes Care 1991;14:
173–94.
[140] Reaven GM, Brand RJ, Ida Chen Y-D, Mathur AK, Goldfine I. Insulin resistance and
insulin secretion are determinants of oral glucose tolerance in normal individuals.
Diabetes 1993;42:1324–32.
[141] Diamond MP, Thornton K, Connolly-Diamond M, Sherwin RS, DeFronzo RA.
Reciprocal variations in insulin-stimulated glucose uptake and pancreatic insulin
secretion in women with normal glucose tolerance. J Soc Gynecol Invest 1995;2:708–15.
[142] Reaven GM, Chen Y-DI, Donner CC, Fraze E, Hollenbeck CB. How insulin resistant are
patients with non-insulin-dependent diabetes mellitus? J Clin Endocrinol Metab 1985;61:
32–6.
[143] Bogardus C, Lillioja S, Howard BV, Reaven G, Mott D. Relationships between insulin
secretion, insulin action, and fasting plasma glucose concentration in non-diabetic and
noninsulin-dependent subjects. J Clin Invest 1984;74:1238–46.
[144] Dowse GK, Zimmet PZ, Collins VR. Insulin levels and the natural history of glucose
intolerance in Nauruans. Diabetes 1996;45:1367–72.
[145] Haffner SM, Stern MP, Hazuda HP, Pugh JA, Patterson JK. Hyperinsulinemia in
a population at high risk for non-insulin-dependent diabetes mellitus. N Engl J Med 1986;
315:220–4.
[146] Haffner SM, Miettinen H, Stern MP. Insulin secretion and resistance in nondiabetic
Mexican Americans and non-Hispanic whites with a parental history of diabetes. J Clin
Endocrinol Metab 1996;81:1846–51.
[147] Mokdad AH, Ford ES, Bowman BA, Nelson DE, Engelgau MM, Vinicor F, et al.
Diabetes trends in the United States, 1990–1998. Diabetes Care 2000;23:1278–83.
[148] Thiebaud D, DeFronzo RA, Jacot E, Golay A, Acheson K, Maeder E, et al. Effect of longchain triglyceride infusion on glucose metabolism in man. Metabolism 1982;31:1128–36.
830
R.A. DeFronzo / Med Clin N Am 88 (2004) 787–835
[149] De Kelley, Mandarino LJ. Fuel selection in human skeletal muscle in insulin resistance.
A reexamination. Diabetes 2000;49:677–83.
[150] Kashyap S, Belfort R, Gastadelli A, Pratipanawatr T, Berria R, Pratipanawatr W, et al.
Chronic elevation in plasma free fatty acids impairs insulin secretion in non-diabetic
offspring with a strong family history of T2DM. Diabetes 2003;52:2464–74.
[151] Carpentier A, Mittelman SD, Bergman RN, Giacca A, Lewis GF. Prolonged elevation of
plasma free fatty acids impairs pancreatic beta-cell function in obese nondiabetic humans
but not in individuals with type 2 diabetes. Diabetes 2000;49:399–408.
[152] Reaven GM. The fourth Musketeer: from Alexendre Dumas to Calude Bernard.
Diabetologia 1995;38:3–13.
[153] Goodpaster BH, Thaete FL, Kelley BE. Thigh adipose tissue distribution is associated
with insulin resistance in obesity and in type 2 diabetes mellitus. Am J Clin Nutr 2000;71:
885–92.
[154] Greco AV, Mingrone G, Giancaterini A, Manco M, Morroni M, Cinti S, et al. Insulin
resistance in morbid obesity. Reversal with intramyocellular fat depletion. Diabetes 2002;
51:144–51.
[155] Ryysy L, Hakkinen AM, Goto T, Vehkavaara S, Westerbacka J, Halavaara J, et al.
Hepatic fat content and insulin action on free fatty acids and glucose metabolism rather
than insulin absorption are associated with insulin requirements during insulin therapy in
type 2 diabetic patients. Diabetes 2000;49:749–58.
[156] Bajaj M, Surraamornkul S, Piper P, Hardies LJ, Glass L, Cersosimo E, et al. Decreased
plasma adiponectin concentrations are closely related to hepatic fat content and hepatic
insulin resistance in pioglitazone-treated type 2 diabetic patients. J Clin Endocrinol
Metab 2004;89:200–6.
[157] Itani SI, Ruderman NB, Schmieder F, Boden G. Lipid-induced insulin resistance in
human muscle is associated with changes in diacylglycerol, protein kinase C, and IjB-a.
Diabetes 2002;51:2005–11.
[158] Ellis BA, Poynten A, Lowy AJ, Furler SM, Chisholm DJ, Kraegen EW, et al. Long-chain
acyl-CoA esters as indicators of lipid metabolism and insulin sensitivity in rat and human
muscle. Am J Physiol 2000;279:E554–60.
[159] Schmitz-Peiffer C, Craig DL, Biden TJ. Ceramide generation is sufficient to account for
the inhibition of the insulin-stimulated PKB pathway in C2C12 skeletal muscle cells
pretreated with palmitate. J Biol Chem 1999;274:24202–10.
[160] Saltiel AR, Kahn CR. Insulin signaling and the regulation of glucose and lipid
metabolism. Nature 2001;414:799–806.
[161] Pessin JE, Saltiel AR. Signaling pathways in insulin action: molecular targets of insulin
resistance. J Clin Invest 2000;106:165–9.
[162] Whitehead JP, Clark SF, Urso B, James DE. Signaling through the insulin receptor. Cur
Opin Cell Biol 2000;12:222–8.
[163] Ellis LE, Clauser E, Morgan ME, Roth RA, Rutter WJ. Replacement of insulin receptor
tyrosine residues 1162 and 1163 compromises insulin-stimulated kinase activity and
uptake of 2-dexoyglucose. Cell 1986;45:721–32.
[164] Chou DK, Dull TJ, Russell DS, Gherzi R, Lebwohl D, Ullrich A, et al. Human insulin
receptors mutated at the ATP-binding site lack protein tyrosine kinase activity and fail to
mediate postreceptor effects of insulin. J Biol Chem 1987;262:1842–7.
[165] Virkamaki A, Ueki K, Kahn CR. Protein-protein interaction in insulin signaling and the
molecular mechanisms of insulin resistance. J Clin Invest 1999;103:931–43.
[166] Kerouz NJ, Horsch D, Pons S, Kahn CR. Differential regulation of insulin receptor
substrates-1 and -2 (IRS-1 and IRS-2) and phosphatidylinositol 3-kinase isoforms in liver
and muscle of the obese diabetic (ob/ob) mouse. J Clin Invest 1997;100:3164–72.
[167] Sun XJ, Miralpeix M, Myers MG Jr, Glasheen EM, Backer JM, Kahn CR, et al. The
expression and function of IRS-1 in insulin signal transmission. J Biol Chem 1992;267:
22662–72.
R.A. DeFronzo / Med Clin N Am 88 (2004) 787–835
831
[168] Cross D, Alessi D, Vandenheed J, McDowell H, Hundal H, Cohen P. The inhibition of
glycogen synthase kinase-3 by insulin or insulin-like growth factor 1 in the rat skeletal
muscle cell line L6 is blocked by wortmannin but not rapamycin. Biochem J 1994;303:
21–6.
[169] Osawa H, Sutherland C, Robey R, Printz R, Granner D. Analysis of the signaling
pathway involved in the regulation of hexokinase II gene transcription by insulin. J Biol
Chem 1996;271:16690–4.
[170] Lazar DF, Wiese RJ, Brady MJ, Mastick CC, Waters SB, Yamauchi K, Pessin JE,
Cuatrecasas P, Saltiel AR. Mitogen-activated protein kinase kinase inhibition does not
block the stimulation of glucose utilization by insulin. J Biol Chem 1995;270:20801–7.
[171] Dent P, Lavoinne A, Nakielny S, Caudwell FB, Watt P, Cohen F. The molecular
mechanisms by which insulin stimulates glycogen synthesis in mammalian skeletal muscle.
Nature 1990;348:302–7.
[172] Newgard CB, Brady MJ, O’Doherty RB, Saltiel AR. Organizing glucose disposal.
Emerging roles of the glycogen targeting subunits of protein phosphatase-1. Diabetes
2000;49:1967–77.
[173] Sheperd PR, Nave BT, Siddle K. Insulin stimulation of glycogen synthesis and glycogen
synthase activity is blocked by wortmannin and rapamycin in 3T3L1 adipocytes: evidence
for the involvement of phosphoinositide 3 kinase and p70 ribosomal protein S6 kinase.
Biochem J 1995;305:25–8.
[174] Freidenberg GR, Henry RR, Klein HH, Reichart DR, Olefsky JM. Decreased kinase
activity of insulin receptors from adipocytes of non-insulin-dependent diabetic studies.
J Clin Invest 1987;79:240–50.
[175] Caro JF, Sinha MK, Raju SM, Ittoop O, Pories WJ, Flickinger EG, et al. Insulin receptor
kinase in human skeletal muscle from obese subjects with and without non-insulin
dependent diabetes. J Clin Invest 1987;79:1330–7.
[176] Caro JF, Ittoop O, Pories WJ, Meelheim D, Flickinger EG, Thomas F, et al. Studies on
the mechanism of insulin resistance in the liver from humans with non-insulin-dependent
diabetes. Insulin action and binding in isolated hepatocytes, insulin receptor structure,
and kinase activity. J Clin Invest 1986;78:249–58.
[177] Trichitta V, Brunetti A, Chiavetta A, Benzi L, Papa V, Vigneri R. Defects in insulinreceptor internalization and processing in monocytes of obese subjects and obese
NIDDM patients. Diabetes 1989;38:1579–84.
[178] Klein HH, Vestergaard H, Kotzke G, Pedersen O. Elevation of serum insulin
concentration during euglycemic hyperinsulinemic clamp studies leads to similar
activation of insulin receptor kinase in skeletal muscle of subjects with and without
NIDDM. Diabetes 1995;344:1310–7.
[179] Kashiwagi A, Verso MA, Andrews J, Vasquez B, Reaven G, Foley JE. In vitro insulin
resistance of human adipocytes isolated from subjects with non-insulin-dependent
diabetes mellitus. J Clin Invest 1983;72:1246–54.
[180] Lonnroth P, Digirolamo M, Krotkiewski M, Smith U. Insulin binding and responsiveness
in fat cells from patients with reduced glucose tolerance and type II diabetes. Diabetes
1983;32:748–54.
[181] Olefsky JM, Reaven GM. Insulin binding in diabetes. Relationships with plasma insulin
levels and insulin sensitivity. Diabetes 1977;26:680–8.
[182] Moller DE, Yakota A, Flier JS. Normal insulin receptor cDNA sequence in Pima Indians
with non-insulin-dependent diabetes mellitus. Diabetes 1989;38:1496–500.
[183] Kusari J, Verma US, Buse JB, Henry RR, Olefsky JM. Analysis of the gene sequences of the
insulin receptor and the insulin-sensitive glucose transporter (GLUT4) in patients with
common-type non-insulin-dependent diabetes mellitus. J Clin Invest 1991;88:1323–30.
[184] Nolan JJ, Friedenberg G, Henry R, Reichart D, Olefsky JM. Role of human skeletal
muscle insulin receptor kinase in the in vivo insulin resistance of noninsulin-dependent
diabetes and obesity. J Clin Endocrinol Metab 1994;78:471–7.
832
R.A. DeFronzo / Med Clin N Am 88 (2004) 787–835
[185] Cusi K, Maezono K, Osman A, Pendergrass M, Patti ME, Pratipanawatr T, et al. Insulin
resistance differentially affects the PI 3-kinase and MAP kinase-mediated signaling in
human muscle. J Clin Invest 2000;105:311–20.
[186] Freidenberg GR, Reichart D, Olefsky JM, Henry RR. Reversibility of defective adipocyte
insulin receptor kinase activity in non-insulin dependent diabetes mellitus. Effect of
weight loss. J Clin Invest 1988;82:1398–406.
[187] Kellerer M, Kroder G, Tippmer S, Berti L, Kiehn L, Mosthaf L, et al. Troglitazone
prevents glucose-induced insulin resistance of insulin receptor in rat-1 fibroblasts.
Diabetes 1994;43:447–53.
[188] Pratipanawatr W, Pratipanawatr T, Cusi K, Berria R, Adams JM, Jenkinson CP, et al.
Skeletal muscle insulin resistance in normoglycemic subjects with a strong family history
of type 2 diabetes is associated with decreased insulin-stimulated insulin receptor
substrate-1 tyrosine phosphorylation. Diabetes 2001;50:2572–8.
[189] Krook A, Bjornholm M, Galuska D, Jiang XJ, Fahlman R, Myers MG, et al.
Characterization of signal transduction and glucose transport in skeletal muscle from type
2 diabetic patients. Diabetes 2000;49:284–92.
[190] Kim Y-B, Nikoulina S, Ciaraldi TP, Henry RR, Kahn BB. Normal insulin-dependent
activation of Akt/protein kinase B, with diminished activation of phosphoinositide
3-kinase, in muscle in type 2 diabetes. J Clin Invest 1999;104:733–41.
[191] Andreelli F, Laville M, Ducluzeau P-H, Vega N, Vallier P, Khalfallah Y, et al. Defective
regulation of phosphatidylinositol-3-kinase gene expression in skeletal muscle and
adipose tissue of non-insulin-dependent diabetes mellitus patients. Diabetologia 1999;42:
358–64.
[192] Folli F, Saad JA, Backer JM, Kahn CR. Regulation of phosphatidylinositol 3-kinase
activity in liver and muscle of animal models of insulin-resistant and insulin-deficient
diabetes mellitus. J Clin Invest 1993;92:1787–94.
[193] Hitman GA, Hawrammi K, McCarthy MI, Viswanathan M, Snehalatha C, Ramachandran A, et al. Insulin receptor substrate-1 gene mutations in NIDDM: implication for the
study of polygenic disease. Diabetologia 1995;38:481–6.
[194] Hsueh WA, Law RE. Insulin signaling in the arterial wall. Am J Cardiol 1999;84:21–4J.
[195] Jiang ZY, Lin YW, Clemont A, Feener EP, Hein KD, Igarashi M, Yamauchi T, White
MF, King GL. Characterization of selective resistance to insulin signaling in the
vasculature of obese Zucker (fa/fa) rats. J Clin Invest 1999;104:447–57.
[196] Shepherd PR, Kahn BB. Glucose transporters and insulin action. Implications for insulin
resistance and diabetes mellitus. N Engl J Med 1999;341:248–57.
[197] Garvey WT. Insulin action and insulin resistance: diseases involving defects in insulin
receptors, signal transduction, and the glucose transport effector system. Am J Med 1998;
105:331–45.
[198] Gl Bell, Kayano T, Buse JB, Burant CF, Takeda J, Lin D, Fikomoto H, Seino S.
Molecular biology of mammalian glucose transporters. Diabetes Care 1990;13:198–200.
[199] Joost H-G, Bell GI, Best JD, Birnbaum MJ, Charron MJ, Chen YT, et al. Nomenclature
of the GLUT/SLC2A family of sugar/polyol transport facilitators. Am J Physiol
Endocrinol Metab 2002;282:E974–6.
[200] Rogers PA, Fisher RA, Harris H. An electrophoretic study of the distribution and
properties of human hexokinases. Biochem Genet 1975;13:857–66.
[201] Matchinsky FM. Banting Lecture 1995. A lesson in metabolic regulation inspired by the
glucokinase glucose sensor paradigm. Diabetes 1996;45:223–41.
[202] Garvey WT, Huecksteadt TP, Mattaei S, Olefsky JM. Role of glucose transporters in the
cellular insulin resistance of type II non-insulin dependent diabetes mellitus. J Clin Invest
1988;81:1528–36.
[203] Zierath JR, He L, Guma A, Odegoard Wahlstrom E, Klip A, Wallenberg-Henriksson H.
Insulin action on glucose transport and plasma membrane GLUT4 content in skeletal
muscle from patients with NIDDM. Diabetologia 1996;39:1180–9.
R.A. DeFronzo / Med Clin N Am 88 (2004) 787–835
833
[204] Krook A, Bjornholm M, Galuska D, Jiang XJ, Fahlman R, Myers MG, et al.
Characterization of signal transduction and glucose transport in skeletal muscle from type
2 diabetic patients. Diabetes 2000;49:284–92.
[205] Pedersen O, Bak J, Andersen P, Lund S, Moller DE, Flier JS, et al. Evidence against
altered expression of GLUT1 or GLUT4 in skeletal muscle of patients with obesity or
NIDDM. Diabetes 1990;39:865–70.
[206] Eriksson J, Koranyi L, Bourey R, Schalin-Jantti C, Widen E, Mueckler M, et al. Insulin
resistance in type 2 (non-insulin-dependent) diabetic patients and their relatives is not
associated with a defect in the expression of the insulin-responsive glucose transporter
(GLUT-4) gene in human skeletal muscle. Diabetologia 1992;35:143–7.
[207] Bonadonna RC, Del Prato S, Saccomani MP, Bonora E, Gulli G, Ferrannini E, et al.
Transmembrane glucose transport in skeletal muscle of patients with non-insulindependent diabetes. J Clin Invest 1993;92:486–94.
[208] Bonadonna RC, Del Prato S, Bonora E, Saccomani MP, Gulli G, Natali A, et al. Roles of
glucose transport and glucose phosphorylation in muscle insulin resistance of NIDDM.
Diabetes 1996;45:915–25.
[209] Cline GW, Petersen KF, Krssak M, Shen J, Hundal RS, Trajanoski Z, et al. Impaired
glucose transport as a cause of decreased insulin stimulated muscle glycogen synthesis in
type 2 diabetes. N Engl J Med 1999;341:240–6.
[210] Williams KV, Price JC, Kelley DE. Interactions of impaired glucose transport and
phosphorylation in skeletal muscle insulin resistance. A dose-response assessment using
positron emission tomography. Diabetes 2001;50:2069–79.
[211] Choi WH, O’Rahilly S, Rees A, Morgan R, Flier JS, Moller DE. Molecular scanning of
the insulin-responsive glucose transporter (GLUT 4) gene in patients with non-insulin
dependent diabetes mellitus. Diabetes 1991;40:1712–8.
[212] Perriott LM, Kono T, Whitesell RR, Knobel SM, Piston DW, Granner DK, et al.
Glucose uptake and metabolism by cultured human skeletal muscle cells: rate-limiting
steps. Am J Physiol Endocrinol Metab 2001;281:E72–80.
[213] Printz RL, Ardehali H, Koch S, Granner DK. Human hexokinase II mRNA and gene
structure. Diabetes 1995;44:290–4.
[214] Mandarino LJ, Printz RL, Cusi KA, Kinchington P, O’Doherty RM, Osawa H, et al.
Regulation of hexokinase II and glycogen synthase mRNA, protein, and activity in
human muscle. Am J Physiol 1995;269:E701–8.
[215] Vogt C, Ardehali H, Iozzo P, Yki-Jarvinen H, Koval J, Maezono K, et al. Regulation of
hexokinase II expression in human skeletal muscle in vivo. Metabolism 2000;49:814–8.
[216] Pendergrass M, Koval J, Vogt C, Yki-Jarvinen H, Iozzo P, Pipek R, et al. Insulin-induced
hexokinase II expression is reduced in obesity and NIDDM. Diabetes 1998;47:387–94.
[217] Ducluzeau P-H, Perretti N, Laville M, Andreelli F, Vega N, Riou J-P, et al. Regulation
by insulin of gene expression in human skeletal muscle and adipose tissue. Evidence for
specific defects in type 2 diabetes. Diabetes 2001;50:1134–42.
[218] Lehto M, Huang X, Davis EM, Le Beau MM, Laurila E, Eriksson KF, et al. Human
hexokinase II gene: exon-intron organization, mutation screening in NIDDM, and its
relationship to muscle hexokinase activity. Diabetologia 1995;38:1466–74.
[219] Laakso M, Malkki M, Kekalainen P, Kuusito J, Deeb SS. Polymorphisms of the human
hexokinase II gene: lack of association with NIDDM and insulin resistance. Diabetologia
1995;38:617–22.
[220] Echwald SM, Bjorbaek C, Hansen T, Clausen JO, Vestergaard H, Zierath JR, et al.
Identification of four amino acid substitutions in hexokinase II and studies of
relationships to NIDDM, glucose effectiveness, and insulin sensitivity. Diabetes 1995;
44:347–53.
[221] Thiebaud D, Jacot E, DeFronzo RA, Maeder E, Jequier E, Felber JP. The effect of
graded doses of insulin on total glucose uptake, glucose oxidation, and glucose storage in
man. Diabetes 1982;31:957–63.
834
R.A. DeFronzo / Med Clin N Am 88 (2004) 787–835
[222] Golay A, DeFronzo RA, Ferrannini E, Simonson DC, Thorin D, Acheson K, et al.
Oxidative and non-oxidative glucose metabolism in non-obese Type 2 (non-insulin
dependent) diabetic patients. Diabetologia 1988;31:585–91.
[223] Lillioja A, Mott DM, Zawadzki JK, Young AA, Abbott WG, Bogardus C. Glucose
storage is a major determinant of in vivo ‘insulin resistance’ in subjects with normal
glucose tolerance. J Clin Endocrinol Metab 1986;62:922–7.
[224] Shulman GI, Rothman DL, Jue T, Stein P, DeFronzo RA, Shulman RG. Quantitation of
muscle glycogen synthesis in normal subjects and subjects with non-insulin-dependent
diabetes by 13C nuclear magnetic resonance spectroscopy. N Engl J Med 1990;322:223–8.
[225] Rothman DL, Magnusson I, Cline G, Gerard D, Kahn CR, Shulman RG, et al. Decreased
muscle glucose transport/phosphorylation is an early defect in the pathogenesis of noninsulin-dependent diabetes mellitus. Proc Natl Acad Sci USA 1995;92:983–7.
[226] Yki-Jarvinen H, Mott D, Young AA, Stone K, Bogardus C. Regulation of glycogen
synthase and phosphorylase activity by glucose and insulin in human skeletal muscle.
J Clin Invest 1987;80:95–100.
[227] Frame S, Cohen P. GSK3 takes centre stage more than 20 years after its discovery.
Biochem J 2001;359(Pt 1):1–16.
[228] Cohen P. The Croonian Lecture 1999. Identification of a protein kinase cascade of major
importance in insulin signal transduction. Proc R Soc Lond B Biol Sci 1999;354:485–95.
[229] Damsbo P, Vaag A, Hother-Nielsen O, Beck-Nielsen H. Reduced glycogen synthase
activity in skeletal muscle from obese patients with and without type 2 (non-insulindependent) diabetes mellitus. Diabetologia 1991;34:239–45.
[230] Mandarino LJ, Wright KS, Verity LS, Nichols J, Bell JM, Kolterman OG, et al. Effects of
insulin infusion on human skeletal muscle pyruvate dehydrogenase, phosphofructokinase,
and glycogen synthase. Evidence for their role in oxidative glucose metabolism. J Clin
Invest 1987;80:655–63.
[231] Thorburn AW, Gumbiner B, Bulacan F, Wallace P, Henry RR. Intracellular glucose
oxidation and glycogen synthase activity are reduced in non-insulin-dependent (type II)
diabetes independent of impaired glucose uptake. J Clin Invest 1990;85:522–9.
[232] Vaag A, Henriksen JE. Beck-Nielsen Decreased insulin activation of glycogen synthase in
skeletal muscles in young non-obese Caucasian first-degree relatives of patients with noninsulin-dependent diabetes mellitus. J Clin Invest 1992;89:782–8.
[233] Nyomba BL, Freymond D, Raz I, Stone K, Mott DM, Bogardus C. Skeletal muscle
glycogen synthase activity in subjects with non-insulin-dependent diabetes mellitus after
glyburide therapy. Metabolism 1990;39:1204–10.
[234] Pratipanawatr T, Cusi K, Ngo P, Pratipanawatr W, Mandarino LJ, DeFronzo RA.
Normalization of plasma glucose concentration by insulin therapy improves insulinstimulated glycogen synthesis in type 2 diabetes. Diabetes 2002;51:462–8.
[235] Vestergaard H, Lund S, Larsen FS, Bjerrum OJ, Pedersen O. Glycogen synthase and
phosphofructokinase protein and mRNA levels in skeletal muscle from insulin-resistant
patients with non-insulin-dependent diabetes mellitus. J Clin Invest 1993;91:2342–50.
[236] Vestergaard H, Bjocbaek C, Andersen PH, Bak JF, Pedersen O. Impaired expression of
glycogen synthase mRNA in skeletal muscle of NIDDM patients. Diabetes 1991;40:1740–5.
[237] Majer M, Mott DM, Mochizuki H, Rowles JC, Pederson O, Knowler WC, et al. Association
of the glycogen synthase locus on 19q13 with NIDDM in Pima Indians. Diabetologia 1996;
39:314–21.
[238] Orho M, Nikua-Ijas P, Schalin-Jantti C, Permutt MA, Groop LC. Isolatation and
characterization of the human muscle glycogen synthase gene. Diabetes 1995;44:1099–105.
[239] Bjorbaek C, Echward SM, Hubricht P, Vestergaard H, Hansen T, Zierath J, et al. Genetic
variants in promoters and coding regions of the muscle glycogen synthase and the insulinresponsive GLUT4 genes in NIDDM. Diabetes 1994;43:976–83.
[240] Bjorbaek C, Fik TA, Echward SM, Yang P-Y, Vestergaard H, Wang JP, et al. Cloning of
human insulin-stimulated protein kinase (ISPK-1) gene and analysis of coding regions
R.A. DeFronzo / Med Clin N Am 88 (2004) 787–835
[241]
[242]
[243]
[244]
[245]
[246]
[247]
[248]
835
and mRNA levels of the ISPK-1 and the protein phosphatase-1 genes in muscle from
NIDDM patients. Diabetes 1995;44:90–7.
Procharzka M, Michizuki H, Baier LJ, Cohen PTW, Bogardus C. Molecular and linkage
analysis of type-1 protein phosphatase catalytic beta-subunit gene: lack of evidence for its
major role in insulin resistance in Pima Indians. Diabetologia 1995;38:461–6.
Schalin-Jantti C, Harkoenen M, Groop LC. Impaired activation of glycogen synthase in
people at increased risk for developing NIDDM. Diabetes 1992;41:598–604.
Del Prato S, Bonadonna RC, Bonora E, Gulli G, Solini A, Shank M, et al.
Characterization of cellular defects of insulin action in type 2 (non-insulin-dependent)
diabetes mellitus. J Clin Invest 1993;91:484–94.
Falholt K, Jensen I, Lindkaer Jensen S, Mortensen HB, Volund A, Heding LG, Norskov
Petersen P, Falholt W. Carbohydrate and lipid metabolism of skeletal muscle in type 2
diabetic patients. Diabet Med 1988;5:27–31.
Mandarino LJ, Madar Z, Kolterman OG, Bell JM, Olefsky JM. Adipocyte glycogen
synthase and pyruvate dehydrogenase in obese and type II diabetic patients. Am J Physiol
1986;251:E489–96.
Kelley D, Mokan M, Mandarino L. Intracellular defects in glucose metabolism in obese
patients with noninsulin-dependent diabetes mellitus. Diabetes 1992;41:698–706.
Groop L, Bonadonna R, Simonson DC, Petrides A, Hasan S, DeFronzo RA. Effect of
insulin on oxidative and non-oxidative pathways of glucose and free fatty-acid
metabolism in human obesity. Am J Physiol 1992;263:E79–84.
Randle PJ, Garland PB, Hales CN, Newsholme EA. The glucose fatty acid cycle: its role in
insulin sensitivity and the metabolic disturbances of diabetes mellitus. Lancet 1963;i:785–9.
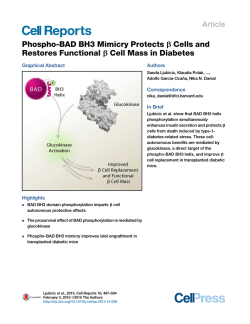
© Copyright 2026