Financial Statements and Related Announcement
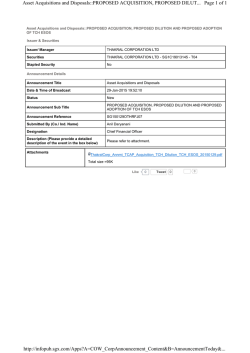
Financial Statements and Related Announcement::Second Quarter and/ or Half Yearly Results
Issuer & Securities
Issuer/ Manager
GUOCOLEISURE LIMITED
Securities
GUOCOLEISURE LIMITED - BMG4210D1020 - B16
Stapled Security
No
Announcement Details
Announcement Title
Financial Statements and Related Announcement
Date & Time of Broadcast
02-Feb-2015 17:36:04
Status
New
Announcement Sub Title
Second Quarter and/ or Half Yearly Results
Announcement Reference
SG150202OTHRUONU
Submitted By (Co./ Ind. Name)
Susan Lim
Designation
Group Company Secretary
Description (Please provide a detailed
description of the event in the box below Refer to the Online help for the format)
Please see attached.
Additional Details
For Financial Period Ended
Attachments
31/12/2014
GL_2Q_31Dec2014.pdf
Total size =470K
Like
0
Tweet
0
0
Unaudited Financial Statement And Related Announcement For Half-year and Second Quarter
Ended 31 December 2014
1(a)(i) An income statement and statement of comprehensive income, or a statement of comprehensive
income, for the group, together with a comparative statement for the corresponding period of the
immediately preceding financial year
Unaudited
1st Half Ended
1 Jul to
1 Jul to
31 Dec 13
31 Dec 14
US$m
US$m
Revenue
Unaudited
2nd Quarter Ended
1 Oct to
1 Oct to
31 Dec 13
31 Dec 14
US$m
US$m
Increase/
(Decrease)
%
Increase/
(Decrease)
%
200.6
214.5
(6.5%)
99.6
106.7
(6.7%)
23.6
22.4
5.4%
10.6
10.8
(1.9%)
Gain on disposal of investments/assets
0.1
0.8
(87.5%)
-
-
-
Other operating income
Bass Strait oil and gas royalty
7.6
7.2
5.6%
4.0
3.7
8.1%
Direct costs of raw materials and
consumables
(95.0)
(100.3)
(5.3%)
(48.2)
(51.1)
(5.7%)
Personnel expenses
(57.3)
(62.1)
(7.7%)
(28.3)
(32.2)
(12.1%)
Other operating expenses
(14.5)
(16.4)
(11.6%)
(6.8)
(7.3)
(6.8%)
65.1
66.1
(1.5%)
30.9
30.6
1.0%
Depreciation
(11.8)
(12.0)
(1.7%)
(5.8)
(6.1)
(4.9%)
Amortisation
(1.9)
(2.0)
(5.0%)
(0.9)
(1.0)
(10.0%)
PROFIT BEFORE FINANCING COSTS
51.4
52.1
(1.3%)
24.2
23.5
3.0%
(15.6)
(15.7)
(0.6%)
(7.2)
(8.0)
(10.0%)
Finance income
3.6
3.5
2.9%
1.8
1.8
-
Net foreign exchange gain/(loss)
0.3
(0.6)
N.M
(0.2)
0.1
N.M
PROFIT BEFORE TAX
39.7
39.3
1.0%
18.6
17.4
6.9%
Income tax expense
(8.5)
(9.3)
(8.6%)
(3.9)
(3.8)
2.6%
PROFIT FOR THE PERIOD
31.2
30.0
4.0%
14.7
13.6
8.1%
- Owners of the Company
31.4
30.2
4.0%
14.8
13.7
8.0%
- Non-controlling interests
(0.2)
(0.2)
-
(0.1)
(0.1)
-
PROFIT FOR THE PERIOD
31.2
30.0
4.0%
14.7
13.6
8.1%
PROFIT BEFORE DEPRECIATION &
AMORTISATION
Finance costs
PROFIT ATTRIBUTABLE TO:
Note: N.M - not meaningful
Page 1 of 12
Note to Income Statement
Unaudited
1st Half Ended
1 Jul to
1 Jul to
31 Dec 14 31 Dec 13
US$m
US$m
Increase/
(Decrease)
%
Unaudited
2nd Quarter Ended
1 Oct to
1 Oct to
31 Dec 13
31 Dec 14
US$m
US$m
Increase/
(Decrease)
%
Profit before tax is stated after
(charging) / crediting:
Gain on disposal of investments/assets
Other operating income
Amortisation of Bass Strait oil and gas
royalty
Income tax expenses
0.1
7.6
0.8
7.2
(87.5%)
5.6%
4.0
3.7
8.1%
(1.9)
(8.5)
(2.0)
(9.3)
(5.0%)
(8.6%)
(0.9)
(3.9)
(1.0)
(3.8)
(10.0%)
2.6%
Unaudited
2nd Quarter Ended
1 Oct to
1 Oct to
31 Dec 13
31 Dec 14
US$m
US$m
Increase/
(Decrease)
%
1(a)(ii) Statement of Comprehensive Income
Unaudited
1st Half Ended
1 Jul to
1 Jul to
31 Dec 13
31 Dec 14
US$m
US$m
Profit for the period
31.2
30.0
Increase/
(Decrease)
%
4.0%
14.7
13.6
8.1%
Other comprehensive income:
Items that may be reclassified
subsequently to profit or loss:
Net exchange translation difference
relating to financial statements of
foreign subsidiaries
Change in fair value of cash flow
hedge
Change in fair value of available-forsale investments
Other comprehensive income for the
period, net of income tax
TOTAL COMPREHENSIVE INCOME
FOR THE PERIOD
(93.0)
65.2
N.M
(43.2)
15.2
N.M
(4.8)
-
N.M
(4.8)
-
N.M
-
0.1
N.M
-
0.1
N.M
(97.8)
65.3
N.M
(48.0)
15.3
N.M
(66.6)
95.3
N.M
(33.3)
28.9
N.M
(66.7)
0.1
95.6
(0.3)
N.M
N.M
(33.3)
-
29.0
(0.1)
N.M
N.M
(66.6)
95.3
N.M
(33.3)
28.9
N.M
TOTAL COMPREHENSIVE INCOME
ATTRIBUTABLE TO:
- Owners of the Company
- Non-controlling interests
TOTAL COMPREHENSIVE INCOME
FOR THE PERIOD
Note: N.M - not meaningful
Page 2 of 12
1(b)(i) A Statement of Financial Position (for the issuer and group), together with a comparative statement
as at the end of the immediately preceding financial year
GROUP
COMPANY
Unaudited
Audited
Unaudited
Audited
31-Dec-14
30-June-14
31-Dec-14
30-June-14
US$m
US$m
US$m
US$m
ASSETS
Hotels, property and equipment
Intangible assets
1,195.9
1,286.8
133.2
152.4
-
-
Investment in subsidiaries
-
-
-
-
955.7
1,199.1
-
-
4.1
3.1
1,333.2
1,442.3
955.7
1,199.1
1.2
1.0
-
-
177.0
176.8
-
-
52.4
85.1
0.6
1.0
Assets held for sale
-
0.1
-
-
Advances to subsidiaries
-
-
435.3
92.0
5.9
9.1
-
-
236.5
272.1
435.9
93.0
1,569.7
1,714.4
1,391.6
1,292.1
Loans and borrowings
22.8
250.4
-
0.5
Trade and other payables
84.7
114.3
1.6
2.0
Corporate tax payable
9.1
9.5
-
-
Provisions
1.3
1.3
-
-
TOTAL CURRENT LIABILITIES
117.9
375.5
1.6
2.5
Loans and borrowings
305.3
99.2
-
-
-
1.6
-
-
22.1
23.3
-
-
TOTAL NON-CURRENT LIABILITIES
327.4
124.1
-
-
TOTAL LIABILITIES
445.3
499.6
1.6
2.5
1,124.4
1,214.8
1,390.0
1,289.6
1,126.8
1,217.3
1,390.0
1,289.6
(2.4)
(2.5)
-
-
1,124.4
1,214.8
1,390.0
1,289.6
Other investments
TOTAL NON-CURRENT ASSETS
Inventories
Development properties
Trade and other receivables
Cash and cash equivalents
TOTAL CURRENT ASSETS
TOTAL ASSETS
LIABILITIES
Provisions
Deferred tax liabilities
NET ASSETS
SHARE CAPITAL AND RESERVES
Equity attributable to owners of the Company
Non-controlling interests
TOTAL EQUITY
Page 3 of 12
1(b)(ii) Aggregate amount of group’s borrowings and debt securities
Amount repayable in one year or less, or on demand
As at 31 Dec 2014
Secured
Unsecured
22.8
As at 30 Jun 2014
Secured
Unsecured
238.4
12.0
Amount repayable after one year
As at 31 Dec 2014
Secured
Unsecured
90.4
214.9
As at 30 Jun 2014
Secured
Unsecured
99.2
-
Details of any collateral
As at 31 December 2014, the Group’s unsecured borrowings that were repayable in one year or less stood
at US$22.8 million. The Group continues to have banking lines to meet its funding requirements.
The Group’s secured borrowings as at 31 December 2014 of US$90.4 million that is repayable after one
year, is secured on one hotel owned by the Group with a total net book value of US$146.3 million.
In December 2014, the Group has drawn down US$214.9 million unsecured bank borrowings, that is
repayable after one year, to redeem the secured debenture stocks due on 20 December 2014.
Page 4 of 12
1(c) A statement of cash flows (for the group), together with a comparative statement for the
corresponding period of the immediately preceding financial year
GROUP
Unaudited 1st Half
1 Jul to
31 Dec 14
US$m
Unaudited 2nd Quarter
1 Jul to
31 Dec 13
US$m
1 Oct to
31 Dec 13
US$m
1 Oct to
31 Dec 14
US$m
OPERATING ACTIVITIES
Profit before financing costs
51.4
52.1
24.2
23.5
11.8
12.0
5.8
6.1
1.0
Adjustments for non-cash items
Depreciation of hotels, property and equipment
Amortisation of Bass Strait oil and gas royalty
Gain on disposal of investments/assets
Other non-cash items
1.9
2.0
0.9
(0.1)
(0.8)
-
-
0.4
0.4
0.2
0.2
(0.4)
0.8
(0.4)
(0.2)
Net change in working capital items
Inventories/development properties
Trade and other receivables
Trade and other payables
32.8
17.6
7.2
14.5
(34.0)
(11.4)
(8.7)
(14.3)
Provisions
(2.2)
(2.8)
(1.0)
(2.1)
Income tax paid
(6.6)
(6.9)
(3.5)
(3.6)
Purchase of shares of the Company for ESOS 2008
(4.0)
51.0
(0.7)
62.3
24.7
25.1
CASH FLOWS FROM OPERATING ACTIVITIES
INVESTING ACTIVITIES
Proceeds from sale of investments/assets
0.1
9.1
-
0.2
Acquisition of hotels, property and equipment
(30.4)
(12.3)
(16.4)
(7.5)
CASH FLOWS USED IN INVESTING ACTIVITIES
(30.3)
(3.2)
(16.4)
(7.3)
FINANCING ACTIVITIES
Drawdown of short-term borrowings
Repayment of short-term borrowings
Drawdown of long-term borrowings
1.6
19.4
-
6.5
(3.0)
(50.3)
(1.6)
(11.5)
-
223.1
-
223.1
(223.4)
-
(223.4)
-
-
0.1
-
0.1
(14.5)
(15.6)
(14.4)
(15.4)
(0.3)
(0.2)
(0.2)
(0.2)
0.5
(0.4)
0.6
(0.6)
Dividend paid to shareholders of the Company
(20.1)
(21.0)
(20.1)
(21.0)
CASH FLOWS USED IN FINANCING ACTIVITIES
(36.1)
(68.0)
(36.0)
(42.1)
NET DECREASE IN CASH AND CASH EQUIVALENTS
(15.4)
(8.9)
(27.7)
(24.3)
Cash and cash equivalents at beginning of the period
Effect of exchange rate fluctuations on cash held
(2.4)
0.9
7.7
(0.4)
9.8
1.0
23.7
(1.0)
CASH AND CASH EQUIVALENTS AT END OF THE
PERIOD*
(16.9)
(1.6)
(16.9)
(1.6)
Redemption of mortgaged debenture stock
Interest received
Interest paid
Other financing costs
Realised exchange gain/(losses) on financial derivatives
* including bank overdraft of US$22.8 million (2013:US$9.5 million) under loan and borrowings.
Page 5 of 12
1(d)(i) A statement (for the issuer and group) showing either (i) all changes in equity or (ii) changes in
equity other than those arising from capitalisation issues and distributions to shareholders, together
with a comparative statement for the corresponding period of the immediately preceding financial
year
Statement of Changes in Equity – Group
Other comprehensive income:
Net exchange translation difference relating
to financial statements of foreign
subsidiaries
Changes in fair value of cash flow hedge
Total other comprehensive income, net of
income tax
Total comprehensive income for the period,
net of income tax
Transactions with owners, recorded directly
in equity:
Purchase of shares of the Company for
ESOS 2008
Value of employee services received for
issue of share option
First and final dividend of SGD0.020 per
share for the year ended 30 June 2014
Total transactions with owners
Balance at 31 December 2014
Balance at 1 Jul 2013
Profit for the period
Other comprehensive income:
Net exchange translation difference relating
to financial statements of foreign
subsidiaries
Changes in fair value of available-for-sale
investments
Total other comprehensive income, net of
income tax
Total comprehensive income for the period,
net of income tax
Transactions with owners, recorded directly
in equity:
Purchase of shares of the Company for
ESOS 2008
Value of employee services received for
issue of share option
First and final dividend of SGD0.020 per
share for the year ended 30 June 2013
Total transactions with owners
Balance at 31 December 2013
Equity
Compen
-sation
Reserve
US$m
ESOS
Reserve
US$m
Retained
Earnings
US$m
Contributed
Surplus
US$m
Translation
Reserve
US$m
Fair
Value
Reserve
US$m
273.6
654.2
(10.4)
0.6
(1.6)
3.4
(42.2)
339.7
1,217.3
(2.5)
1,214.8
-
-
-
-
-
-
-
31.4
31.4
(0.2)
31.2
-
-
(93.3)
-
(4.8)
-
-
-
-
(93.3)
(4.8)
0.3
-
(93.0)
(4.8)
-
-
(93.3)
(4.8)
-
-
-
-
(98.1)
0.3
(97.8)
-
-
(93.3)
(4.8)
-
-
-
31.4
(66.7)
0.1
(66.6)
-
-
-
-
-
-
(4.0)
-
(4.0)
-
(4.0)
-
-
-
-
-
0.3
-
-
0.3
-
0.3
-
-
-
-
-
-
-
(20.1)
(20.1)
-
(20.1)
-
-
-
-
-
0.3
(4.0)
(20.1)
(23.8)
-
(23.8)
273.6
654.2
(103.7)
(4.2)
(1.6)
3.7
(46.2)
351.0
1,126.8
(2.4)
1,124.4
273.6
654.2
(107.8)
0.5
(1.6)
2.7
(40.3)
325.2
1,106.5
(1.9)
1,104.6
-
-
-
-
-
-
-
30.2
30.2
(0.2)
30.0
-
-
65.3
-
0.1
-
-
-
-
65.3
0.1
(0.1)
-
65.2
0.1
-
-
65.3
0.1
-
-
-
-
65.4
(0.1)
65.3
-
-
65.3
0.1
-
-
-
30.2
95.6
(0.3)
95.3
-
-
-
-
-
-
(0.7)
-
(0.7)
-
(0.7)
-
-
-
-
-
0.4
-
-
0.4
-
0.4
-
-
-
-
-
-
-
(21.0)
(21.0)
-
(21.0)
Share
Capital
US$m
Balance at 1 Jul 2014
Profit for the period
Capital
Reserve
Share
Based
Payment
US$m
Total
US$m
NonControlling
Interests
US$m
Total
Equity
US$m
-
-
-
-
-
0.4
(0.7)
(21.0)
(21.3)
-
(21.3)
273.6
654.2
(42.5)
0.6
(1.6)
3.1
(41.0)
334.4
1,180.8
(2.2)
1,178.6
Page 6 of 12
Statement of Changes in Equity – Company
Share
Capital
US$m
Contributed
Surplus
US$m
Capital
Reserve
Share Based
Payment
US$m
Equity
Compensation
Reserve
US$m
ESOS
Reserve
US$m
Retained
Earnings
US$m
Total
US$m
273.6
654.2
(1.6)
2.9
(42.2)
402.7
1,289.6
Profit for the period
-
-
-
-
-
124.5
124.5
Other comprehensive income
-
-
-
-
-
-
-
Total comprehensive income for the period, net of
income tax
-
-
-
-
-
124.5
124.5
Purchase of shares of the Company for ESOS 2008
-
-
-
-
(4.0)
-
(4.0)
First and final dividend of SGD0.020 per share for
the year ended 30 June 2014
-
-
-
-
-
(20.1)
(20.1)
Balance at 31 December 2014
273.6
654.2
(1.6)
2.9
(46.2)
507.1
1,390.0
Balance at 1 Jul 2013
Balance at 1 Jul 2014
Transactions with owners, recorded directly in equity:
273.6
654.2
(1.6)
2.7
(40.3)
373.7
1,262.3
Profit for the period
-
-
-
-
-
67.8
67.8
Other comprehensive income
-
-
-
-
-
-
-
Total comprehensive income for the period, net of
income tax
-
-
-
-
-
67.8
67.8
Purchase of shares of the Company for ESOS 2008
-
-
-
-
(0.7)
-
(0.7)
First and final dividend of SGD0.020 per share for
the year ended 30 June 2013
-
-
-
-
-
(21.0)
(21.0)
273.6
654.2
(1.6)
2.7
(41.0)
420.5
1,308.4
Transactions with owners, recorded directly in equity:
Balance at 31 December 2013
1(d)(ii) Details of any changes in the company's share capital arising from rights issue, bonus issue, share
buy-backs, exercise of share options or warrants, conversion of other issues of equity securities,
issue of shares for cash or as consideration for acquisition or for any other purpose since the end
of the previous period reported on. State also the number of shares that may be issued on
conversion of all the outstanding convertibles, as well as the number of shares held as treasury
shares, if any, against the total number of issued shares excluding treasury shares of the issuer, as
at the end of the current financial period reported on and as at the end of the corresponding period
of the immediately preceding financial year
Half-Year ended
31 December 2014
Issued Shares & Share Options
(a) Issued and fully paid ordinary shares:
As at 1 July and 31 December 2014
1,368,063,633
(b) Grant of share options under ESOS 2008:
As at 1 July 2014
Options lapsed
As at 31 December 2014
70,400,000
(1,000,000)
69,400,000
Page 7 of 12
As at
31 Dec 2014
Number of shares held in the ESOS Trust to be transferred to
eligible employees to satisfy the outstanding share options under
the ESOS 2008
68,295,000
As at
31 Dec 2013
61,966,000
There was no change in the Company’s share capital since the immediate preceding financial period
reported on.
1(d)(iii) To show the total number of issued shares excluding treasury shares as at the end of the current
financial period and as at the end of the immediately preceding year.
As at
31 Dec 2014
Total issued ordinary shares
Less: No. of shares acquired by the ESOS Trust for ESOS
2008
Total issued ordinary shares excluding shares acquired by the
ESOS Trust for ESOS 2008
As at
30 June 2014
1,368.1 million
1,368.1 million
(68.3) million
(63.9) million
1,299.8 million
1,304.2 million
1(d)(iv) A statement showing all sales, transfers, disposal, cancellation and/or use of treasury shares as at
the end of the current financial period reported on.
Not applicable
2.
Whether the figures have been audited, or reviewed and in accordance with which auditing standard
or practice
These figures have not been audited nor reviewed by the Group’s auditors.
3.
Where the figures have been audited or reviewed, the auditors’ report (including any qualifications
or emphasis of a matter)
Not applicable.
4.
Whether the same accounting policies and methods of computation as in the issuer’s most recently
audited annual financial statements have been applied
The same accounting policies as in the Group’s audited financial statements for the year ended 30 June
2014 have been consistently applied.
5.
If there are any changes in the accounting policies and methods of computation, including any
required by an accounting standard, what has changed, as well as the reasons for, and the effect of,
the change.
Not applicable.
Page 8 of 12
6.
Earnings per ordinary share of the group for the current financial period reported on and the
corresponding period of the immediately preceding financial year, after deducting any provision for
preference dividends.
Basic earnings per share (US cents)
Diluted earnings per share (US cents)
Group Unaudited
st
1 Half
1 Jul to
1 Jul to
2
1
31 Dec 14 31 Dec 13
2.3
2.4
Group Unaudited
nd
2 Quarter
1 Oct to
1 Oct to
31 Dec 14 31 Dec 13
1.0
1.1
2.3
2.4
1.1
1.0
1
Based on the weighted average number of ordinary shares in issue after adjusting for the shares held by
the ESOS Trust for ESOS 2008, being 1,302.3 million shares.
2
Based on the weighted average number of ordinary shares in issue after adjusting for the shares held by
the ESOS Trust for ESOS 2008, being 1,311.8 million shares.
7.
Net asset value (for the issuer and group) per ordinary share based on issued share capital of the
issuer at the end of the:(a) current financial period reported on; and
(b) immediately preceding financial year.
Net assets per share (US cents)
The Group
The Company
Audited
Unaudited
st
Full Year
1 Half
2
1
30 June 14
31 Dec 14
93.3
86.5
106.7
98.8
1
Based on the weighted average number of ordinary shares in issue after adjusting for the shares held by
the ESOS Trust for ESOS 2008, being 1,302.3 million shares.
2
2 Based on the weighted average number of ordinary shares in issue after adjusting for the shares held by
the ESOS Trust for ESOS 2008, being 1,315.4 million shares.
8.
A review of the performance of the group, to the extent necessary for a reasonable understanding of
the group’s business. It must include a discussion of the following:(a) any significant factors that affected the turnover, costs, and earnings of the group for the
current financial period reported on, including (where applicable) seasonal or cyclical factors; and
(b) any material factors that affected the cash flow, working capital, assets or liabilities of the group
during the current financial period reported on
U
Income Statement
Profit after tax for the half-year stood at US$31.2 million, an increase of 4.0% as compared to US$30.0
million in the previous corresponding period. The following review sets out the factors that affected profit
after tax for the period:
Revenue
Revenue decreased by 6.5% to US$200.6 million year-on-year due mainly to lower revenue generated from
both gaming and property development segments. The volatility in the gaming sector will continue to affect
overall revenue performance. Hotel revenue was stable as compared to previous corresponding period.
Bass Strait oil and gas royalty
Income from the Bass Strait oil and gas royalty in Australia increased by 5.4% principally due to higher
royalties received as a result of higher oil production compared to previous corresponding period.
Gain on disposal of investments/assets
The decrease in gain on disposal of investments/assets was mainly due to sale of a casino licence by
Clermont Leisure UK in the previous corresponding period.
Page 9 of 12
Direct costs of raw materials, consumables and services
The decrease in direct costs of raw materials, consumables and services for the half-year by 5.3% was due
mainly to lower gaming duty in tandem with the decrease in revenue from gaming sector during the period.
U
Personnel expenses
The implementation of the new VCGM management model at the Group’s hotel operations has
decentralised decision-making and resulted in significant cost savings at central support office.
U
Other operating expenses
The decrease in other operating expenses for the half-year reflecting overall cost disciplines for the group
and transformation cost incurred during the start-up stage in the previous corresponding period.
Income tax expense
The decrease in income tax expense was mainly due to higher tax provision on property development
segment in the previous corresponding period.
Statement of Comprehensive Income
Total comprehensive loss for the half-year was US$66.6 million. This included a net foreign exchange
translation loss of US$93.0 million as a result of translating the books of the Group’s UK subsidiaries and
the Bass Strait oil and gas royalty rights which are denominated in GBP and AUD respectively into the
Group’s reporting currency, which is USD. The GBP and AUD as at 31 December 2014 depreciated against
the USD by 8.5% and 12.8% respectively as compared to 30 June 2014.
Statement of Financial Position
The Group’s net assets before non-controlling interests decreased by 7.4% from US$1,217.3 million as at
30 June 2014 to US$1,126.8 million as at 31 December 2014. This is mainly attributable to net foreign
exchange translation loss referred to above.
Excluding the effects of currency translation, other significant factors that affected the Group’s net assets as
at 31 December 2014 were as follows:
a)
b)
c)
d)
e)
f)
Trade and other receivables – decrease was primarily due to lower outstanding debts and prepayments
for the hotel segment during the half-year.
Cash and cash equivalents – decrease was mainly due to lower operational receipt from gaming
operation and higher shares purchase of the Company for ESOS 2008 during the half-year.
Short term loans and borrowings – decrease was due to redemption of mortgaged debenture stock.
Trade and other payables – decrease was mainly due to scheduled settlement of creditor liabilities.
Long term loans and borrowings – increase was due to draw down of bank loan facility for redemption
of the mortgaged debenture stock.
Provisions – decrease was due to actual pension payments made during the period.
Statement of Cash Flows
A negative net cash flow of US$15.4 million was recorded for the half-year as compared with negative net
cash flow of US$8.9 million in the previous corresponding period. This was primarily due to lower cash flow
from gaming operations as well as higher share purchases for ESOS 2008 during the period. However, this
was offset by lower repayment of short term loan and borrowings.
9.
Where a forecast, or a prospect statement, has been previously disclosed to shareholders, any
variance between it and the actual results
The Group has not previously released any forecast or prospect statements.
Page 10 of 12
10.
A commentary at the date of the announcement of the significant trends and competitive conditions
of the industry in which the group operates and any known factors or events that may affect the
group in the next reporting period and the next 12 months
The group’s first hotel under its new “Amba” brand, the Amba Hotel Charing Cross, was launched in the
final quarter of 2014. The first hotel under the group’s new “every” brand is on track to be launched in first
quarter of 2015. The refurbishment of our hotels is expected to continue over the next 12 months. The
impact of rooms not available for sale due to the refurbishment will continue to be felt over this period.
Average occupancy for the London hotel market is expected to remain stable, with average room rates
rising at modest levels.
The Pound Sterling has fallen against the US Dollar by more than 10% from the beginning of the financial
year. This continues to impact our revenues, assets and liabilities, which are predominantly denominated in
Pound Sterling.
Global oil prices have declined significantly over the past six months. To date, this has not affected the
group’s revenue from its oil and gas royalty as the group receives the payments one quarter in arrears.
However, it is expected that the royalty will be much lower in the coming quarters due to significantly lower
oil prices and a weaker Australian Dollar.
The group refinanced its £138 million mortgaged debenture stock in December 2014 with a floating rate
term loan. Based on prevailing benchmark rates, this is expected to result in interest cost savings for the
group.
11.
Dividend
(a) Current Financial Period Reported On
Any dividend declared for the current financial period reported on?
None
(b) Corresponding Period of the Immediately Preceding Financial Year
Any dividend declared for the corresponding period of the immediately preceding financial year?
None
(c) Date payable
Not applicable.
(d) Books closure date
Not applicable.
12.
If no dividend has been declared/recommended, a statement to that effect
No dividend has been declared/recommended.
13.
If the group has obtained a general mandate from shareholders for IPTs, the aggregate value of
such transactions as required under Rule 920(1)(a)(ii). If no IPT mandate has been obtained, a
statement to that effect.
The Group does not have a general mandate from shareholders for interested person transactions.
14.
Confirmation by the Board of Directors
The Directors confirm that, to the best of their knowledge, nothing has come to the attention of the Board of
Directors which may render the unaudited consolidated financial statements of GuocoLeisure Limited for
the half-year ended 31 December 2014 to be false or misleading in any material aspect.
Page 11 of 12
BY ORDER OF THE BOARD
Susan Lim
Group Company Secretary
2 February 2015
Page 12 of 12
© Copyright 2026
