
EUROSTAT: Euro area unemployment rate at 11.4%
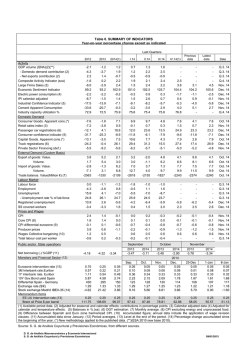
20/2015 - 30 January 2015
December 2014
Euro area unemployment rate at 11.4%
EU28 at 9.9%
The euro area1 (EA18) seasonally-adjusted2 unemployment rate3 was 11.4% in December 2014, down from 11.5%
in November 20144, and from 11.8% in December 2013. This is the lowest rate recorded in the euro area since
August 2012. The EU281 unemployment rate was 9.9% in December 2014, down from 10.0% in November 2014
and from 10.6% in December 2013. This is the first time the rate for the EU28 has fallen below 10.0% since
October 2011. These figures are published by Eurostat, the statistical office of the European Union.
Eurostat estimates that 24.056 million men and women in the EU28, of whom 18.129 million were in the euro area,
were unemployed in December 2014. Compared with November 2014, the number of persons unemployed
decreased by 228 000 in the EU28 and by 157 000 in the euro area. Compared with December 2013,
unemployment fell by 1.710 million in the EU28 and by 693 000 in the euro area.
Member States
Among the Member States, the lowest unemployment rates in December 2014 were recorded in Germany (4.8%)
and Austria (4.9%), and the highest in Greece (25.8% in October 2014) and Spain (23.7%).
Compared with a year ago, the unemployment rate in December 2014 fell in twenty-four Member States, remained
stable in Belgium and increased in Finland (8.3% to 8.9%), Italy (12.6% to 12.9%) and France (10.2% to 10.3%).
The largest decreases were registered in Estonia (9.0% to 6.6% between November 2013 and November 2014),
Bulgaria (12.8% to 10.8%), Greece (27.8% to 25.8% between October 2013 and October 2014), Hungary (9.3%
to 7.3% between November 2013 and November 2014) and Poland (10.0% to 8.0%).
In December 2014, the unemployment rate in the United States was 5.6%, down from 5.8% in November 2014,
and from 6.7% in December 2013.
Unemployment rates in December 2014, seasonally adjusted
30
25.8
23.7
25
20
16.4 16.4
% 15
10
5
4.8 4.9
5.8 5.8 5.9 5.9 6.4 6.4 6.6
11.4
10.3 10.5 10.7 10.8
9.4 9.7 9.9
8.4 8.9
8.0
7.8
6.7 7.3
12.5 12.9 13.4
* October 2014
** November 2014
*** Q3 2014
EL*
ES
CY
HR
PT
IT
SK
EA18
BG
LV***
IE
FR
EU28
SI
LT
FI
BE
PL
SE
HU**
NL
RO
EE**
DK
UK*
LU
MT
CZ
AT
DE
0
Youth unemployment
In December 2014, 4.960 million young persons (under 25) were unemployed in the EU28, of whom 3.289 million
were in the euro area. Compared with December 2013, youth unemployment decreased by 464 000 in the EU28
and by 168 000 in the euro area. In December 2014, the youth unemployment rate5 was 21.4% in the EU28 and
23.0% in the euro area, compared with 23.1% and 23.9% respectively in December 2013. In December 2014, the
lowest rates were observed in Germany (7.2%), Austria (9.0%) and the Netherlands (9.6%), and the highest in
Spain (51.4%), Greece (50.6% in October 2014), Croatia (44.8% in the fourth quarter 2014) and Italy (42.0%).
1. Up to 31 December 2014, the euro area (EA18) included Belgium, Germany, Estonia, Ireland, Greece, Spain, France, Italy,
Cyprus, Latvia, Luxembourg, Malta, the Netherlands, Austria, Portugal, Slovenia, Slovakia and Finland. From 1 January
2015 the euro area (EA19) also includes Lithuania.
The EU28 includes Belgium (BE), Bulgaria (BG), the Czech Republic (CZ), Denmark (DK), Germany (DE), Estonia (EE),
Ireland (IE), Greece (EL), Spain (ES), France (FR), Croatia (HR), Italy (IT), Cyprus (CY), Latvia (LV), Lithuania (LT),
Luxembourg (LU), Hungary (HU), Malta (MT), the Netherlands (NL), Austria (AT), Poland (PL), Portugal (PT), Romania
(RO), Slovenia (SI), Slovakia (SK), Finland (FI), Sweden (SE) and the United Kingdom (UK).
As part of Eurostat's guidelines for the dissemination of data when the euro area is enlarged, the aggregate data series
commented on in this News Release refer to the official composition of the euro area in the most recent month for which
data is available. Thus News Releases with data for months up to December 2014 comment on EA18 series, while
Releases with data for January 2015 onwards will comment on EA19 series.
Eurostat's guidelines can be found on the Eurostat website:
http://ec.europa.eu/eurostat/en/web/products-eurostat-news/-/GUIDE_ENLARG_2007
The tables also include Iceland, Norway and the United States.
2. Non-seasonally adjusted and trend data can be found in the statistical database on the Eurostat website. For further details
please refer to the Unemployment statistics article in Statistics Explained:
http://ec.europa.eu/eurostat/statistics-explained/index.php/Unemployment_statistics
3. Eurostat produces harmonised unemployment rates for individual EU Member States, the euro area and the EU. These
unemployment rates are based on the definition recommended by the International Labour Organisation (ILO). The
measurement is based on a harmonised source, the European Union Labour Force Survey (LFS).
Based on the ILO definition, Eurostat defines unemployed persons as persons aged 15 to 74 who:
- are without work;
- are available to start work within the next two weeks;
- and have actively sought employment at some time during the previous four weeks.
The unemployment rate is the number of people unemployed as a percentage of the labour force. The labour force is the
total number of people employed plus unemployed. In this news release unemployment rates are based on employment and
unemployment data covering persons aged 15 to 74.
4. The data in this News Release are normally subject to small revisions, caused by the updates to the seasonally adjusted
series whenever new monthly data are added. Larger revisions can occur when the most recent LFS data are included in the
calculation process. Compared with the rates published in News Release 1/2015 of 7 January 2015, the November 2014
unemployment rates remain unchanged at 11.5% for the EA18 and at 10.0% for the EU28. Among Member States, rates
have been revised between 0.2 and 0.4 percentage points for Cyprus and Portugal.
5. The youth unemployment rate is the number of people aged 15 to 24 unemployed as a percentage of the labour force of the
same age. Therefore, the youth unemployment rate should not be interpreted as the share of jobless people in the overall
youth population. For further details please refer to the Youth unemployment article in Statistics Explained:
http://ec.europa.eu/eurostat/statistics-explained/index.php/Youth_unemployment
6. Latvia: quarterly data for all series.
Croatia, Cyprus, Romania and Slovenia: quarterly data for youth unemployment.
7. For Germany, the Netherlands, Austria, Finland, Sweden and Iceland the trend component is used instead of the more
volatile seasonally adjusted data. For Sweden and Iceland, seasonally adjusted data are available in the online data base on
the Eurostat website: http://ec.europa.eu/eurostat/data/database
8. For Denmark, Estonia, Hungary, the United Kingdom and Norway 3-month moving averages of LFS data are used instead of
pure monthly indicators.
Issued by: Eurostat Press Office
For further information on data:
Tim ALLEN
Tel: +352-4301-33 444
[email protected]
Sammy Lauritsen
Tel: +352-4301-35 742
Eurostat news releases on internet:
http://ec.europa.eu/eurostat
Hubertus VREESWIJK
Tel: +352-4301-34 323
[email protected]
Selected Principal European Economic Indicators: http://ec.europa.eu/eurostat/euroindicators
Follow Eurostat on Twitter: http://twitter.com/EU_Eurostat
Euro area and EU28 unemployment rates
Seasonally adjusted series
12.5
Euro area (EA18)
EU28
11.5
10.5
9.5
%
8.5
7.5
6.5
I II III IV I II III IV I II III IV I II III IV I II III IV I II III IV I II III IV I II III IV I II III IV I II III IV I II III IV I II III IV I II III IV I II III IV I II III IV
2000
2001
2002
2003
2004
2005
2006
2007
2008
2009
2010
2011
2012
2013
2014
Seasonally adjusted unemployment, totals
EA18
EA19
EU28
Belgium
Bulgaria
Czech Republic
Denmark8
Germany7
Estonia8
Ireland
Greece
Spain
France
Croatia
Italy
Cyprus
Latvia6
Lithuania
Luxembourg
Hungary8
Malta
Netherlands7
Austria7
Poland
Portugal
Romania
Slovenia
Slovakia
Finland7
Sweden7
United Kingdom8
Iceland7
Norway8
United States
: Data not available
Dec 13
11.8
11.8
10.6
8.4
12.8
6.7
7.2
5.1
9.0**
12.1
27.8*
25.6
10.2
17.1
12.6
16.5
11.7***
11.3
6.0
9.3**
6.5
7.0
5.0
10.0
15.2
7.0
9.9
14.0
8.3
8.0
7.1*
5.3
3.5**
6.7
* October 2013
Sep 14
11.5
11.5
10.0
8.6
11.4
5.8
6.5
5.0
7.4
11.0
26.0
24.0
10.3
16.7
13.0
16.2
10.7
9.7
6.0
7.3
5.8
6.5
5.1
8.5
13.3
6.7
9.7
12.9
8.8
7.8
5.9
4.8
3.7
5.9
Rates (%)
Oct 14
11.5
11.5
10.0
8.5
11.3
5.8
6.4
4.9
6.9
10.9
25.8
23.9
10.2
16.7
13.3
16.3
:
9.9
5.9
7.3
5.8
6.5
5.0
8.3
13.5
6.7
9.7
12.8
8.9
7.8
5.9
4.7
3.8
5.7
** November 2013
Nov 14
11.5
11.4
10.0
8.5
11.0
5.8
6.4
4.9
6.6
10.7
:
23.8
10.3
16.6
13.3
16.6
:
9.4
5.9
7.3
5.8
6.5
4.9
8.2
13.5
6.5
9.7
12.6
8.9
7.8
:
4.6
3.7
5.8
Dec 14
11.4
11.3
9.9
8.4
10.8
5.8
6.4
4.8
:
10.5
:
23.7
10.3
16.4
12.9
16.4
:
9.4
5.9
:
5.8
6.7
4.9
8.0
13.4
6.4
9.7
12.5
8.9
7.8
:
:
:
5.6
*** Q3 2013
Dec 13
18 822
18 987
25 766
416
433
353
206
2 133
61**
261
1350*
5 880
2 981
314
3 227
71
116***
165
16
406**
12
628
222
1 733
789
649
99
379
223
412
2 311*
10
89**
10 384
Number of persons (in thousands)
Sep 14
Oct 14
Nov 14
18 302
18 325
18 286
18 445
18 472
18 425
24 389
24 381
24 284
426
422
420
387
380
373
306
306
307
191
188
188
2 092
2 073
2 045
50
47
45
237
234
230
1 259
1 245
:
5 501
5 492
5 471
3 016
2 998
3 022
322
323
321
3 344
3 432
3 431
70
71
72
105
:
:
143
147
138
16
15
15
324
327
325
11
11
12
580
581
585
227
223
219
1 470
1 448
1 423
684
694
694
624
620
617
97
97
96
351
347
342
237
239
240
408
406
405
1 919
1 899
:
9
9
9
101
103
102
9 182
9 061
9 109
Dec 14
18 129
18 266
24 056
416
365
308
188
2 014
:
226
:
5 460
3 020
317
3 322
71
:
137
15
:
11
595
220
1 391
690
604
97
338
240
404
:
:
:
8 703
Seasonally adjusted youth (under 25s) unemployment
EA18
EA19
EU28
Belgium
Bulgaria
Czech Republic
Denmark8
Germany7
Estonia8
Ireland
Greece
Spain
France
Croatia6
Italy
Cyprus6
Latvia6
Lithuania
Luxembourg
Hungary8
Malta
Netherlands7
Austria7
Poland
Portugal
Romania6
Slovenia6
Slovakia
Finland7
Sweden7
United Kingdom8
Iceland7
Norway8
: Data not available
Dec 13
23.9
23.8
23.1
23.7
26.9
18.7
14.1
7.9
18.4
25.8
56.2
54.6
23.6
48.3
41.8
40.3
22.8
21.0
16.3
23.5
13.2
11.3
10.1
26.7
35.2
24.4
20.1
33.0
19.8
23.0
19.5
10.1
9.5
Sep 14
23.3
23.2
21.7
20.8
22.3
14.9
12.7
7.5
13.6
22.6
50.4
53.2
24.9
45.4
42.4
34.7
20.2
16.6
18.2
19.4
12.8
9.8
9.4
23.5
32.9
23.3
20.5
29.0
20.6
22.5
16.4
10.1
7.9
Rates (%)
Oct 14
23.3
23.2
21.7
21.1
21.8
14.2
11.6
7.4
13.8
22.2
50.6
52.4
25.1
44.8
42.8
32.8
:
17.5
18.3
19.5
12.7
9.7
9.8
23.3
33.2
:
24.1
29.3
20.8
22.5
16.7
10.0
7.8
Nov 14
23.3
23.2
21.6
21.6
21.6
14.9
11.4
7.3
13.4
21.8
:
51.8
25.3
44.8
43.0
32.8
:
15.5
18.4
18.9
13.2
9.7
9.5
23.1
33.4
:
24.1
29.2
21.0
22.5
:
9.9
7.4
Dec 14
23.0
23.0
21.4
21.9
21.6
14.3
11.0
7.2
:
21.6
:
51.4
25.2
44.8
42.0
32.8
:
16.5
18.2
:
13.2
9.6
9.0
22.6
34.5
:
24.1
28.9
21.2
22.5
:
:
:
Dec 13
3 457
3 484
5 424
96
57
66
61
337
11
53
171
906
653
74
685
17
21
27
3
76
4
160
59
395
134
168
14
69
66
154
889
3
36
Number of persons (in thousands)
Sep 14
Oct 14
Nov 14
3 331
3 327
3 331
3 353
3 352
3 353
5 034
5 028
5 029
85
85
87
46
45
44
52
51
53
58
53
52
314
309
305
8
8
7
44
42
42
157
156
:
837
833
826
693
704
712
76
78
78
696
690
697
15
14
14
17
:
:
22
25
22
3
3
3
64
65
63
4
4
4
136
136
136
55
57
55
337
333
330
125
123
123
160
:
:
14
17
17
61
61
61
68
69
70
150
149
149
731
739
:
3
3
3
29
28
28
Dec 14
3 289
3 312
4 960
88
43
51
50
301
:
41
:
824
706
78
664
14
:
24
3
:
4
135
53
324
127
:
17
60
71
149
:
:
:
Seasonally adjusted unemployment rates (%), by gender
EA18
EA19
EU28
Belgium
Bulgaria
Czech Republic
Denmark8
Germany7
Estonia8
Ireland
Greece
Spain
France
Croatia
Italy
Cyprus
Latvia6
Lithuania
Luxembourg
Hungary8
Malta
Netherlands7
Austria7
Poland
Portugal
Romania
Slovenia
Slovakia
Finland7
Sweden7
United Kingdom8
Iceland7
Norway8
: Data not available
Dec 13
11.7
11.7
10.6
8.8
13.8
5.6
6.7
5.4
9.1
13.6
24.5
24.9
10.3
16.8
12.0
17.6
12.3
12.4
6.1
8.4
6.7
7.4
4.9
9.4
15.2
7.7
9.3
14.1
8.9
8.2
7.4
5.5
3.7
Sep 14
11.3
11.3
9.9
8.8
12.4
4.8
6.7
5.3
7.9
12.3
23.2
23.0
10.4
15.9
12.2
17.6
11.4
10.8
5.9
7.1
6.1
6.6
5.6
7.9
12.5
7.1
9.0
12.4
9.6
8.1
6.2
4.7
4.0
Males
Oct 14
11.4
11.4
9.9
8.8
12.2
4.9
6.4
5.2
6.9
12.0
23.1
23.0
10.4
16.1
12.6
17.9
:
11.6
5.8
7.2
6.0
6.6
5.6
7.8
13.2
7.1
9.0
12.2
9.8
8.0
6.1
4.6
4.1
Nov 14
11.3
11.3
9.9
8.8
11.9
5.0
6.4
5.2
6.4
11.8
:
22.9
10.4
16.1
12.4
18.3
:
10.7
5.8
7.3
6.0
6.7
5.4
7.7
13.4
7.0
9.0
12.1
9.7
8.0
:
4.5
4.1
Dec 14
11.2
11.2
9.8
8.8
11.6
5.0
6.2
5.1
:
11.7
:
22.8
10.4
16.0
12.0
18.0
:
11.2
5.9
:
6.0
6.8
5.4
7.4
13.2
6.7
9.2
11.9
9.7
7.9
:
:
:
Dec 13
12.0
12.0
10.7
8.0
11.8
8.0
7.7
4.8
7.9
10.3
30.8
26.4
10.1
17.4
13.6
15.4
10.7
10.2
6.0
9.0
6.0
6.6
5.3
10.6
15.3
6.2
10.6
13.9
7.8
7.9
6.7
5.1
3.5
Sep 14
11.7
11.7
10.2
8.3
10.4
7.0
6.3
4.7
6.9
9.5
29.7
25.2
10.2
17.6
14.0
14.7
10.0
8.7
6.1
7.6
5.4
6.4
4.5
9.1
14.1
6.1
10.5
13.5
8.0
7.6
5.6
4.8
3.3
Females
Oct 14
11.6
11.6
10.1
8.3
10.2
6.9
6.5
4.6
6.9
9.4
29.2
25.0
10.0
17.4
14.3
14.7
:
8.2
6.1
7.5
5.4
6.4
4.4
9.0
13.9
6.1
10.5
13.4
8.0
7.6
5.5
4.8
3.4
Nov 14
11.6
11.6
10.1
8.2
10.0
6.9
6.4
4.5
6.8
9.3
:
24.7
10.2
17.1
14.6
14.8
:
8.1
6.1
7.3
5.4
6.3
4.4
8.8
13.7
5.9
10.4
13.3
8.0
7.6
:
4.8
3.3
Dec 14
11.5
11.5
10.0
8.0
9.9
6.8
6.6
4.5
:
9.1
:
24.6
10.2
16.8
14.1
14.7
:
7.8
6.0
:
5.4
6.5
4.4
8.7
13.7
6.0
10.3
13.2
8.1
7.6
:
:
:


© Copyright 2026