Household saving rate nearly stable at 13.1% in the euro
17/2015 - 28 January 2015
Third quarter of 2014
Household saving rate nearly stable at 13.1% in
the euro area and down to 10.3% in the EU28
Household real income per capita increased by 0.6% in the euro area
Announcement
As part of the process of improving timeliness, from April 2015 onwards the household News Release of
European sector accounts will be issued earlier (at around t+102 days) focussing on selected euro area nonfinancial transactions. It will be complemented by an additional News Release (at t+120 days) on real income and
real consumption per capita in the euro area. At the same time, the complete set of sectoral data will be updated
in the dedicated section of the Eurostat website.
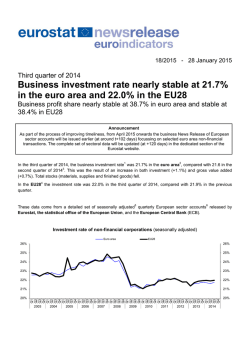
The household saving rate1 in the euro area2 was 13.1% in the third quarter of 2014, compared with 13.0% in the
second quarter of 20143. In the EU284, the household saving rate dropped to its record-low level, at 10.3%
compared with 10.5% the previous quarter.
These data come from a detailed set of seasonally adjusted5 quarterly European sector accounts6 released by
Eurostat, the statistical office of the European Union and the European Central Bank (ECB).
Household saving rate (seasonally adjusted)
16%
Euro area
16%
EU28
15%
14%
14%
13%
13%
12%
12%
11%
11%
10%
10%
Q1
Q2
Q3
Q4
Q1
Q2
Q3
Q4
Q1
Q2
Q3
Q4
Q1
Q2
Q3
Q4
Q1
Q2
Q3
Q4
Q1
Q2
Q3
Q4
Q1
Q2
Q3
Q4
Q1
Q2
Q3
Q4
Q1
Q2
Q3
Q4
Q1
Q2
Q3
Q4
Q1
Q2
Q3
Q4
Q1
Q2
Q3
Q4
15%
2003
2004
2005
2006
2007
2008
2009
2010
2011
2012
2013
2014
Household investment rate remained at low levels in both zones
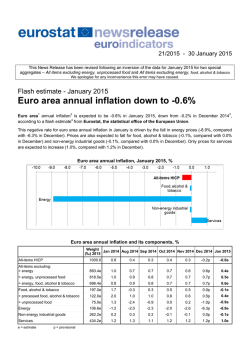
In the EU28, the household investment rate7 remained nearly stable at 7.9% in the third quarter of 2014, compared
with 7.8% in the second quarter of 2014. In the euro area, the household investment rate was 8.3%, stable
compared with the previous quarter.
Household investment rate (seasonally adjusted)
Euro area
12%
EU28
12%
11%
10%
10%
9%
9%
8%
8%
7%
7%
Q1
Q2
Q3
Q4
Q1
Q2
Q3
Q4
Q1
Q2
Q3
Q4
Q1
Q2
Q3
Q4
Q1
Q2
Q3
Q4
Q1
Q2
Q3
Q4
Q1
Q2
Q3
Q4
Q1
Q2
Q3
Q4
Q1
Q2
Q3
Q4
Q1
Q2
Q3
Q4
Q1
Q2
Q3
Q4
Q1
Q2
Q3
Q4
11%
2003
2004
2005
2006
2007
2008
2009
2010
2011
2012
2013
2014
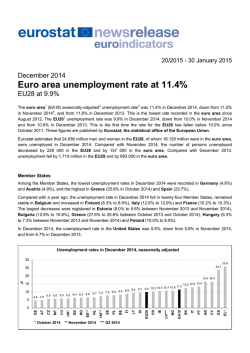
In the euro area in the third quarter of 2014, in nominal terms, household income8 rose by 0.7%, consumption by
0.6% and investment (gross fixed capital formation, mostly in dwellings) by 1.2%.
Nominal growth of household adjusted gross disposable income, actual final consumption and
gross fixed capital formation (euro area)
(seasonally adjusted data, change compared with the previous quarter)
6%
6%
5%
5%
4%
4%
3%
3%
2%
2%
1%
1%
0%
0%
-1%
-1%
Adjusted gross disposable income in current prices
-2%
-2%
Gross fixed capital formation in current prices
-3%
-3%
Actual final consumption in current prices
-4%
-5%
-5%
-6%
-6%
Q1
Q2
Q3
Q4
Q1
Q2
Q3
Q4
Q1
Q2
Q3
Q4
Q1
Q2
Q3
Q4
Q1
Q2
Q3
Q4
Q1
Q2
Q3
Q4
Q1
Q2
Q3
Q4
Q1
Q2
Q3
Q4
Q1
Q2
Q3
Q4
Q1
Q2
Q3
Q4
Q1
Q2
Q3
Q4
Q1
Q2
Q3
Q4
-4%
2003
2004
2005
2006
2007
2008
2009
2010
2011
2012
2013
2014
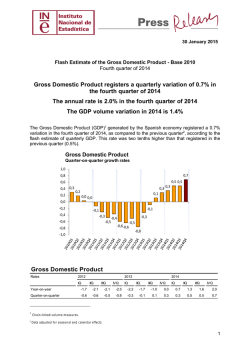
In the euro area, in nominal terms, the increase in household income (+0.7%) was mainly due to the positive
contributions of wages9 and social benefits (both +0.2 pp), but also gross operating surplus and mixed income, net
property income and other transfer, taxes and social transfers in kind contributed positively (+0.1 pp each).
Contributions of components to the nominal growth of household adjusted gross disposable
income (euro area)
(seasonally adjusted data, change compared with the previous quarter)
Wages (received)
Net property income and other current transfers
Taxes (-)
Adjusted gross disposable income in current prices
Gross operating surplus and mixed income
Social benefits
Social transfers in kind
2%
1%
1%
0%
0%
-1%
-1%
-2%
-2%
Q1
Q2
Q3
Q4
Q1
Q2
Q3
Q4
Q1
Q2
Q3
Q4
Q1
Q2
Q3
Q4
Q1
Q2
Q3
Q4
Q1
Q2
Q3
Q4
Q1
Q2
Q3
Q4
Q1
Q2
Q3
Q4
Q1
Q2
Q3
Q4
Q1
Q2
Q3
Q4
Q1
Q2
Q3
Q4
Q1
Q2
Q3
Q4
2%
2003
2004
2005
2006
2007
2008
2009
2010
2011
2012
2013
2014
Household real income per capita increased in the euro area
In the euro area, in real terms, household income per capita10 grew by 0.6% in the third quarter of 2014, after an
increase of 0.3% in the previous quarter. This was the result of nominal income per capita (+0.6%) increasing at a
higher pace than prices (+0.1%). Household real consumption per capita increased by 0.5%.
Growth of household adjusted gross disposable income per capita, in nominal and real terms,
and of the deflator of final consumption expenditure (euro area)
(seasonally adjusted data, change compared with the previous quarter)
Adjusted gross disposable income (per capita), in nominal term
2%
2%
Deflator of final consumption expenditure
Adjusted gross disposable income (per capita), in real term
1%
0%
0%
-1%
-1%
-2%
-2%
Q1
Q2
Q3
Q4
Q1
Q2
Q3
Q4
Q1
Q2
Q3
Q4
Q1
Q2
Q3
Q4
Q1
Q2
Q3
Q4
Q1
Q2
Q3
Q4
Q1
Q2
Q3
Q4
Q1
Q2
Q3
Q4
Q1
Q2
Q3
Q4
Q1
Q2
Q3
Q4
Q1
Q2
Q3
Q4
Q1
Q2
Q3
Q4
1%
2003
2004
2005
2006
2007
2008
2009
2010
2011
2012
2013
2014
1. The gross saving rate of households (household saving rate) is defined as gross saving divided by gross disposable income,
with the latter including the change in the net equity of households in pension funds reserves. Gross saving is the part of the
gross disposable income which is not spent as final consumption expenditure. Therefore, the saving rate increases when
gross disposable income grows at a higher rate than final consumption expenditure.
2. Until 31 December 2014 the euro area (EA18) consisted of 18 Member States: Belgium, Germany, Estonia, Ireland, Greece,
Spain, France, Italy, Cyprus, Latvia, Luxembourg, Malta, the Netherlands, Austria, Portugal, Slovenia, Slovakia and Finland,
plus the European Central Bank and European Stability Mechanism. From 1 January 2015 the euro area (EA19) also
includes Lithuania.
As part of Eurostat's guidelines for the dissemination of data when the euro area is enlarged, the aggregate data series
commented on in this News Release refer to the official composition in the most recent quarter for which data are available.
Thus News Releases with data for quarters up to the fourth quarter of 2014 comment on EA18 series, while Releases with
data for the first quarter of 2015 onwards will comment on EA19 series. Data for EA19 will be published in July 2015 (first
release of sector accounts for the first quarter of 2015).
Eurostat's guidelines can be found on the Eurostat website:
http://ec.europa.eu/eurostat/en/web/products-eurostat-news/-/GUIDE_ENLARG_2007
3. Compared with News Release 12/2015 of 20 January 2015, both the household saving rate and the household investment
rate for the third quarter of 2014 remain unchanged in the euro area. Compared with News Release 162/2014 of 27 October
2014 the household saving rate for the second quarter of 2014 has been revised from 12.9% to 13.0% in the euro area and
from 10.4% to 10.5% in the EU28. The household investment rate has been revised from 8.2% to 8.3% in the euro area and
remains unchanged at 7.8% in the EU28.
4. The European Union (EU28) consists of 28 Member States: Belgium, Bulgaria, the Czech Republic, Denmark, Germany,
Estonia, Ireland, Greece, Spain, France, Croatia, Italy, Cyprus, Latvia, Lithuania, Luxembourg, Hungary, Malta, the
Netherlands, Austria, Poland, Portugal, Romania, Slovenia, Slovakia, Finland, Sweden and the United Kingdom plus the EU
institutions.
5. Seasonal adjustment has been performed using the Tramo-Seats method. The seasonally adjusted series are built up
indirectly as the sum of seasonally adjusted components.
6. The compilation of the European sector accounts follows the European System of Accounts 2010 (ESA2010) and covers
the period from the first quarter of 1999 to the third quarter of 2014.
Institutional sectors bring together economic units with broadly similar characteristics and behaviour, namely: households
(including non-profit institutions serving households), non-financial corporations, financial corporations, government and the
rest of the world. In the latter, to measure the external transactions of the euro area / EU, it is necessary to remove crossborder flows within the area concerned.
The ECB and Eurostat publish integrated non-financial and financial accounts, including financial balance sheets, for the
euro area. Eurostat also publishes the non-financial accounts of the European Union.
Eurostat's website includes detailed annual sector accounts by country and derived key indicators, which also include the
indicators that combine non-financial and financial accounts such as debt-to-income ratios.
The full set of quarterly sector accounts is published for euro area / EU aggregates only. However, some of the Member
States' data are available in the Eurostat database and a subset of quarterly key indicators is published around 102 days
after each quarter at http://ec.europa.eu/eurostat/sectoraccounts (see "Quarterly data") for 15 out of the 18 members of the
European Economic Area (EEA) whose GDP is above 1% of the EU total, subject to availability. The other 13 EEA
members, whose GDP is below 1% of the EU total, do not have to transmit the quarterly accounts of households to Eurostat.
General information on European sector accounts compilation is given in the metadata file available at:
http://ec.europa.eu/eurostat/cache/metadata/en/nasq_10_nf_tr_esms.htm
For detailed data and methodology, please see Eurostat's website at: http://ec.europa.eu/eurostat/sectoraccounts and
ECB's website at: http://www.ecb.eu/stats/acc/html/index.en.html.
7. The gross investment rate of households (household investment rate) is defined as gross fixed capital formation divided by
gross disposable income, with the latter being adjusted for the change in the net equity of households in pension funds
reserves. Household investment mainly consists of the purchase and renovation of dwellings.
8. In this release, household income / consumption refer to the adjusted gross disposable income / actual final consumption of
households including the value of goods and services (e.g. in education and health) financed by government. The amount of
goods and services financed by government are recorded under 'social transfers in kind'.
9. In this release, wages exclude social contributions paid either by employees or by employers.
10. Household real income per capita is defined as the adjusted gross disposable income of households, in nominal terms,
divided by the total population (source: National Accounts) and by the deflator (price index) of household final consumption
expenditure.
Issued by: Eurostat Press Office
For further information:
Tim ALLEN
Tel: +352-4301-33 444
[email protected]
Leonidas AKRITIDIS
Filippo GREGORINI
Enrico INFANTE
Eurostat news releases on the internet:
http://ec.europa.eu/eurostat
Tel: +352- 4301- 38582
[email protected]
Selected Principal European Economic Indicators: http://ec.europa.eu/eurostat/euroindicators
Follow Eurostat on Twitter: http://twitter.com/EU_Eurostat
Table 1: Key indicators of the euro area (EA18) and of the European Union (EU28)
2003
2004
2005
2006
2007
2008
2009
2010
2011
2012
2013
2014
Q1
Q2
Q3
Q4
Q1
Q2
Q3
Q4
Q1
Q2
Q3
Q4
Q1
Q2
Q3
Q4
Q1
Q2
Q3
Q4
Q1
Q2
Q3
Q4
Q1
Q2
Q3
Q4
Q1
Q2
Q3
Q4
Q1
Q2
Q3
Q4
Q1
Q2
Q3
Q4
Q1
Q2
Q3
Q4
Q1
Q2
Q3
14.2
17.0
12.7
14.8
13.8
17.2
12.5
14.5
13.1
16.7
11.2
14.1
11.9
16.3
11.2
13.8
12.4
16.8
10.7
13.1
11.9
17.1
11.1
13.9
13.7
18.3
12.6
14.6
12.5
16.9
10.7
13.2
11.5
16.8
10.3
13.3
11.7
16.5
10.6
12.6
11.9
16.0
10.9
13.4
11.9
15.6
11.1
14.9
14.6
14.8
14.7
14.6
14.6
14.6
14.2
14.2
13.9
13.4
13.7
13.2
13.2
13.6
13.5
13.7
13.3
13.3
13.2
13.2
13.4
13.4
14.1
15.0
14.9
14.8
14.4
13.9
13.5
13.1
12.9
12.9
13.2
12.8
13.3
12.9
13.1
13.0
12.6
13.1
13.1
13.1
13.1
13.2
13.0
13.1
9.8
10.1
10.4
10.2
9.9
10.2
10.5
10.4
10.0
10.5
11.0
10.8
10.7
10.8
11.4
11.3
11.1
11.2
11.6
11.2
10.9
10.7
10.9
10.1
9.4
9.3
9.3
9.1
8.7
9.2
9.5
9.1
8.9
9.0
9.3
9.0
8.6
8.7
9.0
8.6
8.0
8.4
8.7
8.3
8.2
8.3
8.6
10.0
10.0
10.1
10.2
10.2
10.2
10.2
10.4
10.3
10.6
10.6
10.8
11.0
10.9
11.0
11.3
11.4
11.3
11.2
11.1
11.2
10.8
10.5
10.1
9.7
9.3
9.1
9.1
9.0
9.3
9.2
9.1
9.2
9.1
9.0
8.9
8.8
8.7
8.7
8.6
8.3
8.4
8.4
8.3
8.4
8.3
8.3
12.3
15.3
10.8
12.9
11.2
15.0
10.5
12.0
10.9
14.4
9.0
11.8
10.0
13.9
8.7
11.4
10.1
14.1
8.4
10.7
9.3
14.6
8.4
12.0
11.3
16.5
10.9
13.3
10.8
15.4
9.5
11.6
9.6
14.9
8.6
11.6
9.6
14.6
8.9
10.7
9.6
14.1
8.8
11.1
9.5
13.3
8.2
13.1
12.8
12.8
12.7
12.2
12.3
12.5
11.7
12.2
11.6
11.0
11.4
11.5
10.8
10.9
11.0
11.6
10.8
10.8
10.6
10.8
11.1
10.5
12.0
12.7
13.3
13.1
13.1
12.2
12.0
11.7
11.4
11.0
11.4
11.0
11.6
10.9
11.2
11.1
10.7
10.9
11.0
10.9
10.9
10.8
10.5
10.3
9.2
9.3
9.9
9.8
9.5
9.5
10.0
9.9
9.4
9.8
10.4
10.3
10.1
10.1
10.6
10.5
10.4
10.4
10.9
10.5
10.1
9.9
10.1
9.4
8.7
8.5
8.6
8.3
7.9
8.4
8.8
8.5
8.1
8.2
8.6
8.4
7.9
8.0
8.2
8.0
7.4
7.8
8.2
7.9
7.6
7.8
8.1
Seasonally
adjusted
Not seasonally
adjusted
Seasonally
adjusted
European Union (EU28)
Saving rate, %
Investment rate, %
Not seasonally
adjusted
Seasonally
adjusted
Not seasonally
adjusted
Seasonally
adjusted
Not seasonally
adjusted
Euro area (EA18)
Saving rate, %
Investment rate, %
9.5
9.4
9.6
9.7
9.8
9.7
9.7
9.8
9.6
9.9
10.1
10.2
10.3
10.3
10.3
10.5
10.7
10.6
10.5
10.5
10.4
10.1
9.7
9.4
8.9
8.5
8.3
8.3
8.2
8.5
8.4
8.4
8.4
8.3
8.3
8.3
8.2
8.0
7.9
7.9
7.7
7.8
7.9
7.8
7.9
7.8
7.9
Table 2: Household adjusted gross disposable income and its components in the euro area (EA18)
2003
2004
2005
2006
2007
2008
2009
2010
2011
2012
2013
2014
Q1
Q2
Q3
Q4
Q1
Q2
Q3
Q4
Q1
Q2
Q3
Q4
Q1
Q2
Q3
Q4
Q1
Q2
Q3
Q4
Q1
Q2
Q3
Q4
Q1
Q2
Q3
Q4
Q1
Q2
Q3
Q4
Q1
Q2
Q3
Q4
Q1
Q2
Q3
Q4
Q1
Q2
Q3
Q4
Q1
Q2
Q3
577296
580285
587681
590640
594244
599756
600978
605715
612210
615537
621874
630054
633933
644428
651093
660041
668193
675213
685267
694028
702342
707943
714259
711743
701471
701225
701471
705639
706966
710795
714617
719191
722029
727358
726979
729919
731130
731210
731835
728031
730466
731853
735130
739971
743456
747156
751121
317491
320658
325041
328381
331241
335899
337561
340715
342895
345583
347378
349498
357392
360123
366103
370881
372280
376836
381305
385715
389254
391065
388525
379876
365734
366579
367034
366702
367206
366222
368440
374652
380525
384387
383509
383150
378148
378486
380558
379239
381371
384025
387768
385511
389424
388281
389270
200722
197697
200847
200726
203604
204840
206201
208706
211246
213227
218577
219588
221517
225759
229519
232068
235264
238763
238648
240622
242492
243124
241680
237820
237931
227050
220894
217520
214869
215446
215994
216212
219281
224933
227194
227553
231946
231443
227267
227913
227383
226375
227153
226563
226452
229466
230618
341691
345967
350493
351421
356021
357782
360103
362167
365230
369054
370765
373306
378053
380744
382992
387083
388615
393243
396126
402933
404845
409292
416567
420043
432431
442831
446562
447926
450807
452076
452410
454976
456281
457652
459984
463030
466504
469118
472771
473815
478052
480837
481522
483719
485368
488719
493234
169843
170792
174360
176144
173328
175469
173784
177520
180898
181485
185523
185550
193403
195135
195947
200335
202914
209866
214676
218265
220757
223163
224991
224136
218897
214141
213885
214315
215109
217314
216464
220348
223141
223935
227066
227546
232562
235395
239261
240859
241584
243773
246637
245854
248592
249298
248204
1267358
1273815
1289702
1295025
1311782
1322808
1331058
1339783
1350683
1361917
1373071
1386896
1397492
1415918
1433760
1449739
1461438
1474187
1486669
1505034
1518176
1528261
1536041
1525346
1518670
1523543
1522075
1523472
1524739
1527225
1534998
1544683
1554975
1570396
1570600
1576106
1575165
1574861
1573170
1568139
1575688
1579317
1584936
1589910
1596109
1604324
1616039
231545
234019
236626
238492
240231
242354
244306
246880
250399
253554
257039
260906
264377
267990
270786
273205
275844
278486
282316
286336
289952
293950
297008
300690
304588
307887
311185
313015
314099
315124
315734
316407
316940
317626
318375
319186
319585
319685
319889
320391
322099
323902
325623
327270
328535
329832
331292
1498902
1507834
1526327
1533517
1552013
1565161
1575365
1586663
1601082
1615471
1630111
1647802
1661869
1683908
1704546
1722944
1737282
1752674
1768985
1791370
1808128
1822211
1833049
1826036
1823258
1831430
1833261
1836487
1838838
1842348
1850732
1861090
1871916
1888022
1888974
1895291
1894750
1894547
1893059
1888531
1897787
1903218
1910559
1917179
1924644
1934156
1947332
4660
4681
4732
4747
4798
4833
4856
4883
4921
4958
4996
5043
5081
5143
5199
5248
5284
5323
5363
5422
5467
5503
5529
5502
5491
5512
5513
5518
5523
5530
5551
5577
5608
5652
5650
5664
5660
5656
5647
5629
5655
5670
5688
5703
5723
5748
5784
Gross disposable
income including
the change in the
net equity in
pension funds
Adjusted gross
disposable income
per capita (in euro)
Adjusted gross
disposable income
Total
Taxes (-)
Social benefits
Net property
income and other
current transfers
Gross operating
surplus and mixed
income
Wages
(received)
Gross disposable income
Social transfers in
kind
(seasonally adjusted, millions of euro at current prices)
1281407
1288023
1304251
1310263
1326258
1337773
1345948
1355479
1366731
1378333
1390097
1403475
1413831
1433327
1450253
1464841
1477338
1490327
1502679
1522870
1537259
1548131
1555251
1546241
1538142
1542319
1542186
1542754
1543029
1545109
1553339
1562792
1572600
1588433
1589133
1594904
1594495
1594411
1591499
1587613
1594656
1598794
1605175
1609346
1616434
1624779
1636262
Table 3: Household adjusted gross disposable income and its components, in the euro area (EA18)
2007
2008
2009
2010
2011
2012
2013
2014
*
**
-1.6
0.6
2.1
1.0
-1.6
1.2
-1.0
2.2
1.9
0.3
2.2
0.0
4.2
0.9
0.4
2.2
1.3
3.4
2.3
1.7
1.1
1.1
0.8
-0.4
-2.3
-2.2
-0.1
0.2
0.4
1.0
-0.4
1.8
1.3
0.4
1.4
0.2
2.2
1.2
1.6
0.7
0.3
0.9
1.2
-0.3
1.1
0.3
-0.4
1.2
1.1
1.1
0.8
0.7
0.9
0.8
1.1
1.4
1.3
1.4
1.5
1.3
1.4
1.0
0.9
1.0
1.0
1.4
1.4
1.3
1.4
1.0
1.2
1.3
1.1
1.1
0.6
0.3
0.3
0.2
0.2
0.2
0.2
0.2
0.3
0.1
0.0
0.1
0.2
0.5
0.6
0.5
0.5
0.4
0.4
0.4
0.0
0.2
0.5
0.2
0.2
0.4
0.1
0.3
0.4
0.2
0.4
0.5
0.2
0.6
0.4
0.5
0.5
0.4
0.6
0.5
0.5
0.3
0.3
-0.1
-0.6
0.0
0.0
0.2
0.1
0.2
0.2
0.2
0.2
0.3
0.0
0.2
0.1
0.0
0.0
-0.2
0.1
0.1
0.2
0.3
0.2
0.2
0.2
0.1
0.2
0.3
0.2
0.2
0.3
0.1
0.2
0.1
0.2
0.1
0.1
0.5
0.2
0.4
0.3
0.1
0.3
0.3
0.2
0.2
0.1
-0.1
-0.5
-0.8
0.0
0.0
0.0
0.0
-0.1
0.1
0.3
0.3
0.2
0.0
0.0
-0.3
0.0
0.1
-0.1
0.1
0.1
0.2
-0.1
0.2
-0.1
0.1
0.3
-0.2
0.2
0.0
0.2
0.1
0.1
0.2
0.2
0.1
0.3
0.1
0.1
0.3
0.2
0.1
0.2
0.2
0.0
0.1
0.1
0.0
-0.1
-0.2
0.0
-0.6
-0.3
-0.2
-0.1
0.0
0.0
0.0
0.2
0.3
0.1
0.0
0.2
0.0
-0.2
0.0
0.0
-0.1
0.0
0.0
0.0
0.2
0.1
0.2
-0.1
-0.2
-0.1
0.2
-0.1
0.1
-0.2
-0.2
0.0
-0.2
0.0
-0.5
-0.1
0.0
-0.3
-0.1
-0.4
-0.3
-0.2
-0.1
-0.1
-0.1
0.0
0.3
0.3
0.0
0.0
0.0
-0.1
0.0
-0.2
-0.2
0.0
-0.2
0.0
-0.3
-0.1
-0.2
-0.1
0.0
-0.1
-0.2
0.0
-0.1
0.0
0.1
0.2
0.2
0.2
0.1
0.1
0.1
0.1
0.2
0.2
0.2
0.2
0.2
0.2
0.2
0.2
0.1
0.2
0.2
0.2
0.2
0.2
0.2
0.2
0.2
0.2
0.2
0.2
0.1
0.1
0.1
0.0
0.0
0.0
0.0
0.0
0.0
0.0
0.0
0.0
0.0
0.1
0.1
0.1
0.1
0.1
0.1
0.1
0.9
0.6
1.2
0.5
1.2
0.8
0.7
0.7
0.9
0.9
0.9
1.1
0.9
1.3
1.2
1.1
0.8
0.9
0.9
1.3
0.9
0.8
0.6
-0.4
-0.2
0.4
0.1
0.2
0.1
0.2
0.5
0.6
0.6
0.9
0.1
0.3
0.0
0.0
-0.1
-0.2
0.5
0.3
0.4
0.3
0.4
0.5
0.7
Nominal growth of the
adjusted gross disposable
income per capita
0.1
0.3
0.3
0.1
0.3
0.1
0.1
0.1
0.2
0.2
0.1
0.2
0.3
0.2
0.1
0.2
0.1
0.3
0.2
0.4
0.1
0.2
0.4
0.2
0.7
0.6
0.2
0.1
0.2
0.1
0.0
0.1
0.1
0.1
0.1
0.2
0.2
0.1
0.2
0.1
0.2
0.1
0.0
0.1
0.1
0.2
0.2
Social transfers in
kind
Gross operating
surplus and mixed
income
Net property income
and other current
transfers
Wages (received)
Social transfers in
kind
Taxes (-)
Social benefits
0.4
1.3
1.3
0.3
1.3
0.5
0.6
0.6
0.8
1.0
0.5
0.7
1.3
0.7
0.6
1.1
0.4
1.2
0.7
1.7
0.5
1.1
1.8
0.8
2.9
2.4
0.8
0.3
0.6
0.3
0.1
0.6
0.3
0.3
0.5
0.7
0.8
0.6
0.8
0.2
0.9
0.6
0.1
0.5
0.3
0.7
0.9
0.7
0.5
1.1
0.3
1.1
0.7
0.5
0.5
0.8
0.8
0.8
0.9
0.8
1.2
1.1
0.9
0.7
0.7
0.8
1.1
0.8
0.7
0.5
-0.5
-0.2
0.4
0.0
0.1
0.1
0.1
0.4
0.5
0.5
0.8
0.0
0.2
-0.1
-0.1
-0.2
-0.3
0.5
0.3
0.3
0.3
0.4
0.4
0.6
Real growth of the adjusted
gross disposable income
per capita
2006
2.4
-1.5
1.6
-0.1
1.4
0.6
0.7
1.2
1.2
0.9
2.5
0.5
0.9
1.9
1.7
1.1
1.4
1.5
0.0
0.8
0.8
0.3
-0.6
-1.6
0.0
-4.6
-2.7
-1.5
-1.2
0.3
0.3
0.1
1.4
2.6
1.0
0.2
1.9
-0.2
-1.8
0.3
-0.2
-0.4
0.3
-0.3
0.0
1.3
0.5
Growth of the deflator of
final consumption
expenditure**
2005
0.3
1.0
1.4
1.0
0.9
1.4
0.5
0.9
0.6
0.8
0.5
0.6
2.3
0.8
1.7
1.3
0.4
1.2
1.2
1.2
0.9
0.5
-0.6
-2.2
-3.7
0.2
0.1
-0.1
0.1
-0.3
0.6
1.7
1.6
1.0
-0.2
-0.1
-1.3
0.1
0.5
-0.3
0.6
0.7
1.0
-0.6
1.0
-0.3
0.3
Taxes
2004
0.1
0.5
1.3
0.5
0.6
0.9
0.2
0.8
1.1
0.5
1.0
1.3
0.6
1.7
1.0
1.4
1.2
1.1
1.5
1.3
1.2
0.8
0.9
-0.4
-1.4
0.0
0.0
0.6
0.2
0.5
0.5
0.6
0.4
0.7
-0.1
0.4
0.2
0.0
0.1
-0.5
0.3
0.2
0.4
0.7
0.5
0.5
0.5
Contribution* of the components to nominal
growth of adjusted gross disposable income
Social benefits
2003
Q1
Q2
Q3
Q4
Q1
Q2
Q3
Q4
Q1
Q2
Q3
Q4
Q1
Q2
Q3
Q4
Q1
Q2
Q3
Q4
Q1
Q2
Q3
Q4
Q1
Q2
Q3
Q4
Q1
Q2
Q3
Q4
Q1
Q2
Q3
Q4
Q1
Q2
Q3
Q4
Q1
Q2
Q3
Q4
Q1
Q2
Q3
Gross operating
surplus and mixed
income
Net property income
and other current
transfers
Wages (received)
Nominal growth of the components of
adjusted gross disposable income
Nominal growth of the
adjusted gross disposable
income
(seasonally adjusted, percentage change compared with the previous quarter)
0.9
0.2
0.5
0.4
0.5
0.7
0.4
0.5
0.4
0.6
0.8
0.4
0.6
0.7
0.5
0.2
0.7
0.8
0.5
1.0
0.7
0.9
0.6
-0.5
-1.0
0.1
0.1
0.3
0.4
0.6
0.4
0.5
0.7
0.7
0.3
0.6
0.5
0.4
0.2
0.5
0.2
0.1
0.3
0.1
0.2
0.2
0.1
-0.2
0.2
0.6
-0.1
0.6
0.0
0.0
0.1
0.4
0.2
0.0
0.5
0.2
0.5
0.6
0.7
0.0
0.0
0.2
0.1
0.1
-0.2
-0.1
0.0
0.8
0.3
-0.1
-0.2
-0.3
-0.5
0.0
0.0
-0.2
0.1
-0.3
-0.4
-0.6
-0.5
-0.4
-0.8
0.2
0.1
0.1
0.1
0.2
0.3
0.6
The contribution 'C' of an element 'E' to the growth of an aggregate 'A' between T-1 and T is CT = (ET - ET-1) / AT-1. It is also equal to the
growth rate of the component (ET - ET-1)/ET-1 multiplied by its share in the aggregate at the previous period ET-1/AT-1.
Deflator for the seasonally and working days adjusted final consumption expenditure of households (including non-profit institutions serving
households) which has been used to deflate adjusted gross disposable income and actual final consumption (See table 4).
Table 4: Household final consumption and gross fixed capital formation, in the euro area (EA18)
2003
2004
2005
2006
2007
2008
2009
2010
2011
2012
2013
2014
Q1
Q2
Q3
Q4
Q1
Q2
Q3
Q4
Q1
Q2
Q3
Q4
Q1
Q2
Q3
Q4
Q1
Q2
Q3
Q4
Q1
Q2
Q3
Q4
Q1
Q2
Q3
Q4
Q1
Q2
Q3
Q4
Q1
Q2
Q3
Q4
Q1
Q2
Q3
Q4
Q1
Q2
Q3
Q4
Q1
Q2
Q3
128547
129374
131829
133912
135142
136220
137602
141301
140402
145916
147939
152105
155177
156410
159831
164983
168319
167893
168847
169288
171736
167694
163639
156422
148714
143922
139635
140001
138344
143070
142423
142010
143925
143874
142773
142520
141076
139463
138095
136423
131652
134225
135379
133336
135945
134275
135878
1090637
1100120
1111618
1117026
1132955
1142069
1149477
1163232
1172581
1186700
1203561
1211153
1227310
1244032
1253691
1266656
1275581
1291688
1303443
1321841
1334454
1340088
1347214
1328840
1308095
1312197
1313318
1320144
1328465
1336591
1349744
1360853
1369602
1379308
1385888
1383283
1389288
1385541
1385283
1387844
1385829
1389096
1395325
1398193
1403530
1413348
1422018
231545
234019
236626
238492
240231
242354
244306
246880
250399
253554
257039
260906
264377
267990
270786
273205
275844
278486
282316
286336
289952
293950
297008
300690
304588
307887
311185
313015
314099
315124
315734
316407
316940
317626
318375
319186
319585
319685
319889
320391
322099
323902
325623
327270
328535
329832
331292
1322182
1334138
1348244
1355518
1373186
1384423
1393783
1410112
1422980
1440254
1460601
1472059
1491687
1512022
1524477
1539861
1551425
1570175
1585759
1608176
1624406
1634037
1644223
1629530
1612683
1620084
1624503
1633159
1642563
1651715
1665478
1677260
1686542
1696934
1704262
1702468
1708874
1705226
1705172
1708236
1707928
1712998
1720948
1725462
1732065
1743180
1753310
4111
4142
4180
4196
4246
4275
4297
4340
4373
4420
4476
4505
4561
4618
4650
4690
4719
4769
4808
4868
4911
4935
4959
4910
4857
4876
4885
4907
4933
4958
4996
5027
5052
5080
5098
5088
5105
5091
5087
5092
5090
5103
5124
5133
5151
5181
5207
0.9
0.6
1.9
1.6
0.9
0.8
1.0
2.7
-0.6
3.9
1.4
2.8
2.0
0.8
2.2
3.2
2.0
-0.3
0.6
0.3
1.4
-2.4
-2.4
-4.4
-4.9
-3.2
-3.0
0.3
-1.2
3.4
-0.5
-0.3
1.3
0.0
-0.8
-0.2
-1.0
-1.1
-1.0
-1.2
-3.5
2.0
0.9
-1.5
2.0
-1.2
1.2
0.6
0.9
1.1
0.5
1.3
0.8
0.7
1.2
0.9
1.2
1.4
0.8
1.3
1.4
0.8
1.0
0.8
1.2
1.0
1.4
1.0
0.6
0.6
-0.9
-1.0
0.5
0.3
0.5
0.6
0.6
0.8
0.7
0.6
0.6
0.4
-0.1
0.4
-0.2
0.0
0.2
0.0
0.3
0.5
0.3
0.4
0.6
0.6
0.5
0.8
0.9
0.4
1.2
0.7
0.5
1.0
0.8
1.1
1.3
0.6
1.2
1.2
0.7
0.9
0.6
1.0
0.8
1.2
0.9
0.5
0.5
-1.0
-1.1
0.4
0.2
0.5
0.5
0.5
0.8
0.6
0.5
0.5
0.3
-0.2
0.3
-0.3
-0.1
0.1
0.0
0.3
0.4
0.2
0.3
0.6
0.5
0.9
0.2
0.5
0.4
0.5
0.7
0.4
0.5
0.4
0.6
0.8
0.4
0.6
0.7
0.5
0.2
0.7
0.8
0.5
1.0
0.7
0.9
0.6
-0.5
-1.0
0.1
0.1
0.3
0.4
0.6
0.4
0.5
0.7
0.7
0.3
0.6
0.5
0.4
0.2
0.5
0.2
0.1
0.3
0.1
0.2
0.2
0.1
Real growth of
actual final
consumption per
capita
Growth of the deflator
of final consumption
expenditure
Actual final
consumption per
capita
Actual final
consumption
Gross fixed capital
formation
Actual final
consumption per
capita (in euro)
Nominal growth
Actual final
consumption
Social transfers in
kind
Final consumption
expenditure
Gross fixed capital
formation
(seasonally adjusted, millions of euro at current prices / percentage change compared with the previous quarter)
-0.5
0.5
0.4
-0.1
0.7
-0.1
0.1
0.5
0.4
0.5
0.5
0.2
0.6
0.5
0.2
0.6
-0.1
0.3
0.3
0.3
0.2
-0.4
-0.1
-0.5
-0.1
0.3
0.1
0.1
0.1
-0.1
0.3
0.2
-0.2
-0.2
0.1
-0.8
-0.2
-0.7
-0.3
-0.4
-0.3
0.1
0.1
0.0
0.2
0.4
0.5
© Copyright 2026
