
The share of persons at risk of poverty or social exclusion
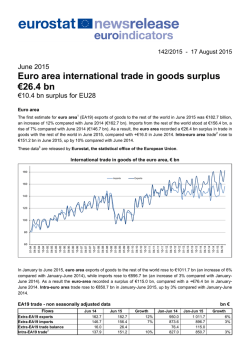
199/2016 - 17 October 2016
17 October: International Day for the Eradication of Poverty
The share of persons at risk of poverty or social
exclusion in the EU back to its pre-crisis level
Contrasting trends across Member States
In 2015, around 119 million people, or 23.7% of the population, in the European Union (EU) were at risk of poverty
or social exclusion. This means that they were in at least one of the following three conditions: at-risk-of-poverty
after social transfers (income poverty), severely materially deprived or living in households with very low work
intensity. After three consecutive increases between 2009 and 2012 to reach almost 25%, the proportion of
persons at risk of poverty or social exclusion in the EU has since continuously decreased to return to its 2008 level
(23.7%), but it remains in 2015 higher than its 2009 low-point (23.3%). The reduction of the number of persons at
risk of poverty or social exclusion in the EU is one of the key targets of the Europe 2020 strategy.
These figures are published by Eurostat, the statistical office of the European Union, on the occasion of the
International Day for the Eradication of Poverty. An infographic is also available on the Eurostat website.
At risk of poverty or social exclusion rate in the EU, 2008-2015
(% of total population)
30
25
20
15
10
5
0
2008
2009
2010
2011
2008 and 2009 data exclude Croatia. 2015 data are estimated.
2012
2013
2014
2015
Highest at risk of poverty or social exclusion rate in Bulgaria, lowest in the Czech Republic
In 2015, more than a third of the population was at risk of poverty or social exclusion in three Member States:
Bulgaria (41.3%), Romania (37.3%) and Greece (35.7%). At the opposite end of the scale, the lowest shares of
persons being at risk of poverty or social exclusion were recorded in the Czech Republic (14.0%), Sweden
(16.0%), the Netherlands and Finland (both 16.8%), Denmark and France (both 17.7%).
Largest decrease in the at-risk-of-poverty or social exclusion rate in Poland and Romania,
highest increase in Greece and Cyprus
Among Member States for which data are available, the at-risk-of-poverty or social exclusion rate has grown from
2008 to 2015 in fifteen Member States, with the highest increases being recorded in Greece (from 28.1% in 2008
to 35.7% in 2015, or +7.6 percentage points), Cyprus (+5.6 pp), Spain (+4.8 pp), Italy (+3.2 pp) and Luxembourg
(+3.0 pp). In contrast, the largest decreases among Member States for which data are available were observed in
Poland (from 30.5% to 23.4%, or -7.1 pp) and Romania (-6.9 pp), followed by Bulgaria (-3.5 pp) and Latvia (-3.3
pp). At EU level, the percentage of the total population being at risk of poverty or social exclusion in 2015 (23.7%)
was back to its 2008 level.
People at risk of poverty or social exclusion in the EU, 2008 and 2015
EU*
Belgium
Bulgaria
Czech Republic
Denmark
Germany
Estonia
Ireland
Greece
Spain
France
Croatia
Italy
Cyprus
Latvia
Lithuania
Luxembourg
Hungary
Malta
Netherlands**
Austria
Poland
Portugal
Romania
Slovenia
Slovakia
Finland
Sweden
United Kingdom
Iceland
Norway
Switzerland
% of total population
2008
2015
23.7
23.7
20.8
44.8
15.3
16.3
20.1
21.8
23.7
28.1
23.8
18.5
:
25.5
23.3
34.2
28.3
15.5
28.2
20.1
14.9
20.6
30.5
26.0
44.2
18.5
20.6
17.4
14.9
23.2
11.8
15.0
18.1
Figures are rounded to the nearest ten thousands
* Data for 2008 exclude Croatia. Data for 2015 are estimated.
** 2015 data are provisional.
: Data not available
The source dataset can be found here.
21.1
41.3
14.0
17.7
20.0
24.2
:
35.7
28.6
17.7
:
28.7
28.9
30.9
29.3
18.5
28.2
22.4
16.8
18.3
23.4
26.6
37.3
19.2
18.4
16.8
16.0
23.5
13.0
15.0
:
in thousands
2008
115 910
2 190
3 420
1 570
890
16 340
290
1 050
3 050
10 790
11 150
:
15 080
180
740
910
70
2 790
80
2 430
1 700
11 490
2 760
9 110
360
1 110
910
1 370
14 070
40
700
1 330
2015
118 760
2 340
2 980
1 440
1 000
16 080
310
:
3 830
13 180
11 050
:
17 470
240
610
860
90
2 730
90
2 810
1 550
8 760
2 760
7 430
380
960
900
1 560
15 030
40
770
:
About 1 in 6 persons in the EU at risk of income poverty…
Looking at each of the three elements contributing to being at risk of poverty or social exclusion, 17.3% of the EU
population in 2015 were at risk of poverty after social transfers, meaning that their disposable income was below
their national at-risk-of-poverty threshold (see the corresponding table). This proportion of persons at risk of income
poverty in the EU has slightly increased compared with 2014 (17.2%) and more significantly compared with 2008
(16.5%). As the thresholds reflect actual income distribution in the countries, they vary greatly between Member
States and also over time. Across the EU Member States for which data are available, 1 in 4 persons was at risk of
income poverty in Romania (25.4%) and about 1 in 5 in Latvia (22.5%), Lithuania (22.2%), Spain (22.1%),
Bulgaria (22.1%), Estonia (21.6%), Greece (21.4%), Italy (19.9%) and Portugal (19.5%). In contrast, the lowest
rates were observed in the Czech Republic (9.7%), the Netherlands (12.1%), Denmark (12.2%), Slovakia
(12.3%) and Finland (12.4%). Compared with 2008, the proportion of persons at risk of income poverty has
increased in twenty-two Member States for which data are available, and has decreased in four.
… 1 in 12 severely materially deprived…
In the EU in 2015, 8.1% of the population were severely materially deprived, meaning that they had living conditions
constrained by a lack of resources such as not being able to afford to pay their bills, keep their home adequately
warm, or take a one week holiday away from home. This proportion of persons severely materially deprived in the EU
has decreased compared with both 2014 (8.9%) and 2008 (8.5%). The share of those severely materially deprived in
2015 varied significantly among Member States for which data are available, ranging from more than 20% of the total
population in Bulgaria (34.2%), Romania (22.7%) and Greece (22.2%), to less than 5% in Sweden (0.7%),
Luxembourg (2.0%), Finland (2.2%), the Netherlands (2.5%), Austria (3.6%), Denmark (3.7%), Germany (4.4%),
Estonia and France (both 4.5%). Compared with 2008, the proportion of persons severely materially deprived has
increased in twelve Member States for which data are available, and decreased in fourteen.
…and 1 in 10 living in households with very low work intensity
Looking at low work intensity, 10.5% of the population aged 0-59 in the EU lived in households where the adults
worked less than 20% of their total work potential during the past year. Compared with 2014, this proportion
decreased in the EU for the first time since 2008. In 2015, Greece (16.8%), Spain (15.4%) and Belgium (14.9%) had
the highest proportions of those living in very low work intensity households, while Luxembourg (5.7%) and Sweden
(5.8%) had the lowest among Member States for which data are available. Compared with 2008, the share of
persons aged 0-59 living in households with very low work intensity has increased in a large majority of Member
States (twenty), while it decreased in six.
Evolution of the three components of the at risk of poverty or social exclusion rate in the EU,
(% of population)
20
18
16
14
At-risk-of-poverty rate after
social transfers
12
10
People living in households with
very low work intensity
8
Severe material deprivation rate
6
4
2
0
2008
2009
2010
2011
2012
2013
2014
2015
2008 and 2009 data exclude Croatia. 2015 data are estimated.
The total number of people at risk of poverty or social exclusion is lower than the sum of the numbers of people in each of the three forms of
poverty or social exclusion as some persons are affected simultaneously by more than one of these situations.
Components of the at risk of poverty or social exclusion rate in the EU, 2008 and 2015
At-risk-of-poverty after social
transfers (%)
2008
2015
Persons severely materially
deprived (%)
2008
EU*
16.5
17.3
Belgium
14.7
14.9
Bulgaria
21.4
22.0
9.0
9.7
Denmark
11.8
Germany
Estonia
2015
2008
2015
8.1
9.2
10.5
5.6
5.8
11.7
14.9
41.2
34.2
8.1
11.6
6.8
5.6
7.2
6.8
12.2
2.0
3.7
8.5
11.6
15.2
16.7
5.5
4.4
11.7
9.8
19.5
21.6
4.9
4.5
5.3
6.6
Ireland
15.5
:
5.5
:
13.7
:
Greece
20.1
21.4
11.2
22.2
7.5
16.8
Spain
19.8
22.1
3.6
6.4
6.6
15.4
France
12.5
13.6
5.4
4.5
8.8
8.6
Croatia
Czech Republic
8.5
Persons aged 0-59 living in
households with very low work
intensity (%)
:
:
:
:
:
:
Italy
18.9
19.9
7.5
11.5
10.4
11.7
Cyprus
15.9
16.2
9.1
15.4
4.5
10.9
Latvia
25.9
22.5
19.3
16.4
5.4
7.8
Lithuania
20.9
22.2
12.5
13.9
6.1
9.2
Luxembourg
13.4
15.3
0.7
2.0
4.7
5.7
Hungary
12.4
14.9
17.9
19.4
12.0
9.4
Malta
15.3
16.3
4.3
8.1
8.6
9.2
Netherlands**
10.5
12.1
1.5
2.5
8.2
10.2
Austria
15.2
13.9
5.9
3.6
7.4
8.2
Poland
16.9
17.6
17.7
8.1
8.0
6.9
Portugal
18.5
19.5
9.7
9.6
6.3
10.9
Romania
23.6
25.4
32.7
22.7
8.5
7.9
Slovenia
12.3
14.3
6.7
5.8
6.7
7.4
Slovakia
10.9
12.3
11.8
9.0
5.2
7.1
Finland
13.6
12.4
3.5
2.2
7.5
10.8
Sweden
12.2
14.5
1.4
0.7
5.5
5.8
United Kingdom
18.7
16.7
4.5
6.1
10.4
11.9
Iceland
10.1
9.6
0.8
1.6
2.6
5.2
Norway
11.4
11.9
2.0
1.7
6.5
7.8
Switzerland
15.7
:
2.1
:
3.3
:
* Data for 2008 exclude Croatia. Data for 2015 are estimated.
** 2015 data are provisional.
: Data not available
At-risk-of-poverty thresholds in the EU, 2008 and 2015
(in national currency)
Currency
Annual national
median equivalised
disposable income
(after social transfers)
2008
Annual at-risk-of-poverty threshold
Two adults with two children
younger than 14 years
Single adult
2015
2008
2015
2008
2015
Belgium
euro
17 985
21 654
10 791
12 993
22 661
27 285
Bulgaria
BGN
4 247
6 516
2 548
3 910
5 351
8 210
Czech Republic
CZK
168 472
204 395
101 083
122 637
212 275
257 537
Denmark
DKK
180 015
211 450
108 009
126 870
226 819
266 428
Germany
euro
18 309
20 668
10 986
12 401
23 070
26 041
Estonia
euro
5 547
7 889
3 328
4 733
6 989
9 940
Ireland
euro
22 995
:
13 797
:
28 973
:
Greece
euro
10 800
7 520
6 480
4 512
13 608
9 475
Spain
euro
13 966
13 352
8 379
8 011
17 597
16 823
France
euro
18 899
21 415
11 340
12 849
23 813
26 983
Croatia
HRK
:
:
:
:
:
:
Italy
euro
15 640
15 846
9 384
9 508
19 706
19 966
Cyprus
euro
16 024
13 793
9 614
8 276
20 190
17 380
Latvia
euro
4 740
5 828
2 844
3 497
5 972
7 344
Lithuania
euro
4 111
5 180
2 467
3 108
5 180
6 527
Luxembourg
euro
30 917
35 270
18 550
21 162
38 955
44 441
Hungary
HUF
1 105 926
1 406 568
663 556
843 941
1 393 467
1 772 275
Malta
euro
10 009
13 493
6 005
8 096
12 611
17 001
Netherlands*
euro
19 522
21 154
11 713
12 692
24 598
26 654
Austria
euro
19 413
23 260
11 648
13 956
24 461
29 308
Poland
PLN
15 720
23 247
9 432
13 948
19 807
29 291
Portugal
euro
8 143
8 435
4 886
5 061
10 260
10 628
Romania
RON
6 510
10 282
3 906
6 169
8 203
12 955
Slovenia
euro
10 893
12 332
6 536
7 399
13 725
15 538
Slovakia
euro
4 791
6 930
2 875
4 158
6 038
8 732
Finland
euro
19 794
23 763
11 876
14 258
24 940
29 942
Sweden
SEK
190 305
242 388
114 183
145 433
239 784
305 408
United Kingdom
GBP
15 068
16 885
9 041
10 131
18 986
21 274
Iceland
ISK
2 822 193
3 669 616
1 693 316
2 201 769
3 555 963
4 623 716
Norway
NOK
254 905
346 569
152 855
207 941
320 996
436 677
Switzerland
CHF
44 332
:
26 599
:
55 858
:
* 2015 data are provisional.
: Data not available
The source dataset can be found here.
The at-risk-of-poverty rate is the share of people whose total household income that is available (after social
transfers, tax and other deductions) for spending or saving is below the at-risk-of-poverty threshold, which is set
at 60% of the national median equivalised disposable income after social transfers.
This indicator does not measure wealth or absolute poverty, but low income in comparison to other residents in that
country.
The threshold depends on the income distribution in a country for a given year and varies with the composition of a
household. It is therefore important to note that the at-risk-of-income-poverty rate is a relative measure of poverty
and that the threshold varies greatly between Member States. It also varies over time as it follows the evolution of
the national median disposable income: in a number of Member States the threshold has fallen over the period
2008-2015 (Greece, Cyprus) or stayed nearly stable (Spain, Italy and Portugal) due to the economic crisis.
Geographical information
The European Union (EU) includes Belgium, Bulgaria, the Czech Republic, Denmark, Germany, Estonia, Ireland, Greece,
Spain, France, Croatia, Italy, Cyprus, Latvia, Lithuania, Luxembourg, Hungary, Malta, the Netherlands, Austria, Poland,
Portugal, Romania, Slovenia, Slovakia, Finland, Sweden and the United Kingdom.
For 2008 and 2009, data for the EU aggregate excludes Croatia.
Methods and definitions
Data on the risk of poverty or social exclusion presented in this News Release are based on the EU-Statistics on Income and
Living Conditions (EU-SILC). The EU-SILC survey is the EU reference source for comparative statistics on income distribution,
poverty and living conditions. More information can be found here.
The reference population is all private households and their current members residing in the territory of a given Member State at
the time of data collection. Persons living in collective households and in institutions are generally excluded from the target
population as well as small and remote parts of the national territory amounting to no more than 2% of the national population.
Persons at-risk-of-poverty are those living in a household with an equivalised disposable income below the risk-of-poverty
threshold, which is set at 60% of the national median equivalised disposable income (after social transfers). The equivalised
income is calculated by dividing the total household income by its size determined after applying the following weights: 1.0 to
the first adult, 0.5 to each other household members aged 14 or over and 0.3 to each household member aged less than 14
years old.
Severely materially deprived persons have living conditions constrained by a lack of resources and experience at least 4 out
of the 9 following deprivation items: cannot afford 1) to pay rent/mortgage or utility bills on time, 2) to keep home adequately
warm, 3) to face unexpected expenses, 4) to eat meat, fish or a protein equivalent every second day, 5) a one week holiday
away from home, 6) a car, 7) a washing machine, 8) a colour TV, or 9) a telephone (including mobile phone).
People living in households with very low work intensity are those aged 0-59 who live in households where on average the
adults (aged 18-59) worked less than 20% of their total work potential during the past year. Students are excluded.
The total number of people at risk of poverty or social exclusion is lower than the sum of the numbers of people in each of
the three forms of poverty or social exclusion as some persons are affected simultaneously by more than one of these
situations.
For more information
Eurostat website section dedicated to statistics on income, social inclusion and living conditions.
Eurostat database on income and living conditions.
Eurostat interactive infographic on people at risk of poverty or social exclusion in the EU.
The European Commission website dedicated to the Europe 2020 strategy.
The UN webpage dedicated to the International Day for the Eradication of Poverty.
Issued by: Eurostat Press Office
Production of data:
Vincent BOURGEAIS
Tel: +352-4301-33 444
[email protected]
Jacopo GRAZZINI
Tel: +352-4301-31 753
[email protected]
ec.europa.eu/eurostat
@EU_Eurostat
Media requests: Eurostat media support / Tel: +352-4301-33 408 / [email protected]
© Copyright 2026