
Euro area international trade in goods surplus €26.4 bn
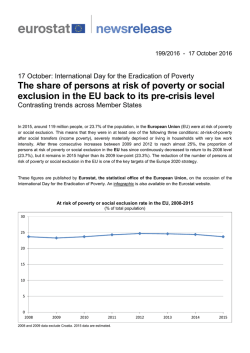
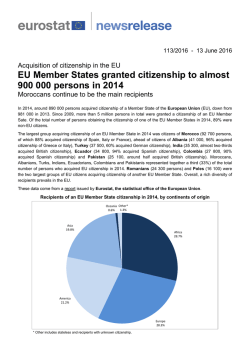
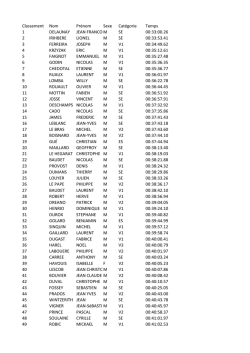
142/2015 - 17 August 2015
June 2015
Euro area international trade in goods surplus
€26.4 bn
€10.4 bn surplus for EU28
Euro area
1
The first estimate for euro area (EA19) exports of goods to the rest of the world in June 2015 was €182.7 billion,
an increase of 12% compared with June 2014 (€162.7 bn). Imports from the rest of the world stood at €156.4 bn, a
rise of 7% compared with June 2014 (€146.7 bn). As a result, the euro area recorded a €26.4 bn surplus in trade in
2
goods with the rest of the world in June 2015, compared with +€16.0 in June 2014. Intra-euro area trade rose to
€151.2 bn in June 2015, up by 10% compared with June 2014.
3
These data are released by Eurostat, the statistical office of the European Union.
International trade in goods of the euro area, € bn
180
Imports
Exports
160
140
120
100
80
01-04
04-04
07-04
10-04
01-05
04-05
07-05
10-05
01-06
04-06
07-06
10-06
01-07
04-07
07-07
10-07
01-08
04-08
07-08
10-08
01-09
04-09
07-09
10-09
01-10
04-10
07-10
10-10
01-11
04-11
07-11
10-11
01-12
04-12
07-12
10-12
01-13
04-13
07-13
10-13
01-14
04-14
07-14
10-14
01-15
04-15
60
In January to June 2015, euro area exports of goods to the rest of the world rose to €1011.7 bn (an increase of 6%
compared with January-June 2014), while imports rose to €896.7 bn (an increase of 3% compared with JanuaryJune 2014). As a result the euro-area recorded a surplus of €115.0 bn, compared with a +€76.4 bn in JanuaryJune 2014. Intra-euro area trade rose to €850.7 bn in January-June 2015, up by 3% compared with January-June
2014.
bn €
EA19 trade - non seasonally adjusted data
Flows
Extra-EA19 exports
Extra-EA19 imports
Extra-EA19 trade balance
2
Intra-EA19 trade
Jun 14
162.7
146.7
16.0
137.9
Jun 15
182.7
156.4
26.4
151.2
Growth
12%
7%
10%
Jan-Jun 14
950.0
873.6
76.4
827.0
Jan-Jun 15
1 011.7
896.7
115.0
850.7
Growth
6%
3%
3%
European Union
1
The first estimate for extra-EU28 exports of goods in June 2015 was €159.7 billion, up by 13% compared with
June 2014 (€141.4 bn). Imports from the rest of the world stood at €149.3 bn, up by 7% compared with June 2014
(€139.4 bn). As a result, the EU28 recorded a €10.4 bn surplus in trade in goods with the rest of the world in June
2
2015, compared with +€2.0 in June 2014. Intra-EU28 trade rose to €271.3 bn in June 2015, +10% compared with
June 2014.
International trade in goods of the EU28, € bn
180
Imports
Exports
160
140
120
100
80
04-15
01-15
10-14
07-14
04-14
01-14
10-13
07-13
04-13
01-13
10-12
07-12
04-12
01-12
10-11
07-11
04-11
01-11
10-10
07-10
04-10
01-10
10-09
07-09
04-09
01-09
10-08
07-08
04-08
01-08
10-07
07-07
04-07
01-07
10-06
07-06
04-06
01-06
10-05
07-05
04-05
01-05
10-04
07-04
04-04
01-04
60
In January to June 2015, extra-EU28 exports of goods rose to €887.9 bn (an increase of 7% compared with
January-June 2014), while imports rose to €864.6 bn (an increase of 4% compared with January-June 2014). As a
result, the EU28 recorded a surplus of €23.3 bn, compared with -€3.8 bn in January-June 2014. Intra-EU28 trade
rose to €1532.9 bn in January-June 2015, +4% compared with January-June 2014.
bn €
EU28 trade - non seasonally adjusted data
Flows
Extra-EU28 exports
Extra-EU28 imports
Extra-EU28 trade balance
2
Intra-EU28 trade
Main products4 - EU28
Total
Primary goods:
Food & drink
Raw materials
Energy
Manufactured goods:
Chemicals
Machinery & vehicles
Other manuf’d goods
Other
Jun 15
159.7
149.3
10.4
271.3
Growth
13%
7%
10%
Jan-Jun 14
829.0
832.8
-3.8
1 467.8
Jan-Jun 15
887.9
864.6
23.3
1 532.9
Growth
7%
4%
4%
bn €
Extra-EU28 exports
Extra-EU28 imports
Trade balance
Jan-Jun 14 Jan-Jun 15 Growth Jan-Jun 14 Jan-Jun 15 Growth Jan-Jun 14 Jan-Jun 15
829.0
887.9
7%
832.8
864.6
4%
-3.8
23.3
129.7
122.3
-6%
315.1
263.4
-16%
-185.4
-141.0
51.7
55.1
7%
48.6
54.1
11%
3.0
1.0
21.7
23.0
6%
37.3
36.9
-1%
-15.6
-14.0
56.4
44.2
-22%
229.2
172.3
-25%
-172.9
-128.1
666.6
730.3
10%
498.8
576.8
16%
167.8
153.4
137.1
158.3
15%
82.9
93.9
13%
54.2
64.4
341.7
370.2
8%
219.9
259.3
18%
121.8
110.9
187.7
201.8
8%
195.9
223.7
14%
-8.2
-21.9
32.7
35.3
8%
18.8
24.4
29%
13.8
10.9
Main trading partners - EU28
United States
China
Switzerland
Russia
Turkey
Norway
Japan
South Korea
India
Brazil
Jun 14
141.4
139.4
2.0
245.8
bn €
EU28 exports to
EU28 imports from
Trade balance
Jan-Jun 14 Jan-Jun 15
Growth
Jan-Jun 14 Jan-Jun 15
Growth
Jan-Jun 14 Jan-Jun 15
149.0
184.0
23%
100.2
124.6
24%
48.8
59.4
78.6
84.4
7%
140.1
167.0
19%
-61.5
-82.6
71.2
74.1
4%
48.0
50.9
6%
23.2
23.3
52.1
35.4
-32%
97.3
71.7
-26%
-45.2
-36.3
36.6
41.0
12%
27.0
30.2
12%
9.6
10.8
25.0
24.9
-1%
44.7
38.7
-13%
-19.7
-13.9
26.0
26.4
2%
27.2
29.7
9%
-1.2
-3.2
20.1
24.3
21%
19.7
20.8
6%
0.4
3.5
16.7
19.4
17%
18.5
20.4
11%
-1.8
-1.0
18.7
17.9
-4%
15.5
15.7
1%
3.2
2.2
Member States’ total trade (intra-EU + extra-EU)
bn €
Total exports
Total
Intra-EU
Total imports
Extra-EU
Total
Intra-EU
Trade balance
Extra-EU
Total
Intra-EU
Extra-EU
Growth /
Growth /
Growth /
Growth /
Growth /
Growth /
Jan-Jun
Jan-Jun
Jan-Jun
Jan-Jun
Jan-Jun
Jan-Jun
Jan-Jun Jan-Jun Jan-Jun Jan-Jun Jan-Jun Jan-Jun
Jan-Jun
Jan-Jun
Jan-Jun
Jan-Jun
Jan-Jun
Jan-Jun
15
15
15
15
15
15
15
14
15
14
15
14
14
14
14
14
14
14
Belgium
180.9
2%
129.1
3%
51.8
-2%
167.4
-2%
103.2
-9%
64.2
10%
13.5
6.5
25.9
12.5
-12.4
-6.0
Bulgaria
11.4
11%
7.2
12%
4.2
8%
13.0
5%
8.2
8%
4.8
0%
-1.6
-2.1
-1.0
-1.2
-0.6
-0.9
Czech Republic
69.8
8%
58.1
9%
11.8
4%
61.0
9%
47.2
10%
13.7
7%
8.9
8.7
10.8
10.1
-1.9
-1.4
Denmark
43.5
5%
26.7
1%
16.8
12%
38.1
3%
26.0
1%
12.1
6%
5.4
4.4
0.6
0.7
4.7
3.7
Germany
596.4
7%
347.2
6%
249.2
9%
470.9
3%
308.9
3%
162.0
4%
125.5
99.9
38.3
26.2
87.3
73.8
Estonia
Ireland
5.8
-1%
4.4
4%
1.4
-12%
6.5
-4%
5.2
-5%
1.3
4%
-0.7
-0.9
-0.8
-1.3
0.2
0.4
52.1
19%
28.3
21%
23.8
17%
29.4
12%
19.7
9%
9.7
16%
22.7
17.3
8.6
5.4
14.1
11.9
13.0
-2%
7.0
10%
6.0
-13%
22.1
-7%
11.8
5%
10.3
-17%
-9.2
-10.5
-4.8
-4.9
-4.4
-5.6
Spain
128.6
5%
84.1
7%
44.5
2%
140.5
5%
84.8
11%
55.7
-4%
-11.9
-11.7
-0.7
2.5
-11.2
-14.2
France
229.8
5%
136.5
2%
93.2
10%
258.9
1%
176.3
0%
82.6
2%
-29.2
-38.3
-39.8
-41.9
10.6
3.6
Greece
5.5
12%
3.7
16%
1.8
5%
9.0
5%
7.0
9%
2.0
-8%
-3.4
-3.6
-3.3
-3.2
-0.1
-0.4
206.7
5%
113.9
4%
92.8
6%
188.2
5%
109.3
7%
78.9
1%
18.5
17.2
4.6
7.9
13.9
9.3
Cyprus
0.9
28%
0.5
14%
0.4
48%
2.4
3%
1.8
2%
0.7
5%
-1.5
-1.6
-1.3
-1.3
-0.2
-0.3
Latvia
5.2
0%
3.7
2%
1.5
-4%
6.3
-2%
5.0
-3%
1.3
2%
-1.1
-1.2
-1.3
-1.5
0.2
0.3
11.0
-4%
7.0
7%
4.0
-18%
12.6
2%
8.3
3%
4.3
1%
-1.5
-0.9
-1.3
-1.5
-0.3
0.7
7.7
9%
6.5
13%
1.2
-10%
10.6
9%
7.7
-5%
2.9
80%
-2.9
-2.6
-1.2
-2.4
-1.7
-0.3
44.2
7%
35.9
8%
8.3
3%
41.3
6%
31.6
8%
9.7
-2%
2.9
2.4
4.3
4.2
-1.4
-1.8
1.2
16%
0.5
-2%
0.7
33%
2.8
37%
1.8
33%
1.1
44%
-1.6
-1.0
-1.3
-0.8
-0.4
-0.2
255.6
2%
192.8
1%
62.7
5%
226.7
3%
102.6
0%
124.1
5%
28.8
30.7
90.3
89.1
-61.4
-58.4
Austria
67.3
1%
47.2
1%
20.1
2%
68.6
0%
52.4
0%
16.2
0%
-1.3
-2.2
-5.2
-5.7
3.9
3.5
Poland
87.8
8%
69.7
12%
18.1
-4%
83.5
2%
58.4
3%
25.1
-1%
4.3
-0.9
11.3
5.7
-7.1
-6.6
Portugal
25.2
6%
18.4
7%
6.8
2%
30.1
4%
22.9
6%
7.1
-2%
-4.8
-5.0
-4.5
-4.4
-0.3
-0.6
Romania
27.0
6%
19.9
9%
7.2
-1%
30.3
7%
23.3
8%
7.0
2%
-3.3
-2.8
-3.4
-3.2
0.1
0.4
Slovenia
14.3
7%
10.9
9%
3.4
1%
13.3
5%
9.3
7%
4.0
3%
1.0
0.8
1.7
1.3
-0.7
-0.6
Slovakia
33.6
3%
28.6
4%
5.0
-5%
31.9
4%
25.1
8%
6.8
-9%
1.6
2.0
3.5
4.2
-1.8
-2.2
Finland
27.1
-3%
15.9
-2%
11.2
-3%
26.4
-9%
19.1
-2%
7.3
-22%
0.7
-1.1
-3.3
-3.4
3.9
2.3
63.6
1%
37.2
1%
26.4
2%
60.9
0%
42.0
0%
18.9
-1%
2.7
1.6
-4.9
-5.3
7.5
6.9
205.5
10%
92.1
0%
113.4
19%
280.3
12%
149.7
12%
130.7
13%
-74.9
-62.4
-57.6
-41.6
-17.3
-20.9
Croatia
Italy
Lithuania
Luxembourg
Hungary
Malta
Netherlands
Sweden
United Kingdom
1. The euro area (EA19) includes Belgium, Germany, Estonia, Ireland, Greece, Spain, France, Italy, Cyprus, Latvia, Lithuania,
Luxembourg, Malta, the Netherlands, Austria, Portugal, Slovenia, Slovakia and Finland.
The European Union (EU28) includes Belgium, Bulgaria, the Czech Republic, Denmark, Germany, Estonia, Ireland, Greece,
Spain, France, Croatia, Italy, Cyprus, Latvia, Lithuania, Luxembourg, Hungary, Malta, the Netherlands, Austria, Poland,
Portugal, Romania, Slovenia, Slovakia, Finland, Sweden and the United Kingdom.
2. Since the introduction of Intrastat for intra-EU trade on 1 January 1993, the value of dispatches has been consistently higher
than that of arrivals. In theory, as dispatches are declared FOB and arrivals CIF, the value of arrivals should be slightly
higher than that of dispatches. Eurostat uses dispatches as the more reliable measure of total intra-EU trade as, at
aggregated levels, total dispatches has better coverage than total arrivals. Due to this divergence in intra-EU trade, and to
the difficulties of interpreting figures in absolute terms at the level of individual Member States, trade balances for individual
Member States must be interpreted with caution. The same caution applies to the trade balance of the euro area, which
includes some intra-EU trade.
3. This News Release is based on data available on 11 August 2015. These are provisional figures based on information
provided by Member States. They are subject to frequent revision for up to two years after the month in question.
Furthermore, national concepts may differ from the harmonised methodology used by Eurostat, leading to differences
between figures in this release and those published nationally, both for raw data and for seasonally adjusted series. More
information regarding international trade in goods statistics can be found in a Statistics Explained article on the Eurostat
website: http://ec.europa.eu/eurostat/statistics-explained/index.php/International_trade_statistics_-_background
4. Products are classified according to the Standard international trade classification (SITC), Revision 4. Further details can be
found in a Statistics Explained article on the Eurostat website:
http://ec.europa.eu/eurostat/statistics-explained/index.php/Glossary:Standard_international_trade_classification_(SITC)
Issued by: Eurostat Press Office
For further information on data:
Vincent BOURGEAIS
Tel: +352-4301-33 444
[email protected]
Gilberto GAMBINI
Tel: +352-4301-35 806
[email protected]
Media requests: Eurostat media support / Tel: +352-4301-33 408 / [email protected]
ec.europa.eu/eurostat/
@EU_Eurostat
Annex - Seasonally adjusted data
In June 2015 compared with May 2015, euro area seasonally adjusted exports increased by 1.4%, while imports
increased by 1.2%. The seasonally adjusted balance was +€21.9 bn, an increase compared with May (+€21.3 bn).
bn €
EA19 trade - seasonally adjusted data
Flows
Jul 14 Aug 14 Sep 14 Oct 14 Nov 14 Dec 14 Jan 15 Feb 15 Mar 15 Apr 15 May 15 Jun 15
Extra-EA19 exports
161.1
Extra-EA19 imports
147.6
Extra-EA19 trade balance 13.4
2
Intra-EA19 trade
137.8
159.3
144.2
15.0
138.0
165.7
147.6
18.1
138.2
165.9
146.3
19.5
138.4
166.7 165.7
146.1 143.2
20.7 22.5
139.0 136.5
163.9
143.0
20.9
136.5
168.6
147.4
21.2
138.3
171.4
153.7
17.7
139.7
173.4
151.8
21.6
140.1
170.8
149.5
21.3
141.5
173.1
151.3
21.9
143.0
In June 2015 compared with May 2015, EU28 seasonally adjusted exports rose by 0.5%, while imports rose by
0.6%. The seasonally adjusted balance was +€7.3 bn, nearly stable compared with May.
bn €
EU28 trade - seasonally adjusted data
Flows
Jul 14 Aug 14 Sep 14 Oct 14 Nov 14 Dec 14 Jan 15 Feb 15 Mar 15 Apr 15 May 15 Jun 15
Extra-EU28 exports
140.1
Extra-EU28 imports
144.2
Extra-EU28 trade balance -4.1
2
Intra-EU28 trade
246.6
137.8
140.4
-2.6
244.0
145.9
143.0
2.9
246.6
145.0
140.8
4.2
247.7
146.9 144.4
139.3 138.6
7.6 5.8
249.6 245.8
142.2
138.8
3.4
246.4
145.8
144.0
1.8
251.0
156.2
149.3
6.9
253.5
Contribution of EU28 Member States to extra-EU28 trade - seasonally adjusted data
EU28
Belgium
Bulgaria
Czech Republic
Denmark
Germany
Estonia
Ireland
Greece
Spain
France
Croatia
Italy
Cyprus
Latvia
Lithuania
Luxembourg
Hungary
Malta
Netherlands
Austria
Poland
Portugal
Romania
Slovenia
Slovakia
Finland
Sweden
United Kingdom
Total exports
Growth
May 15
Jun 15
151.4
152.2
0.5%
8.8
8.7
-1.0%
0.7
0.7
-1.6%
2.0
2.0
-1.5%
2.7
2.7
1.3%
42.6
43.1
1.4%
0.2
0.2
12.1%
3.9
3.9
0.9%
1.2
0.9
-24.4%
7.5
7.5
-0.4%
15.9
16.8
6.2%
0.3
0.3
-1.7%
15.5
15.5
-0.2%
0.1
0.1
-51.7%
0.3
0.3
-8.4%
0.8
0.7
-9.9%
0.2
0.2
1.7%
1.3
1.4
4.3%
0.1
0.1
-5.3%
10.4
10.9
4.7%
3.4
3.4
1.5%
3.2
2.9
-8.5%
1.2
1.2
6.5%
1.3
1.2
-4.2%
0.6
0.6
-2.4%
0.9
0.8
-1.9%
1.8
1.9
9.2%
4.3
4.5
5.1%
20.4
19.5
-4.5%
Total imports
Growth
May 15
Jun 15
144.1
145.0
0.6%
10.5
10.8
2.5%
0.8
0.8
0.8%
2.2
2.3
4.6%
2.0
2.1
3.4%
26.5
27.8
4.7%
0.2
0.2
30.7%
1.6
1.6
-0.2%
1.7
1.5
-14.8%
9.4
9.2
-1.6%
13.5
14.0
3.9%
0.3
0.3
-6.2%
13.2
13.3
1.3%
0.1
0.1
-22.3%
0.2
0.2
-2.4%
0.8
0.8
-3.4%
0.4
0.5
21.2%
1.6
1.5
-5.7%
0.2
0.2
13.9%
21.3
20.6
-3.1%
2.5
2.6
6.4%
4.1
4.3
3.0%
1.3
1.2
-13.4%
1.2
1.2
1.3%
0.7
0.7
1.6%
1.1
1.2
2.6%
1.1
1.2
0.8%
3.1
3.3
5.5%
22.2
21.4
-3.5%
156.0
146.4
9.6
253.6
151.4
144.1
7.3
255.5
152.2
145.0
7.3
258.3
bn €
Trade balance
May 15
Jun 15
7.3
7.3
-1.8
-2.1
-0.1
-0.1
-0.2
-0.3
0.7
0.6
16.0
15.3
0.1
0.0
2.3
2.3
-0.5
-0.6
-1.9
-1.8
2.4
2.8
0.0
0.0
2.3
2.1
0.0
-0.1
0.1
0.0
0.0
-0.1
-0.2
-0.3
-0.3
-0.1
-0.1
-0.1
-10.9
-9.7
0.9
0.8
-0.9
-1.3
-0.2
0.1
0.0
0.0
-0.1
-0.1
-0.3
-0.3
0.6
0.8
1.2
1.2
-1.8
-1.9
01-04
04-04
07-04
10-04
01-05
04-05
07-05
10-05
01-06
04-06
07-06
10-06
01-07
04-07
07-07
10-07
01-08
04-08
07-08
10-08
01-09
04-09
07-09
10-09
01-10
04-10
07-10
10-10
01-11
04-11
07-11
10-11
01-12
04-12
07-12
10-12
01-13
04-13
07-13
10-13
01-14
04-14
07-14
10-14
01-15
04-15
International trade in goods balance, seasonally adjusted, € bn
30
20
Euro area
EU28
10
0
-10
-20
-30
-40
© Copyright 2026