
Total population in the European Union is expected to
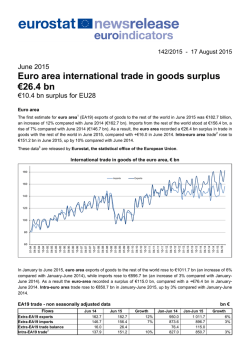
113/2016 - 13 June 2016
Acquisition of citizenship in the EU
EU Member States granted citizenship to almost
900 000 persons in 2014
Moroccans continue to be the main recipients
In 2014, around 890 000 persons acquired citizenship of a Member State of the European Union (EU), down from
981 000 in 2013. Since 2009, more than 5 million persons in total were granted a citizenship of an EU Member
Sate. Of the total number of persons obtaining the citizenship of one of the EU Member States in 2014, 89% were
non-EU citizens.
The largest group acquiring citizenship of an EU Member State in 2014 was citizens of Morocco (92 700 persons,
of which 88% acquired citizenship of Spain, Italy or France), ahead of citizens of Albania (41 000, 96% acquired
citizenship of Greece or Italy), Turkey (37 500, 60% acquired German citizenship), India (35 300, almost two-thirds
acquired British citizenship), Ecuador (34 800, 94% acquired Spanish citizenship), Colombia (27 800, 90%
acquired Spanish citizenship) and Pakistan (25 100, around half acquired British citizenship). Moroccans,
Albanians, Turks, Indians, Ecuadorians, Colombians and Pakistanis represented together a third (33%) of the total
number of persons who acquired EU citizenship in 2014. Romanians (24 300 persons) and Poles (16 100) were
the two largest groups of EU citizens acquiring citizenship of another EU Member State. Overall, a rich diversity of
recipients prevails in the EU.
These data come from a report issued by Eurostat, the statistical office of the European Union.
Recipients of an EU Member State citizenship in 2014, by continents of origin
Oceania Other*
1.3%
0.6%
Asia
19.8%
Africa
28.7%
America
21.2%
Europe
28.3%
* Other includes stateless and recipients with unknown citizenship.
Main recipients of an EU Member State citizenship in 2014
Main recipients of
an EU citizenship
Total
Main EU Member State
(in 1000) granting citizenships
%
Second main EU
Member State granting
citizenships
%
Third main EU
Member State
granting citizenships
%
Moroccans
92.7 Spain
37.5 Italy
31.3 France
Albanians
41.0 Italy
51.6 Greece
44.9 United Kingdom
0.9
Turks
37.5 Germany
60.0 France
15.6 Netherlands
8.4
Indians
35.3 United Kingdom
63.6 Italy
14.2 Ireland
8.3
Ecuadorians
34.8 Spain
94.1 Italy
3.4 Germany
0.6
Colombians
27.8 Spain
90.2 Italy
2.6 France
2.2
Pakistanis
25.1 United Kingdom
51.7 Italy
16.8 Spain
13.2
Romanians
24.3 Italy
26.5 Hungary
25.5 Germany
10.7
Bolivians
21.4 Spain
97.6 Italy
0.5 Sweden
0.5
Peruvians
20.9 Spain
79.5 Italy
Algerians
20.4 France
74.1 Spain
Russians
19.8 Germany
24.7 France
15.3 Finland
11.7
Iraqis
17.6 Sweden
41.4 Germany
18.0 Netherlands
14.1
Nigerians
17.6 United Kingdom
45.8 Ireland
18.7 Italy
12.6
Ukrainians
17.5 Germany
20.2 Portugal
18.9 Czech Republic
11.7
Poles
16.1 Germany
37.1 United Kingdom
19.6 Sweden
15.1
Dominicans
16.1 Spain
87.8 Italy
Brazilians
14.2 Portugal
32.7 Spain
28.2 Italy
Tunisians
12.7 France
49.5 Italy
34.8 Germany
Chinese
11.5 United Kingdom
31.5 France
16.0 Italy
12.5
Filipinos
11.1 United Kingdom
27.8 Ireland
19.6 Italy
17.4
Bangladeshis
11.1 Italy
48.1 United Kingdom
35.1 Spain
Ghanaians
9.6 Italy
38.4 United Kingdom
32.5 Spain
7.6
Senegalese
9.4 Italy
42.7 France
32.3 Spain
20.7
Somalis
9.4 Sweden
31.1 Netherlands
24.8 United Kingdom
22.3
Serbians
9.0 Germany
24.9 Italy
23.1 France
14.8
Afghans
8.5 Germany
35.4 United Kingdom
16.9 Netherlands
16.2
Iranians
8.0 Germany
31.8 United Kingdom
19.2 Sweden
14.1
Argentinians
8.0 Spain
88.4 Italy
4.1 France
2.1
Cubans
7.3 Spain
77.0 Italy
10.8 Germany
5.3
The source dataset can be found here.
15.0 France
9.4 Italy
7.8 Germany
19.5
1.5
7.0
2.0
11.1
8.3
5.4
Main recipients of citizenships granted by EU Member States, 2014
Total
number
EU
Belgium
Bulgaria
Main recipients
Citizens of
889 139 Morocco
18 726 Morocco
Second main recipients
%
Citizens of
%
Citizens of
%
10.4 Albania
4.6 Turkey
4.2
12.9 Italy
6.4 Romania
4.4
16.2 Moldova
14.0
900 Ukraine
22.4 Russia
Czech Republic
5 059 Ukraine
40.4 Russia
Denmark
4 747 Iraq
33.5 Afghanistan
Germany
110 610 Turkey
Estonia
Third main recipients
20.3 Poland
1 614 Recognised non-citizen* 84.3 Russia
Ireland
21 104 Nigeria
15.6 India
Greece
20 913 Albania
88.0 Russia
9.9 Slovakia
9.0
19.3 Somalia
8.5
5.4 Russia
4.4
12.7 Ukraine
1.8
13.9 Philippines
10.3
1.5 Ukraine
1.1
12.2
Spain
205 880 Morocco
16.9 Ecuador
15.9 Colombia
France
105 613 Morocco
17.1 Algeria
14.3 Tunisia
42.3 Serbia
15.6 Kosovo**
13.4
129 887 Morocco
22.3 Albania
16.3 Romania
5.0
Cyprus
2 277 Russia
27.1 Greece
15.5 United Kingdom
Latvia
2 141 Recognised non-citizen* 80.2 Russia
Croatia
Italy
Lithuania
686 Bosnia & Herzegovina
183 Russia
5.1 Ukraine
2.5
30.1 Ukraine
12.0
12.9 France
9.6
9.8 Serbia
4.7
10.2 Russia
7.0
3 206 Portugal
37.8 Italy
Hungary
8 745 Romania
70.9 Ukraine
Netherlands
Austria
Poland
Portugal
314 United Kingdom
32 675 Morocco
29.6 Italy
13.1 Turkey
9.6 Iraq
7 570 Bosnia & Herzegovina
14.8 Turkey
11.7 Serbia
4 073 Ukraine
42.8 Belarus
13.2 Armenia
22.0 Ukraine
15.7 Cape Verde
21 124 Brazil
15.1
33.9 Stateless***
Luxembourg
Malta
5.9
7.6
8.9
9.0
15.1
Romania
2 426 Moldova
32.0 Serbia
Slovenia
1 057 Bosnia & Herzegovina
53.9 Serbia
14.7 FYR of Macedonia
11.1
26.5 Vietnam
20.9 Czech Republic
15.8
28.1 Somalia
10.1 Iraq
Slovakia
Finland
Sweden
United Kingdom
234 Ukraine
8 260 Russia
43 510 Iraq
16.8 Finland
125 605 India
17.9 Pakistan
Iceland
595 Poland
25.0 Philippines
Liechtenstein
114 Turkey
31.6 Switzerland
Norway
15 866 Iraq
Switzerland
32 836 Italy
*
9.0 Afghanistan
13.6 Germany
3.0 Iraq
7.0 Somalia
10.3 Nigeria
8.7 Thailand
19.3 Austria
2.5
4.9
6.7
6.4
7.2
12.3
8.6 Somalia
7.4
12.3 Kosovo**
8.0
A recognised non-citizen is a person who is neither a citizen of the reporting country nor of any other country, and who has established links
to the reporting country which include some but not all rights and obligations of full citizenship. A majority of these persons were citizens of
the former Soviet Union.
** Kosovo under UN Security Council Resolution 1244.
*** A stateless person is someone who is not recognized as a citizen of any country.
The source dataset can be found here.
9 out of 10 persons granted an EU citizenship in 2014 were non-EU citizens
In fifteen EU Member States, at least 9 persons out of every 10 who obtained citizenship in 2014 were non-EU
citizens: Estonia (100%), Bulgaria (99%), Spain, Lithuania and Romania (all 98%), Greece and Latvia (both
97%), Denmark, Portugal and Slovenia (all 95%), Poland (94%), Italy (93%), the United Kingdom (92%),
Croatia (91%) and France (90%). In contrast, Luxembourg (82%), Hungary (77%) and – to a lower extent –
Malta (52%) were the only Member States where the majority of persons acquiring citizenship in 2014 were
citizens of another EU Member State. At EU level, 89% (or nearly 788 100 new citizens) of those granted
citizenship were non-EU citizens, and 11% (95 700) of another EU Member State.
Acquisition of citizenship in the EU Member States, 2014
of which (share of, %)
Total number
EU
Citizens of another
Non-EU citizens*
EU Member State
Citizenships acquired per:
1 000 resident
population**
100 resident
foreigners***
889 139
11%
89%
1.8
2.6
Belgium
18 726
28%
70%
1.7
1.5
Bulgaria
900
1%
99%
0.1
1.7
5 059
19%
80%
0.5
1.2
Czech Republic
Denmark
4 747
5%
95%
0.8
1.2
Germany
110 610
24%
75%
1.4
1.6
Estonia
1 614
0%
100%
1.2
0.8
Ireland
21 104
14%
86%
4.6
3.9
Greece
20 913
3%
97%
1.9
2.4
Spain
205 880
2%
98%
4.4
4.4
France
105 613
8%
90%
1.6
2.5
Croatia
686
9%
91%
0.2
2.2
Italy
129 887
7%
93%
2.1
2.6
Cyprus
2 277
33%
67%
2.7
1.4
Latvia
2 141
3%
97%
1.1
0.7
Lithuania
183
2%
98%
0.1
0.8
Luxembourg
3 206
82%
18%
5.8
1.3
Hungary
8 745
77%
23%
0.9
6.2
Malta
Netherlands
Austria
Poland
314
52%
47%
0.7
1.3
32 675
7%
89%
1.9
4.4
7 570
16%
84%
0.9
0.7
4 073
6%
94%
0.1
4.0
Portugal
21 124
5%
95%
2.0
5.3
Romania
2 426
1%
98%
0.1
3.3
Slovenia
1 057
5%
95%
0.5
1.1
Slovakia
234
24%
76%
0.0
0.4
8 260
11%
88%
1.5
4.0
Finland
Sweden
United Kingdom
Iceland
Liechtenstein
43 510
25%
74%
4.5
6.3
125 605
8%
92%
1.9
2.5
595
42%
58%
1.8
2.6
114
25%
75%
3.1
0.9
Norway
15 866
12%
88%
3.1
3.3
Switzerland
32 836
52%
48%
4.0
1.7
Figures may not add up due to unknown.
* Non-EU citizens are defined are those not having the citizenship of any of the 28 EU Member States. This category also includes stateless
persons and recognised non-citizens.
** Resident population refers to persons who have lived at their place of residence for at least 12 months or have the intention of staying there
for at least 12 months.
*** The term "foreigners" refers to all persons not having the citizenship of the reporting country and thus includes persons with the citizenship
of another country (including of another EU Member State), stateless persons and recognised non-citizens.
The source dataset can be found here.
Highest number of citizenships granted per inhabitants in Luxembourg, Ireland, Sweden and Spain
Almost 1 in every 4 persons who acquired an EU citizenship in 2014 became citizens of Spain (205 900 persons,
or 23% of all citizenships granted in the EU in 2014). It was followed by Italy (129 900 or 15%), the United
Kingdom (125 600 or 14%), Germany (110 600 or 12%) and France (105 600 or 12%).
When compared with the total resident population of each Member State, the highest numbers of citizenship
granted per 1 000 resident population were recorded in Luxembourg (5.8 citizenships granted), Ireland (4.6),
Sweden (4.5) and Spain (4.4). At EU level, 1.8 citizenships were granted per 1 000 inhabitants.
Highest naturalisation rate in Sweden, Hungary and Portugal
The naturalisation rate is the ratio of the number of persons who acquired the citizenship of a country during a year
over the stock of foreign residents in the same country at the beginning of the year. In 2014, the highest
naturalisation rates were registered in Sweden (6.3 citizenships granted per 100 resident foreigners), Hungary
(6.2) and Portugal (5.3), followed by Spain and the Netherlands (both 4.4). At the opposite end of the scale,
naturalisation rates below 1 citizenship per 100 resident foreigners were recorded in Slovakia (0.4), Latvia and
Austria (both 0.7), Estonia and Lithuania (both 0.8). At EU level, 2.6 citizenships were granted per 100 resident
foreigners in 2014.
Of the five EU Member States that granted the most citizenships in 2014, the naturalisation rate was above the EU
average in Spain (4.4), around the EU average in Italy (2.6), France and the United Kingdom (both 2.5), and
below the EU average in Germany (1.6).
Naturalisation rates in the EU Member States, 2014
(citizenships acquired per 100 resident foreigners)
7
6
5
4
3
2
1
0
Geographical information
The European Union (EU) includes Belgium, Bulgaria, the Czech Republic, Denmark, Germany, Estonia, Ireland, Greece,
Spain, France, Croatia, Italy, Cyprus, Latvia, Lithuania, Luxembourg, Hungary, Malta, the Netherlands, Austria, Poland,
Portugal, Romania, Slovenia, Slovakia, Finland, Sweden and the United Kingdom.
Methods and definitions
The acquisitions of citizenship data are provided 12 months after the reference period to Eurostat by the National Statistical
Institutes of the EU Member States in accordance with Regulation 862/2007.
Citizenship is the legal bond between an individual and a state, acquired by birth, naturalisation or other means according to
national legislation. Naturalisation is the process by which a state grants its citizenship through a formal act on the application
of the individual concerned. Other ways of granting citizenship may include spouses of nationals, minors adopted by nationals
and descendants of nationals born abroad returning to the country of origin of their ancestors. Regulation 862/2007 Art 3.1(d)
asks Member States to provide data on "persons having their usual residence in the territory of the Member State and having
acquired during the reference year the citizenship of the Member State and having formerly held the citizenship of another
Member State or a third country or having formerly been stateless, disaggregated by age and sex, and by the former citizenship
of the persons concerned and by whether the person was formerly stateless".
The naturalisation rate is the ratio of the number of persons who acquired the citizenship of a country during a calendar year
over the stock of foreign residents in the same country at the beginning of the year. The 'naturalisation rate' should be used with
caution because the numerator includes all modes of acquisitions and not just naturalisations of eligible residing foreigners and
the denominator includes all foreigners and not the relevant population, i.e. those foreigners who are eligible for naturalisation.
For more information
Eurostat database on migration and citizenship
Eurostat metadata on acquisition and loss of citizenship
Eurostat Statistics Explained article on acquisition of citizenship statistics
Eurostat interactive infographic on acquisition of citizenship in the EU
Issued by: Eurostat Press Office
Production of data:
Vincent BOURGEAIS
Tel: +352-4301-33 444
[email protected]
Silvia ANDUEZA-ROBUSTILLO
Tel: +352-4301-33 443
[email protected]
ec.europa.eu/eurostat
@EU_Eurostat
Media requests: Eurostat media support / Tel: +352-4301-33 408 / [email protected]
© Copyright 2026