
ICICI Bank - Business Standard
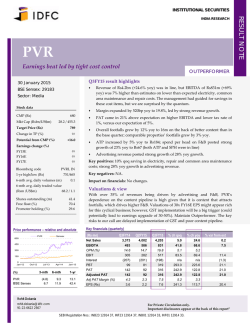
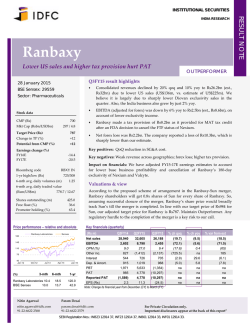
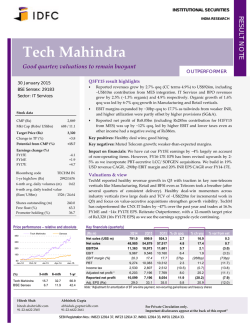
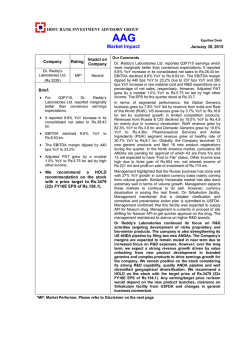
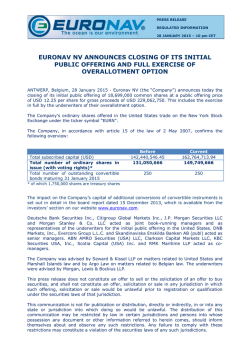
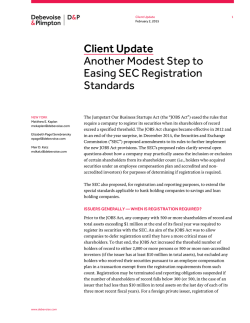
INSTITUTIONAL SECURITIES ICICI Bank Earnings in-line, but operationally modest OUTPERFORMER 30 January 2015 Q3FY15 result highlights BSE Sensex: 29183 ICICI Bank’s Q3FY15 profits were up 14% yoy, in-line with our estimates. Operationally, however, it was a modest quarter with core PPOP (ex-trading, forex gains) up 10% yoy and increased pressure on asset quality. Loan growth remained modest at 13% yoy – remains retail biased (+26% yoy), with domestic corporate lending slow at +4% yoy. NIMs were up 5bps qoq to 346bps on higher domestic NIMs (388bps in Q3). Core fee growth remains muted at +5.7% yoy, but was supported by forex gains on repatriation from overseas branches (Rs1.92bn) and treasury gains. Asset quality was weaker – stressed asset creation was higher at 3.5% annualized, NPLs increased to 3.5% loans, credit costs to 107bps and coverage levels reduced to 64%. Restructuring pipeline (Rs23bn) and management guidance suggests similar trends in slippages and credit costs in Q4FY15. Operating costs were up 9.5% yoy on tight cost controls, a key positive. Sector: Financials Stock data CMP (Rs) 361 Mkt Cap (Rstrn/USDbn) 2.1 / 33.7 Target Price (Rs) 425 Change in TP (%) +11.5 Potential from CMP (%) +17.8 Earnings change (%) FY15E FY16E FY17E Bloomberg code -1.8 -2.0 -2.0 ICICIBC IN 1-yr high/low (Rs) 393/189 6-mth avg. daily volumes (m) 12.30 6-mth avg. daily traded value (Rsm/USDm) 4009.1 / 64.73 Shares outstanding (m) Free float (%) Promoter holding (%) 5,792.5 100.0 - Price performance – relative and absolute Key positives: Improvement in NIMs, strong CASA mix (44%), cost control. Key negatives: Increase in asset quality stress, modest loan, fee income growth. Impact on financials: Reduce earnings by ~2% for FY15-17E on higher credit costs. Valuations & view ICICI Bank’s core operating profit remains subdued, asset stress was significantly higher and management commentary suggests caution near term. However, gradual rise in loan growth, improving ROEs (ex-subsidiary investments and dividends) to ~18% by FY17E (16% now) and possible monetization of stake in life insurance, should support higher valuations medium term. We revise our SOP based target price to Rs425, valuing the standalone bank at Rs375 per share (2.75x Mar’16E P/BV, from 2.5x) and its subsidiaries at Rs53. Maintain Outperformer. Key financials (quarterly) 3Q14A 2Q15A 3Q15A % ch qoq Net Interest Income 42,551 46,567 48,117 3.3 13.1 Non-Interest Income 28,010 27,384 30,917 12.9 10.4 1.9 150 Operating Income 70,561 73,951 79,033 6.9 12.0 (0.3) 115 Operating Expenses 26,170 26,971 28,663 6.3 9.5 (4.7) PPoP 44,390 46,980 50,370 7.2 13.5 2.4 6,946 8,495 9,797 15.3 41.0 21.8 (5.9) ICICI Bank Sensex 220 185 80 Jan-12 (%) ICICI Bank Sensex Oct-12 Jul-13 3-mth 11.7 6.7 Apr-14 6-mth 21.2 11.9 Jan-15 1-yr 85.1 42.4 Provisions % ch yoy % var from IDFC est (1.7) Taxes 12,122 11,394 11,683 2.5 (3.6) Net Profits 25,322 27,091 28,890 6.6 14.1 0.5 Advances 3,326,321 3,617,573 3,763,451 4.0 13.1 0.0 Deposits 3,169,695 3,520,554 3,553,397 0.9 12.1 (2.5) Manish Chowdhary Sameer Bhise [email protected] [email protected] 91-22-6622 2563 91-22-6622 2635 For Private Circulation only. Important disclosures appear at the back of this report” SEBI Registration Nos.: INB23 12914 37, INF23 12914 37, INB01 12914 33, INF01 12914 33. RESULT NOTE INDIA RESEARCH ICICI Bank – Q3FY15 result Exhibit 1: Quarterly results ICICI Bank 3Q15A 3Q14A % YoY 2Q15A 124352 114550 8.6 121507 (76,236) (71,999) 5.9 (74,939) 1.7 Net Interest Income 48,117 42,551 13.1 46,567 3.3 Fee-Based Income 26,487 23,540 12.5 24,364 8.7 Interest Income Interest Expense % QoQ Comments 2.3 Margins slightly higher qoq even as cost of funding and asset yields remain stable Includes Rs1.92bn of forex gains on repatriation of gains from overseas operations; core fees excluding this was up 5.7% yoy Other Non-Interest Income Non Interest Income Operating Income Operating Expenses 4,430 4,470 -0.9 3,020 46.7 30,917 28,010 10.4 27,384 12.9 79,033 70,561 12.0 73,951 6.9 (28,663) (26,170) 9.5 (26,971) 6.3 Strong treasury gains, in-line with our estimates Operating expenses lower than our estimates as management continues to focus on productivity, expect some catch in costs ahead Pre-Provision Profit 50,370 44,390 13.5 46,980 7.2 PPOP (ex-trading gains and one-off gains) was up a relatively moderate 10% yoy Charges for Bad Debts (9,797) (6,946) 41.0 (8,495) 15.3 Credit costs (107bps annualised) were higher than our estimates due to higher stress creation (Rs32bn, 3.5% of loans annualised) in Q3. Management expects stress creation to remain high in Q4FY15 as well Pre-Tax Profit Tax Net Profit 40,573 37,444 8.4 38,485 (11,683) 28,890 5.4 (12,122) -3.6 (11,394) 2.5 25,322 14.1 27,091 6.6 Earnings in-line with our estimates, though operating profitability was relatively modest and asset quality pressures higher than expected EPS Customer Loans 5.0 4.4 13.7 4.7 6.5 3,763,451 3,326,321 13.1 3,617,573 4.0 Loan growth remains modest - domestic loans were up 16% yoy, led by retail loans (up 26% yoy) Customer Deposits 3,553,397 3,169,695 12.1 3,520,554 0.9 AIEA 5,566,409 5,130,331 8.5 5,464,630 1.9 AIBL 5,111,493 4,711,053 8.5 5,062,467 1.0 Total Assets 6,170,984 5,741,258 7.5 6,111,428 1.0 Avg Assets 6,141,206 5,688,168 8.0 5,914,981 3.8 130,826 103,991 25.8 115,467 13.3 Non-Performing Loans (NPL) CASA ratio inches up marginally to 44% in Q3 Management guided to a restructuring pipeline of Rs23bn in Q4 and fresh stress creation (including slippages) of less than Rs35bn Loan Loss Reserves (LLR) (83,095) (72,807) 14.1 (76,044) 9.3 Shareholders’ Funds 817,594 740,566 10.4 788,703 3.7 141 128 10.0 136 3.6 Tier 1 ratio is quite comfortable at 12.96% as per Basel 3 Book Value Per Share 2 |IDFC SECURITIES 30 January 2015 ICICI Bank – Q3FY15 result Key Ratios (%) 3Q15A 3Q14A ∆ YoY (Bps) 2Q15A ∆ QoQ (Bps) ROAA (annualized) 1.9 1.78 10 1.8 5 ROAE (annualized) 14.1 13.68 46 13.7 39 Comments Profitability has been improving gradually, though remains lower than most peers Net Interest Margin (bps) 346 332 14 341 5 NIMs keep improving gradually, expect some moderation as interest rates decline medium term. Domestic NIMs now at 3.88% in Q3 Fee Inc/Operating Income 33.5 33.4 15 32.9 57 Other Non-Interest Inc/Op Inc 39.1 39.7 -58 37.0 209 Op. Cost/ Operating Income 36.3 37.1 -82 36.5 -20 Continued deceleration in cost ratios - amongst the lowest cost banks now Loan-to-Deposit Ratio (LDR) 105.9 104.9 97 102.8 316 3.5 3.1 35 3.2 28 NPL/Loan Ratio Total gross stressed assets now at 6.7% of loans (including restructured loans) LLR/NPL Ratio 64 70 -650 66 -234 Coverage levels drop further and will likely keep credit costs elevated near term Source: Company, IDFC Securities Research Other highlights ICICI Bank’s asset quality deterioration was relatively high in Q3 with incremental slippages at 2.5% of loans, annualized. Of these, slippages from restructured loans stood at Rs7.8bn (34% of Q3 slippages). Incremental restructurings in Q3 were at Rs17.7bn (1.9% of loans). Management reiterated its guidance of fresh impairment (slippages + incremental restructurings) in FY15E not exceeding FY14 levels (Rs104.5bn). For 9MFY15, ICICI Bank’s fresh impairment stands at Rs69.6bn. Management has guided to a restructuring pipeline of ~Rs23bn for Q4FY15E and closely monitoring some its restructured accounts. ICICI Bank’s gross stressed assets stand at 6.7% of loans (up 50bp qoq). Credit costs in Q3 increased 10bp qoq to 106bps due to higher stress creation during the quarter. Exhibit 1: GNPLs (%), Gross stressed assets (%) GNPLs (%) Slippages, Fresh restructurings (% of loans)* Fresh slippages (%of loans) Gross stressed assets (%) 7.5% 3.0% 6.0% 2.5% Fresh restructurings (%of loans) 2.0% 4.5% 1.5% 3.0% 1.0% 1.5% 0.5% 0.0% 0.0% 2Q13 3Q13 4Q13 1Q14 2Q14 3Q14 4Q14 1Q15 2Q15 3Q15 2Q13 3Q13 4Q13 1Q14 2Q14 3Q14 4Q14 1Q15 2Q15 3Q15 Source: Company, IDFC Securities Research *annualized Loan growth in Q3 slowed down to +13% yoy – growth was led primarily by retail loans (+26% yoy). Domestic corporate loans grew at a modest 4% yoy. SME loans increased +15% yoy. Within retail loans, growth in home loans (+27% yoy), personal loans (+121% yoy) and auto loans (+33% yoy) was robust and are expected to remain the key growth drivers near term. 3 |IDFC SECURITIES 30 January 2015 ICICI Bank – Q3FY15 result Exhibit 3: Overall loan growth and domestic loan growth (% yoy) Loan grow th (% yoy) Domestic loan grow th (% yoy) 25.0% 20.0% 15.0% 10.0% 5.0% 0.0% 2Q13 3Q13 4Q13 1Q14 2Q14 3Q14 4Q14 1Q15 2Q15 3Q15 Source: Company, IDFC Securities Research Exhibit 4: Loan mix (%) Domestic corporate Retail Loan mix (%) Retail SME International Others, 14.0% 100% Personal loans, 3.4% 75% Credit cards, 2.6% Business Banking, 5.6% 50% Home loans, 55.0% CV loans, 7.1% 25% Auto loans, 11.6% 0% 2Q13 3Q13 4Q13 1Q14 2Q14 3Q14 4Q14 1Q15 2Q15 3Q15 Source: Company, IDFC Securities Research Exhibit 5: SA (%), CA (%) and CASA growth (% yoy) Savings deposits (% of total - LHS) Current deposits (% of total - LHS) CASA (% yoy grow th - RHS) 50% 20% 40% 16% 30% 12% 20% 8% 10% 4% 0% 0% 2Q13 3Q13 4Q13 1Q14 2Q14 3Q14 4Q14 1Q15 2Q15 3Q15 Source: Company, IDFC Securities Research ICICI Bank’s CASA inched up 30bp qoq to 44% with savings deposits up 16% yoy and current account deposits up 11% yoy. NIMs increased 5bp qoq to 346bps in Q3 with domestic NIMs at 388bps (+4bp qoq) and international NIMs at 167bps (+9bp qoq). 4 |IDFC SECURITIES 30 January 2015 ICICI Bank – Q3FY15 result Exhibit 6: Domestic NIMs, International NIMs and overall NIMs (bps) Domestic NIMs (%) International NIMs (%) Overall NIMs (%) 500 400 300 200 100 0 2Q13 3Q13 4Q13 1Q14 2Q14 3Q14 4Q14 1Q15 2Q15 3Q15 Source: Company, IDFC Securities Research Core fee income growth for ICICI Bank was modest at 5.7% yoy. Management indicated continued pressure on corporate banking fees. Non-interest income was however, augmented by Rs1.92bn of forex gain on repatriation of overseas profits and relatively high treasury gains (Rs4.43bn). Management expects sluggishness in corporate fee income to continue to be a drag on overall fee income growth in the coming quarters, even as retail fee income growth is likely to remain healthy (led by insurance and MF distribution, higher processing fees). Exhibit 7: Core Fee income growth Core Fee income grow th (% yoy) 18.0% 13.5% 9.0% 4.5% 0.0% 2Q13 3Q13 4Q13 1Q14 2Q14 3Q14 4Q14 1Q15 2Q15 3Q15 Source: Company, IDFC Securities Research Employee expenses grew 12% yoy while other operating expense grew a modest 8% yoy. Total number of employees declined by 4,700 since Mar-14 to 67,510 employees (including 1,900 in Q3) as management continues to focus on increasing productivity. ICICI Bank’s core CIR (ex-trading gains) was down 100bp yoy to 38.4%. Its reported cost-income ratio declined to 36.3% in Q2 – management expects CIR to remain at current levels going forward. 5 |IDFC SECURITIES 30 January 2015 ICICI Bank – Q3FY15 result Exhibit 8: Cost-income ratio, core CIR (ex-trading gains) (%) Cost-income ratio (%) Employee expenses, other expenses (% yoy growth) Core CIR (ex-trading gains) Employee expenses (% yoy) 46.0% 45.0% 42.0% 30.0% 38.0% 15.0% 34.0% 0.0% 30.0% Other expenses (% yoy) -15.0% 2Q13 3Q13 4Q13 1Q14 2Q14 3Q14 4Q14 1Q15 2Q15 3Q15 2Q13 3Q13 4Q13 1Q14 2Q14 3Q14 4Q14 1Q15 2Q15 3Q15 Source: Company, IDFC Securities Research Exhibit 10: Earnings revision ummary Net profit EPS Dividend Old New % change Old New % change Old New FY15E 113,576 111,514 (1.8) 19.7 19.3 (1.8) 5.2 5.2 FY16E 135,072 132,396 (2.0) 23.4 22.9 (2.0) 6.0 6.0 FY17E Source: IDFC Securities Research 162,706 159,425 (2.0) 28.2 27.6 (2.0) 7.0 7.0 Exhibit 11: Sum of Parts Summary Business Segment Rs/Share (Old) Rs/Share (New) 341 373 4 6 13 20 20x NBAP Multiple, 15% Margins Non-Life Insurance 9 13 15x Mar-16E profits Broking 2 3 10x Mar016E profits Housing Finance 2 2 1x Networth 10 10 1x Networth 381 426 Standalone Bank Asset Management Life Insurance International Subs, Others Total Source: IDFC Securities Research 6 |IDFC SECURITIES Valuation Basis 2.75x Mar-16E P/BV adjusted for investments in subsidiaries 4% of Mar-16E AUMs 30 January 2015 ICICI Bank – Q3FY15 result Income statement Valuation Metrics Year to 31 Mar (Rs m) Net Interest Income FY14 FY15E FY16E FY17E FY13 FY14 FY15E FY16E FY17E 138,664 164,756 189,121 FY13 222,411 264,647 Net Profit 83,255 98,105 111,514 132,396 159,425 EPS (Rs) 14.4 17.0 19.3 22.9 27.6 EPS growth (%) 28.7 17.7 13.6 18.7 20.4 PE (x) 25.0 21.2 18.7 15.7 13.1 yoy growth (%) 29.2 Fee Income Trading Profits 18.8 14.8 17.6 19.0 77,806 100,105 102,074 118,466 140,056 16,069 11,248 9,561 83,457 104,279 118,143 129,714 149,617 P/BV (x) 3.1 2.8 2.6 2.3 2.0 222,121 269,034 307,264 352,126 414,264 P/Adj BV (x) 3.2 3.0 2.8 2.5 2.2 14.6 17.6 P/PPOP (x) 15.8 12.5 10.8 9.4 8.0 RoA (%) 1.6 1.7 1.8 1.8 1.9 RoE (%) 13.1 14.0 14.5 15.5 16.6 1.1 1.3 1.4 1.7 1.9 5,651 Non Interest income Net Operating Revenue yoy growth (%) 4,174 21.8 Operating Expenses 21.1 14.2 (90,129) (103,089) (114,240) (131,430) (153,778) yoy growth (%) 10.8 15.0 17.0 131,992 165,946 193,024 14.8 220,696 260,486 16.3 14.3 18.0 Provisions for Bad Debts (18,025) (26,264) (34,848) (31,559) (32,735) Profit Before Tax 113,967 139,682 158,177 189,137 227,750 Tax (30,712) (41,577) (46,662) (56,741) (68,325) PPoP yoy growth (%) 14.4 27.1 Profit After Tax 83,255 yoy growth (%) 25.7 98,105 111,514 28.8 17.8 13.7 132,396 18.7 159,425 20.4 Balance sheet As on 31 Mar (Rs m) FY13 FY14 FY15E FY16E FY17E Customer Loans 2,902,494 3,387,026 3,869,003 4,570,690 5,404,380 yoy growth (%) 14.4 16.7 14.2 18.1 18.2 Investments 1,713,936 1,770,218 1,931,958 2,214,451 2,602,736 414,175 415,296 421,227 475,707 535,470 Fixed Assets 46,471 46,781 51,459 56,605 62,266 Other Assets 290,871 327,094 359,803 395,784 435,362 5,367,947 5,946,416 6,633,450 7,713,237 9,040,214 Cash & bank balances Total assets Networth 667,060 732,133 809,863 903,276 1,017,221 Deposits 2,926,136 3,319,137 3,752,762 4,545,770 5,545,839 12.6 13.0 12.8 12.7 12.7 - Current % - Savings % 29.3 29.9 30.6 30.4 30.4 - Term % 58.1 57.1 56.6 57.0 57.0 1,120,563 1,213,002 1,344,322 1,490,278 1,652,557 650,688 678,644 723,003 770,414 821,096 Borrowings Other Liabilities Year to 31 Mar Net Interest Margin Key Financials ratios Year to 31 Mar FY13 290 FY14 FY15E FY16E 309 319 328 FY13 FY14 FY15E FY16E FY17E RoA 1.6 1.7 1.8 1.8 1.9 RoE 13.1 14.0 14.5 15.5 16.6 Tier I Capital adequacy 11.7 12.8 13.6 12.8 12.2 Gross NPL 3.3 3.1 3.7 3.3 2.9 Net NPL 0.8 1.0 1.6 1.2 1.1 Loan Loss Coverage 76.8 68.6 57.5 61.6 63.8 CASA ratio 41.9 42.9 43.4 43.0 43.0 Assets / Equity Dividend Payout 8.0 8.1 8.2 8.5 8.9 27.7 27.1 26.9 26.2 25.4 1-year forward P/BV (x) -1SD Avg. Icici Bank Ltd +1SD 4.0 3.0 2.0 1.0 0.0 Jan06 Operating Ratios Year to 31 Mar (Rs m) Dividend Yield (%) Jan07 Jan08 Jan09 Jan10 Jan11 Jan12 Jan13 Jan14 Jan15 FY17E 333 Non Interest Income / Operating Income 37.6 38.8 38.5 36.8 36.1 Cost/Income 40.6 38.3 37.2 37.3 37.1 Operating Expense/Avg assets 1.8 1.8 1.8 1.8 1.8 Credit Costs / Avg Loans 0.7 0.8 1.0 0.7 0.7 Effective Tax Rate 26.9 29.8 29.5 30.0 30.0 Loan Deposit Ratio 99.2 102.0 103.1 100.5 97.4 Shareholding pattern Nonpromoter corporate holding 2.2% Public & Others 5.2% Institutions 21.4% Foreign 71.1% As of December 2014 7 |IDFC SECURITIES 30 January 2015 ICICI Bank – Q3FY15 result Disclaimer This document has been prepared by IDFC Securities Ltd (IDFC SEC). IDFC SEC is a full-service, integrated investment banking, and institutional broking group. There are no material disciplinary actions taken against IDFC SEC. Details of associates of IDFC SEC are attached as annexure. This document does not constitute an offer or solicitation for the purchase or sale of any financial instrument or as an official confirmation of any transaction. The information contained herein is from publicly available data or other sources believed to be reliable. While we would endeavour to update the information herein on reasonable basis, the opinions and information in this report are subject to change without notice and IDFC SEC, its subsidiaries and associated companies, their directors and employees (“IDFC SEC and affiliates”) are under no obligation to update or keep the information current. Also, there may be regulatory, compliance, or other reasons that may prevent IDFC SEC and affiliates from doing so. Thus, the opinions expressed herein should be considered those of IDFC SEC as of the date on this document only. We do not make any representation either express or implied that information contained herein is accurate or complete and it should not be relied upon as such. The information contained in this document has no regard to the specific investment objectives, financial situation or particular needs of any specific recipient. This document is prepared for assistance only and is not intended to be and must not alone be taken as the basis for an investment decision. The investment discussed or views expressed in the document may not be suitable for all investors. Investors should make their own investigations as they deem necessary to arrive at an independent evaluation of an investment in the securities of companies referred to in this document (including the merits and risks involved) and investment decisions based upon their own financial objectives and financial resources. Investors assume the entire risk of any use made of the information contained in the document. Investments in general involve some degree of risk, including the risk of capital loss. Past performance is not necessarily a guide to future performance and an investor may not get back the amount originally invested. Foreign currency-denominated securities are subject to fluctuations in exchange rates that could have an adverse effect on the value or the price of, or income derived from, the investment. In addition, investors in securities, the values of which are influenced by foreign currencies, effectively assume currency risk. Affiliates of IDFC SEC may have issued other reports that are inconsistent with and reach different conclusions from, the information presented in this report. This report is not directed or intended for distribution to, or use by, any person or entity who is a citizen or resident of or located in any locality, state, country or other jurisdiction, where such distribution, publication, availability or use would be contrary to law, regulation or which would subject IDFC SEC and affiliates to any registration or licensing requirement within such jurisdiction. The securities described herein may or may not be eligible for sale in all jurisdictions or to a certain category of investors. Persons in whose possession this document may come are required to inform themselves of, and to observe, such applicable restrictions. Reports based on technical analysis centers on studying charts of a stock's price movement and trading volume, as opposed to focusing on a company's fundamentals and, as such, may not match with a report on a company's fundamentals. IDFC SEC and affiliates, their directors, officers, and employees may from time to time have positions in, purchase or sell, or be materially interested in any of the securities mentioned or related securities. IDFC SEC and affiliates may from time to time solicit from, or perform investment banking, or other services for, any company mentioned herein. Without limiting any of the foregoing, in no event shall IDFC SEC, any of its affiliates or any third party involved in, or related to, computing or compiling the information have any liability for any damages of any kind including but not limited to any direct or consequential loss or damage, however arising, from the use of this document. Any comments or statements made herein are those of the analyst and do not necessarily reflect those of IDFC SEC and affiliates. This document is subject to changes without prior notice and is intended only for the person or entity to which it is addressed and may contain confidential and/or privileged material and is not for any type of circulation. Any review, retransmission, or any other use is prohibited. Though disseminated to all the customers simultaneously, not all customers may receive this report at the same time. IDFC SEC will not treat recipients as customers by virtue of their receiving this report. IDFC Capital (USA) Inc. has reviewed the report and, to the extent that it includes present or past information, it is believed to be reliable, although its correctness cannot be assured. The analyst certifies that all of the views expressed in this research report accurately reflect his/her personal views about any and all of the subject issuer(s) or securities. The analyst certifies that no part of her compensation was, is, or will be directly or indirectly related to the specific recommendation(s) and/or views expressed in this report. Additional Disclosures of interest: Unless specifically mentioned in Point No. 9 below: 1. The Research Analyst(s), IDFC Sec, Associate of Analyst or his relative does not have any financial interest in the company(ies) covered in this report. 2. The Research Analyst, IDFC SEC or its associates or relatives of the Research Analyst affiliates collectively do not hold more than 1% of the securities of the company (ies) covered in this report as of the end of the month immediately preceding the distribution of the research report. 3. The Research Analyst, his associate, his relative and IDFC SEC do not have any other material conflict of interest at the time of publication of this research report. 4. The Research Analyst, IDFC SEC and its associates have not received compensation for investment banking or merchant banking or brokerage services or for any other products or services from the company(ies) covered in this report, in the past twelve months. 5. The Research Analyst, IDFC SEC or its associates have not managed or co-managed in the previous twelve months, a private or public offering of securities for the company (ies) covered in this report. 6. IDFC SEC or its associates have not received compensation or other benefits from the company(ies) covered in this report or from any third party, in connection with the research report. 7. The Research Analyst has not served as an Officer, Director or employee of the company (ies) covered in the Research report. 8. The Research Analyst and IDFC SEC has not been engaged in market making activity for the company(ies) covered in the Research report. 9. Details IDFC SEC , Research Analyst and its associates pertaining to the companies covered in the Research report: Sr. No. 1. 2. 3. 4. 5. Particulars Yes / No. Whether compensation has been received from the company(ies) covered in the Research report in the past 12 months for investment banking transaction by IDFC SEC Whether Research Analyst, IDFC SEC or its associates or relatives of the Research Analyst affiliates collectively hold more than 1% of the company(ies) covered in the Research report No. No Whether compensation has been received by IDFC SEC or its associates from the company(ies) covered in the Research report No IDFC SEC or its affiliates have managed or co-managed in the previous twelve months a private or public offering of securities for the company(ies) covered in the Research report Research Analyst, his associate, IDFC SEC or its associates have received compensation for investment banking or merchant banking or brokerage services or for any other products or services from the the company(ies) covered in the Research report, in the last twelve months No No Explanation of Ratings: 1. Outperformer 2. Neutral 3. Underperformer : : : More than 5% to Index Within 0-5% (upside or downside) to Index Less than 5% to Index Copyright in this document vests exclusively with IDFC Securities Ltd. 8 |IDFC SECURITIES 30 January 2015 ICICI Bank – Q3FY15 result Annexure Associates of IDFC Securities Limited Sr. No. Name of Company Category Non Banking Finance Company, SEBI registered Merchant Banker, SEBI registered Debenture Trustee 1. IDFC Ltd. 2. IDFC Capital (USA) INC. Subsidiary Broker Dealer registered with FINRA 3. IDFC Capital (Singapore) Pte. Ltd. Subsidiary Fund Manager 4. IDFC Securities Singapore Pte. Ltd. Subsidiary Dealing in Securities 5. IDFC Fund of Funds Limited Subsidiary Sponsor Investments 9 |IDFC SECURITIES Parent Nature of business 30 January 2015 ICICI Bank – Q3FY15 result www.idfc.com Analyst Sector/Industry/Coverage E-mail Anish Damania Shirish Rane Co-CEO - IDFC Securities, Head - Institutional Equities; Strategy Head of Research; Construction, Power [email protected] [email protected] Tel.+91-22-6622 2600 Prakash Joshi Oil & Gas, Metals, Mining [email protected] 91-22-662 22564 Nitin Agarwal Pharmaceuticals, Real Estate, Agri-inputs [email protected] 91-22-662 22568 91-22-6622 2522 91-22-662 22575 Hitesh Shah IT Services & Telecom [email protected] 91-22-662 22565 Manish Chowdhary Financials [email protected] 91-22-662 22563 Bhoomika Nair Engineering, Cement, Power Equipment, Logistics [email protected] 91-22-662 22561 Ashish Shah Construction, Power [email protected] 91-22-662 22560 Deepak Jain Vijayaraghavan G Automobiles, Auto ancillaries Midcaps [email protected] [email protected] 91-22-662 22562 91-22-662 22690 Rohit Dokania Media & Entertainment [email protected] 91-22-662 22567 Abhishek Gupta Telecom, IT services [email protected] 91-22-662 22661 Mohit Kumar, CFA Construction, Power [email protected] 91-22-662 22573 Param Desai Pharmaceuticals, Real Estate, Agri-inputs [email protected] 91-22-662 22579 Sameer Narang Strategy, Economy [email protected] 91-22-662 22566 Probal Sen Oil & Gas [email protected] 91-22-662 22569 Saumil Mehta Metals, Mining [email protected] 91-22-662 22578 Harit Kapoor FMCG, Retail, Alcoholic Beverages [email protected] 91-22-662 22649 Sameer Bhise Financials [email protected] 91-22-662 22635 Abhishek Ghosh Engineering, Cement, Power Equipment, Logistics [email protected] 91-22-662 22658 Saksham Kaushal Automobiles, Auto ancillaries [email protected] 91-22-662 22529 Dharmendra Sahu Database Analyst [email protected] 91-22-662 22580 Equity Sales/Dealing Designation E-mail Tel.+91-22-6622 2500 Ashish Kalra Managing Director, Sales [email protected] 91-22-6622 2525 Rajesh Makharia Director, Sales [email protected] 91-22-6622 2528 Palak Shah SVP, Sales [email protected] 91-22-6622 2696 Varun Saboo VP, Sales [email protected] 91-22-6622 2558 Arati Mishra VP, Sales [email protected] 91-22-6622 2597 Hemal Ghia VP, Sales [email protected] 91-22-6622 2533 Tanvi Dixit AVP, Sales [email protected] 91-22-6622 2595 Nirav Bhatt AVP, Sales [email protected] 91-22-6622 2681 Chandan Asrani Manager, Sales [email protected] 91-22-6622 2540 Sneha Baxi Manager, Sales [email protected] 91-22-6622 2537 Suryakant Bhatt Director & Head - Sales trading [email protected] 91-22-6622 2693 Mukesh Chaturvedi Director, Sales trading [email protected] 91-22-6622 2512 Viren Sompura SVP, Sales trading [email protected] 91-22-6622 2527 Rajashekhar Hiremath SVP, Sales trading [email protected] 91-22-6622 2516 Alok Shyamsukha VP, Sales trading [email protected] 91-22-6622 2523 Suketu Parekh VP, Sales trading [email protected] 91-22-6622 2674 IDFC Securities Naman Chambers, C-32, 7th floor, G- Block, Bandra-Kurla Complex, Bandra (East), Mumbai 400 051 INDIA IDFC Capital (USA) Inc, Regus Business Centre 600 Third Avenue, 2nd Floor, New York,10016 Tel: +91 22 6622 2600 Tel: +1 646 571 2303 Our research is also available on Bloomberg and Thomson Reuters For assistance in access, please contact [email protected] |IDFC SECURITIES 10any 30 January 2015

© Copyright 2026