
Vale Indonesia - Danareksa Sekuritas Online Trading
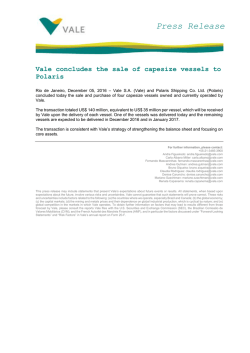
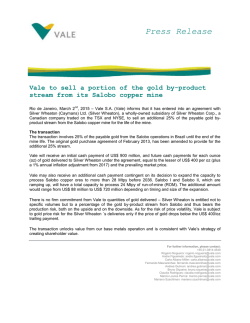
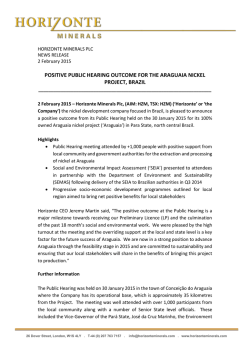
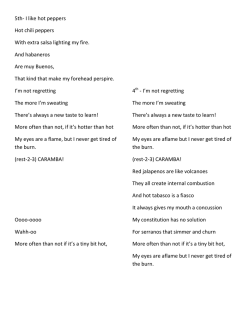
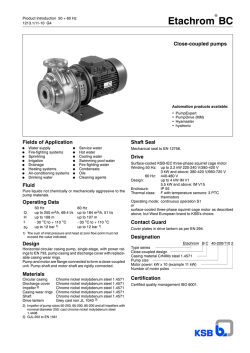
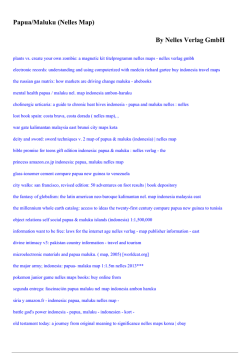
Wednesday, 28 January 2015
MINING/ COMPANY UPDATE
Vale Indonesia
BUY
Target Price, Rp
4,700
Upside
30.9%
INCO IJ/INCO.JK
Last Price, Rp
No. of shares (bn)
3,590
9.9
Market Cap, Rpbn
35,671
(US$ mn)
3M T/O, US$mn
2,861
2.6
Last Recommendation
21-Aug-14
22-May-2014
08-May-14
BUY
BUY
BUY
Rp4,700
Rp4,500
Rp4,500
Company relative to JCI Index
INCO (LHS)
Relative to JCI (RHS)
(Rp)
(%)
5000
80
4500
60
4000
40
3500
20
3000
0
2500
2000
1/28/14
4/28/14
7/28/14
10/28/14
-20
1/28/15
Market Recommendation
Buy
14
Hold
Sell
3
1
Consensus
Target Price, IDR
EPS 2014F, IDR
PE 2014F, x
Our
4,700
183
19.5
Cons
4,513
224
16.0
% Diff
4
-18
22
Stefanus Darmagiri
(62-21) 2955 5777 ext 3530
[email protected]
Danareksa research reports are also
available at Reuters Multex and First
Call Direct and Bloomberg.
4Q14 Preview: Lower profits qoq, but higher yoy
While the 12% qoq lower nickel price will hit the net profits of Vale Indonesia (INCO)
in 4Q14, we still expect solid net profits in 2014 thanks to firmer nickel prices and the
full operation of its coal conversation projects. Going into 2015, we expect the
company to continue posting stronger results given: a) better expected nickel prices,
b) the collapse in crude oil prices which will lower company’s production cost and help
improve margins further. As such, we still maintain our BUY call on the company with
a Target Price of Rp4,700 based on DCF valuation (WACC: 12.2% and long-term growth
of 3%). Our Target Price implies 21x 2015F PE.
4Q14 preview: lower net profits qoq due to weak nickel prices, but higher yoy
Although the nickel-in-matte sales volume is expected to be stable at around 19,800
tons in 4Q14, we expect the company to post lower quarterly net profits in 4Q14 owing
to depressed nickel prices. Note that with the LME nickel prices declining by 11.9% qoq
to US$16,563/ton in the period from September to November 2014, the company’s ASP
will reach an estimated US$12,919/ton (-11.6% qoq) in 4Q14, based on 78% of the
previous month’s average LME cash price. For 2014, however, we expect a stronger
result given: a) higher LME nickel prices (+12.5% yoy to US$16,900/ton) and b) the full
operation of coal conversion project phase 1 for dryers (CCP1) in 4Q13.
Lower crude oil prices and…
With the crude oil (Brent) price more than halving from US$103/bbl in September 2014
to its current level of US$48/bbl, the company should benefit from a decline in the High
Sulphur Fuel Oil (HSFO) price. Yet since the company’s average HSFO price usually lags
the crude oil price by between 2 to 3 months, we only expect a partial impact from
lower HSFO prices in 1Q15 with the full impact seen in 2Q15. Given that HSFO and
diesel accounted for about 30% of the company’s total costs in 3Q14, the impact on
lowering costs should be quite large in our view. In our sensitivity analysis, every 5.0%
decline in the HSFO price leads to 3.3% higher earnings in 2015. As such, the
management expects further reductions in the COGS per ton to about US$8,100/ton in
2015 from US$9,100/ton in2014.
…higher expected nickel prices to improve margins further in 2015
We expect INCO to only maintain nickel production at around 79,000 tons in 2015
(2014F: 78,000 – 79,000 tons) as the company plans to postpone the upgrade of its
electric furnace (EF) No. 1 from the beginning of 2015 to the second or third quarter of
2016. Nickel prices should strengthen in 2015, in our view, since we believe the global
nickel market will turn into a deficit given Indonesia’s continued nickel ore export ban,
the slow development of smelters in Indonesia, and expected demand recovery for
nickel (8.3% yoy higher in 2015, in our estimate). Against this backdrop, the company’s
gross margin should further improve to 32% in 2015 from an estimated 29% in 2014.
Revenue, USD mn
EBITDA, USD mn
EBITDA Growth, %
Net profit, USD mn
EPS, USD
EPS growth, %
BVPS, USD
DPS, USD
Net Gearing, %
PER, x
PBV, x
EV/EBITDA, x
Yield, %
2012A
967
256
-55.6
67
0.0068
-79.8
0.1732
0.0116
4.8
45.0
1.8
11.9
3.8
2013A
922
236
-8.0
39
0.0039
-42.7
0.1725
0.0050
1.1
78.5
1.8
12.9
1.6
2014F
1,069
403
70.9
155
0.0156
302.2
0.1883
0.0023
-1.1
19.5
1.6
7.6
0.8
2015F
1,138
459
13.8
191
0.0192
22.6
0.1956
0.0094
-3.0
15.9
1.6
6.7
3.1
2016F
1,242
517
12.6
234
0.0236
22.9
0.2101
0.0115
-9.8
13.0
1.5
5.9
3.8
28 January 2015
Vale Indonesia
Exhibit 01. Nickel prices and inventory level
US$/ton
25,000
tons
480,000
430,000
380,000
20,000
330,000
280,000
230,000
15,000
180,000
130,000
10,000
Jan 12
80,000
Jul 12
Jan 13
Inventory (RHS)
Jul 13
Jan 14
Market Price (LHS)
Jul 14
Jan 15
Average 3-month Price (LHS)
Source: Bloomberg, Danareksa Sekuritas
Exhibit 02. Nickel prices and inventory level
US$/ton
tons
20,000
25,000
15,000
20,000
10,000
15,000
5,000
10,000
1Q13
2Q13
3Q13
4Q13
1Q14
2Q14
Sales Volume (LHS)
3Q14
4Q14F
ASP (RHS)
Source: Vale Indonesia, Bloomberg, Danareksa Sekuritas
Exhibit 03.The HSFO price to follow crude oil prices
US$/bbl
160
Crude Oil Price
Exhibit 04. Energy accounted for 30% of total costs
HSFO Price
100%
90%
80%
70%
60%
50%
40%
30%
20%
10%
0%
140
120
100
80
60
40
14.5 12.4 12.7 12.7 13.4 13.5 14.5 15.4 17.1 17.0 16.8
44.2 46.9 48.8 45.9 46.9
52.6 49.0
53.3 50.2 51.4 52.8
6.3
6.0
5.9
6.1
6.1
6.2
6.7
7.3 7.7 8.3 7.8
36.4
33.8
33.6
31.4
31.2
26.0 32.1
23.3 24.4 22.6 21.8
1Q12
3Q12
1Q13
3Q13
1Q14
3Q14
20
2007 2008
2009
2010 2011
Source: Bloomberg, Vale Indonesia
2012
2013
2014
2015
HSFO
Diesel
Other Energy
Non Energy
Depreciation
Source: Vale Indonesia
2
28 January 2015
Vale Indonesia
Exhibit 06.Profit and Loss, USDmn
Turnover
COGS
Gross Profit
Operating Expenses
Operating Profit
Other Income/Expense
Net Interest
Pre-tax Profit
Tax
Minority Interest
Extraordinary Items
Net Profit
2012
2013
2014F
2015F
2016F
967
(801)
167
(13)
154
(48)
(15)
91
(24)
0
0
67
922
(782)
140
(13)
127
(57)
(14)
55
(17)
0
0
39
1,069
(763)
306
(16)
290
(67)
(16)
207
(52)
0
0
155
1,138
(779)
358
(17)
341
(70)
(17)
254
(64)
0
0
191
1,242
(829)
413
(19)
394
(70)
(12)
312
(78)
0
0
234
Source: Company, Danareksa Sekuritas
Exhibit 07.Balance Sheet, USDmn
2012
2013
2014F
2015F
2016F
Current Assets
Cash and Cash Equivalents
Account Receivables
Inventories, Net
Other Current Assets
Total Current Assets
Fixed Assets
Goodwill
Other LT Assets
Total Assets
172
113
153
98
536
1,625
0
173
2,333
200
66
151
124
541
1,652
0
89
2,281
284
94
147
104
629
1,689
0
167
2,484
334
97
153
109
692
1,721
0
175
2,587
405
102
129
116
752
1,748
0
191
2,691
Current Liabilities
ST Debt
Other Current Liabilities
Total Current Liabilities
LT Debt
Other LT Liabilities
Minority Interests
Shareholders' Equity
Total Equity & Liabilities
36
130
166
220
226
0
1,721
2,333
36
133
169
183
215
0
1,714
2,281
75
127
202
188
224
0
1,871
2,484
38
140
178
238
228
0
1,944
2,587
0
161
161
200
243
0
2,088
2,691
Source: Company, Danareksa Sekuritas
3
28 January 2015
Vale Indonesia
Exhibit 08.Cash Flow, USDmn
2012
2013
2014F
2015F
2016F
67
102
(11)
(84)
75
39
109
20
74
242
155
113
(10)
(70)
189
191
118
(0)
(1)
307
234
123
29
1
387
Capex
Investment
Others Investing Activities
Investing Cash Flow
(148)
0
(13)
(161)
(138)
0
17
(121)
(150)
0
0
(150)
(150)
0
(2)
(152)
(150)
0
(1)
(151)
Net Change in Debt
Dividend
Others Financing Activities
Financing Cash Flow
(37)
(115)
10
(142)
(37)
(50)
(6)
(93)
43
(23)
24
44
13
(93)
(24)
(105)
(75)
(114)
25
(164)
Net change in cash
Net Cash (debt) at beg.
Net Cash (debt) at end.
(227)
399
172
28
172
200
84
200
284
50
284
334
71
334
405
2012
2013
2014F
2015F
2016F
17.2
26.5
15.9
7.0
3.9
2.8
4.8
15.2
25.6
13.8
4.2
2.3
1.7
1.1
28.6
37.7
27.1
14.5
8.7
6.5
(1.1)
31.5
40.3
30.0
16.8
10.0
7.5
(3.0)
33.3
41.6
31.8
18.9
11.6
8.9
(9.8)
Net Profit
Depreciation and amortization
Change in Working Capital
Others Non-Cash
Operating Cash Flow
Source: Company, Danareksa Sekuritas
Exhibit 09.Key Ratios
Gross Margin, %
EBITDA Margin, %
Operating Margin, %
Net Margin, %
ROE, %
ROA, %
Net Gearing, %
Source: Company, Danareksa Sekuritas
4
28 January 2015
Vale Indonesia
5


© Copyright 2026