
A pyroclastic origin for cones in Isidis Planitia: 1. Physical modeling
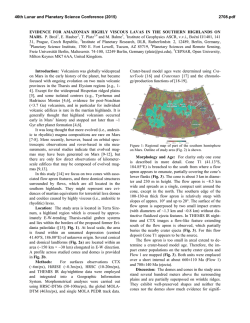
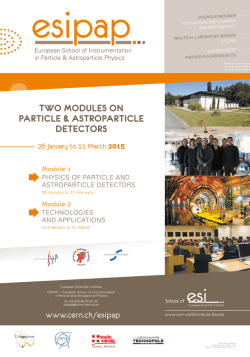
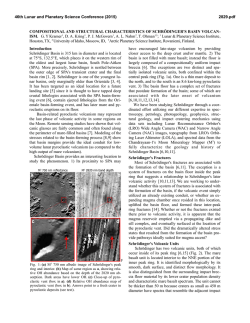
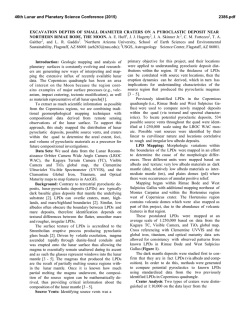
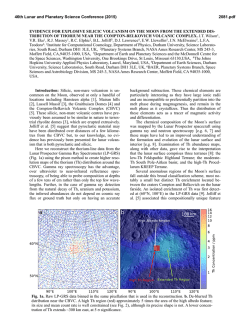
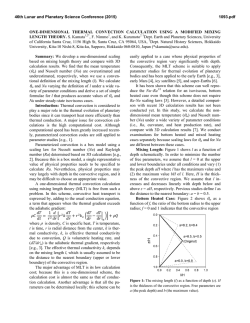
46th Lunar and Planetary Science Conference (2015)
2502.pdf
A pyroclastic origin for cones in Isidis Planitia: 1. Physical modeling and constraints. Cailin L. Gallinger1 and
Rebecca R. Ghent1,2, 1Department of Earth Sciences, University of Toronto, 22 Russell St, Toronto, ON M5S 3B1,
Canada. mailto: [email protected]. 2Planetary Science Institute, Tucson, AZ, USA.
Introduction: Isidis Planitia, a 1100 km-wide
infilled impact basin in the eastern equatorial region of
Mars, has been known since the Mariner missions to
contain a geologic unit covered in highly organized
surface features [1]. Originally called “thumbprint terrain”, high-resolution images from the Mars Odyssey
THEMIS and the Mars Express CTX and HiRISE instruments have shown these features to actually be
composed of multiple relatively small (200-1000 m
diameter), evenly-sized, and evenly-distributed cones
of contested origin [2]. We present herein the first of a
three-part investigation that examines the possibility of
a pyroclastic origin for these cones and the geologic
unit containing them, building on previous work by
Ghent et al. [3]. Pyroclastic volcanism has recently
been shown to be a significant but oft-overlooked part
of the Martian geologic record [4], and therefore finding evidence of its extent is especially important in
understanding the evolution of the Martian crust and
Martian igneous processes.
Previous work: Cone chains in Isidis were mapped
extensively by Hiesinger et al. [5]. They constrained
the timing of cone formation to be contemporaneous
with the emplacement of the AIi unit as defined by
Tanaka et al. [6] through cross-cutting relationships
with quasi-circular depressions (QCDs), which formed
from differential compaction of the unit into craters
after deposition. Lack of flow margin morphology implies the cones were formed from solid, particulate
material. [3] proposed that devolatilization of a hot ash
layer (or of volatiles underlying the deposition site)
was readily capable of producing the observed cone
Figure 2. Portion of THEMIS Night IR 100m Global Mosaic
(v14.0) centered at 84.00E, 16.15N. Blue indicates regions of
low thermal inertia that correspond to cone chain ejecta,
which were averaged to obtain particle diameter estimates.
sizes and numbers, even with volatile contents as low
as 2.0 × 10⁵ wt.%. Thus, we examine the other end of
this scenario: the feasibility of a large pyroclastic flow
being emplaced in Isidis under local conditions.
Modelling pyroclastic density currents (PDCs):
Pyroclastic density currents (PDCs) are complex, turbulent flows composed of a mixture of hot gases and
suspended particles. In order to model a putative column-collapse PDC, we implemented a simplified box
model which simulates a two-dimensional flow from a
contained initial volume under the influence of gravity
and atmospheric buoyancy, after [7]. The model obeys
simple momentum, mass, and energy conservation
laws, as well as basal friction incorporated into the
Froude number (Fr). A constant particle-settling velocity ω was applied, as determined by the Newtown impact law [8]:
where d is particle diameter (in m), Cd is the drag coefficient (taken to be 1 as in [8]), and g’ is the reduced
gravity:
Figure 1. Fig. 11 from Ghent et al. [3] showing cone chains
(white lines), dense cone fields (yellow outline), QCDs (red
and green circles), thermal boundary of the AIi unit (black
arrows), and arrows indicating proposed direction of pyroclastic flow lobes.
where g is the Martian gravitational acceleration (~3.7
m s−1) and ρp and ρ0 are the particle and background
atmospheric densities, respectively. For this model, the
interstitial gas density of the current is assumed to be
equal to the background atmospheric density, and the
gases are assumed to be incompressible.
46th Lunar and Planetary Science Conference (2015)
2502.pdf
Table 1: Variable parameters used to test model runout lengths.
Average (or typical)
Min. value
value
Q0
m2
1.66 × 10⁸
4.75 × 10⁷ a
-3
b
ρp
kg m
1900
700b
c
C0
0.067
0.05c
-4
d
m
4.16 × 10
1.19 × 10⁻⁴ d
b
Cd
1
0.44b
e
Fr
1.3
1.2e
a
c
Ghent et al. (2012) [3]
Dobran et al. (1994) [10]
b
d
Dellino et al. (2005) [8]
derived from thermal inertia – see text
Variable
Unit
Finally, the concentration of particles suspended in
the current is determined by:
where C0 is the initial concentration of particles, hc is
the height of the current (in m), and t is time (in s).
The resulting runout length of the current was taken
to be the length reached when the particle concentration dropped to zero. In the case of a dilute current
released from an initial finite volume Q0 into a fluid
depth much greater than the column height, the system
of equations can be solved to give:
A summary of the values for each of the parameters
used and their sources is shown in Table 1. All values
were obtained either through analysis of local conditions in Isidis (e.g. pressure from MOLA altitude) or
through comparison to terrestrial pyroclastic flows.
Most parameters had very little influence on the resulting runout length, and all results were within the range
of several hundred km (compare with Figure 1).
Derivation of particle size: The model employed
here assumes a single, uniform particle size, whereas
in a typical PDC the range of particle sizes can vary by
several orders of magnitude. Therefore appropriate
selection of a mean or typical particle size was crucial
to constrain the model results. We utilized the method
of [9] for determining particle size from thermal inertia
values (TI, expressed in J m−2 s−1/2 K−1 or TIU) measured in dust-free regions of the Isidis basin as determined by both THEMIS and TES infrared measurements. We then calculated thermal conducitivies using
the relation
, where I is thermal inertia, κ is
thermal conductivity in W m−1 K−1, ρ is density (in kg
m−3), and c is specific heat capacity (in J kg−1 K−1), and
assuming the product ρc is equal to 1.0 × 10⁶ [9]. We
then applied their eq. 17 to derive particle size from κ:
where P is pressure in torr, d is the particle diameter in
μm, B ≈ 0.0015 and K ≈ 8.1 × 10⁴. As discussed in
Min. runout
length (m)
3.8 × 10⁸ a
2.23 × 10⁵
b
2000
4.72 × 10⁵
c
0.1
4.45 × 10⁵
-4 d
7.13 × 10
4.24 × 10⁵
b
4
4.01 × 10⁵
e
1.4
4.6 × 10⁵
e
Roche et al. (2013) [7]
Max. value
Max. runout
length (m)
7.75 × 10⁵
4.72 × 10⁵
5.11 × 10⁵
6.06 × 10⁵
6.23 × 10⁵
4.9 × 10⁵
Jakosky et al. [10] and shown in Figure 2, there appear
to be rings of material around the cones with a thermal
inertia about 50 TIU lower than the surrounding plains.
Assuming these represent ejected material from the
cones, they are likely not welded or indurated, and thus
their TI values would be the most accurate in determining the AIi unit particle size. Using these values (TI
between 200-300 TIU), derived particle sizes are between 119 μm and 713 μm, corresponding to model
runout lengths of 606 km and 424 km repsectively.
Discussion and Conclusion: We implemented a 2dimensional box model of a pyroclastic density current
with a single particle size to examine the possibility
that the AIi unit and cones in Isidis Planitia are the
product of a large, devolatilized pyroclastic flow. Our
initial runout length estimates, constrained by local
physical properties and comparison to terrestrial analogues, suggest that a single PDC would be capable of
runout lengths comparable to those observed from
cone distribution (see Figure 1). Based on analysis of
cone chain directions in [3], there may have been at
least three separate events that led to the formation of
the AIi unit, all within close temporal proximity to one
another. Ongoing work in completing this study concentrates on constraining the heat budget available
after the flow has settled, and examining whether the
scale of flow or thermal instabilities during/after the
emplacement of the material correlate with the observed spacing between parallel cone chains.
References: [1] Frey H. et al. (2000) LPS XXXI, Abstract #1748. [2] Bridges J. C. et al. (2003) JGR, 108(E1), 11–1-17 [3] Ghent R. et al. (2012) Icarus, 217, 169–183. [4]
Michalski J. R. and Bleacher J. E. (2013) Nature, 502, 47–
52. [5] Hiesinger et al. (2009) LPS XL Abstract #1953 [6]
Tanaka K. et al. (2005) USGS Scientific Investigations Map
2888. [7] Roche O. et al. (2013) Modelling Volcanic Processes, Cambridge University Press, 203-229. [8] Dellino P.
et al. (2005), Geophys. Res. Lett., 32:21, L21306. [9] Presley
M. A. and Christensen P. R. (1997b) JGR, 102(E3), 65516566. [10] Dobran F. et al. (1994) Nature, 367, 551-554.

© Copyright 2026