
early size distributions of chondrule subgroups - USRA
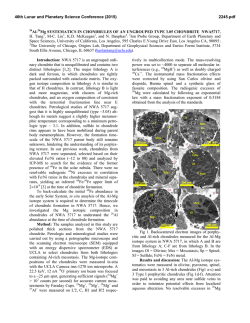
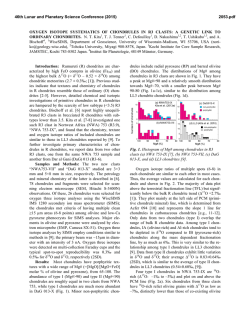
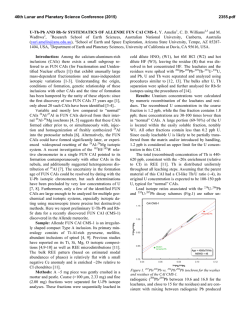
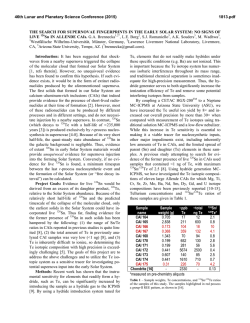
46th Lunar and Planetary Science Conference (2015)
2896.pdf
EARLY SIZE DISTRIBUTIONS OF CHONDRULE SUBGROUPS OVERPRINTED BY THE FINAL
ACCUMULATION PROCESS OF PARTICLE COMPONENTS IN ALLENDE. K. A. McCain 1, J. I. Simon2,
J. N. Cuzzi3. 1The University of Chicago, Chicago, IL 60637, USA ([email protected]); 2Center for Isotope
Cosmochemistry and Geochronology, ARES, EISD-XI3, NASA Johnson Space Center, Houston, TX 77058, USA
([email protected]) 4 NASA Ames, Moffett Field, CA 94035, USA ([email protected]).
Introduction: Populations of compositionally distinct particles are fundamental components of undifferentiated chondritic meteorites [1]. Many theories
explain the formation of chondrites, one class of which
includes mechanisms for sorting the component particles in the solar nebula prior to their accretion. Mechanisms include sorting by mass [2,3], turbulent concentration [4, Cuzzi et al, this meeting], X-winds [5], and
photophoresis [6], which will produce characteristic
distributions of observable properties such as particle
size. Distinguishing processes that occur in specific
astrophysical environments requires characterization of
particle types, which include refractory Ca-Al-rich
Inclusions (CAIs) and less-refractory chondrules.
Previous investigations of modal abundances of
CAIs (e.g., [6,7]) and chondrules (e.g., [3,8]) exist, but
differences within and between these two groups, both
of which are made up of diverse subgroups with different thermal histories and chemical compositions, remain mostly unstudied. The presence of rims, a significant event occurring after the formation of at least
some chondrules, have also yet to be considered with
respect to sorting. Here we present the sizes of CAIs
and chondrules in Allende with attention to the smallest sizes, subgroups, and particle rims.
Samples and Methods: Components of the Allende CV3 carbonaceous chondrite were characterized
using six false-color secondary electron microscope
(SEM) X-ray maps obtained by [9,10], with resolutions
of 2.88-3.34 µm/pixel and a total area of 10.08 cm2. A
sample ~10 cm2 was also taken from a large ~25x20
cm slab photographed and characterized by [11], at a
resolution of 6.94 µm/pixel. Past work [9-11] attempted to combine data from microscopic scale SEM images with data from a distinct 10 cm2 region of the large
slab [10]. Unfortunately, the smallest particles, particle
subclasses, and rims were inconsistently represented or
absent. Here we reevaluated the SEM images to include all particles ≥25 µm and all visible slab particles
≥100 µm. Comparison between larger particle sizes
obtained by [10] and equivalent particles in a similarly
size slab area allow us to examine slab homogeneity.
Classification. A textural and mineralogical classification scheme was used to define subgroups within
the categories of CAI and chondrule and to record rim
details in SEM imagery. Particles were grouped into
the following categories: a) Porphyritic olivine chondrule (PO), b) Porphyritic olivine and pyroxene chon-
drule (POP), c) Porphyritic pyroxene chondrule (PP),
d) Aluminum-rich chondrule, e) Barred olivine chondrule (BO), f) Coarse-grained (CG) chondrule rims, g)
fine-grained (FG) chondrule rims, h) Type A CAI, i)
Type B CAI, and j) Amoeboid olivine aggregate
(AOA). A simpler textural classification scheme was
used for the slab data, sorting particles into CAIs,
chondrules (with and without rims), and rims (both
coarse and fine-grained). These categories correspond
to the broadest categories of the SEM classification
scheme, so measurements from both can be compared
to quantify the distribution of particles over a large
range (~25 µm to 1 cm) [12].
Image Processing. Particle size and shape were
measured using the ImageJ software. Smaller angular
particles that could be particle fragments (e.g., the
smallest PO particles) were included in our assessment
because their removal has little effect on the curvature
of the particle size distributions, as shown by the work
of [9]. The diameter of the inner chondrule “core” and
the diameter including the rim were measured in
rimmed chondrules so that “naked” and “rimmed”
chondrules could be compared.
Data compilation. Each data set was normalized to
an area of 1,000,000,000 µm2 to obtain a common
scale, and major axis values were binned geometrically. Generally, the SEM data set was most effective at
capturing smaller particle sizes and the slab data was
more effective at large particle sizes.
Figure 1. Size distributions of the diameter of chondrules and CAIs in SEM images compared to the narrow range of chondrules reported by those of Paque et
al. Particle types defined under Classification.
46th Lunar and Planetary Science Conference (2015)
Particle Data Sets. Measurements were made for
all of the particle groups described above. Unless stated otherwise each group represents the size of the core
without the added thickness of their rims. From this
analysis we have chosen to focus on eight data sets for
which we could collect enough data to have reasonable
confidence. These include: (1) the maximum chondrule
size (ChonMax) that includes the rim if present, (2) all
CAIs, (3) chondrules (CoreNoRim) with no rims, (4)
chondrule cores (CoreWRim) of chondrules with rims,
(5) PO cores, (6) POP cores, (7) PP cores, and (8)
Type A CAIs.
Unfolding. The integrated 2D data sets were processed using an unfolding algorithm to transform
measurements of major axis into particle volumes.
This matrix inversion algorithm has been tested by [8]
against particle size standard NIST 1019b and against
numerically generated 3D particle populations.
Results: Particle Subgroups. Table 1 summarizes
the 5193 particles identified in the SEM and slab samples. Area percentages are the sum of CAI, ChonMax,
and AOA areas. Particle subgroups vary in average
size, though some subgroups (BO and Al-Rich chondrules, Type B CAIs, and AOAs) have too few sampled particles to assume that these averages are representative. Chondrules with rims represented about 31%
of all chondrules in the slab. Higher CAI abundance in
the slab than SEM data is likely conflation of CAI and
AOA particles in the slab data set. The lower chondrule area in the slab likely stems from greater difficulty identifying small particles and fine-grained rims.
Discussion: Broad size distributions. Figure 1 depicts SEM data from chondrules (ChonMax) and CAIs
and the most abundant subparticle classes (colored).
Slab distributions (not shown) are in general agreement
with the SEM data, though phases required for defining subparticle classes could not be identified. In all
cases, the size distributions of particles are broad and
many particle classes have similar distributions, excepting POP chondrules (abundant at large sizes) and
PO chondrules (abundant at small sizes). Type A CAIs
are the most common and generally control the CAI
distribution, but the largest CAIs are represented primarily by Type B CAIs.
2896.pdf
Cores of Rimmed vs Unrimmed Chondrules. In Table 1, chondrule cores with rims (neglecting the thickness of their rims) are on average 64 µm larger than
unrimmed cores. This may suggest that rims form
preferentially on larger chondrules, but the hypothesis
needs further testing. Preliminary analysis also shows
that rim thicknesses gradually increase from ~0 µm at
core sizes <475 µm to ~340 µm at >1825 µm, shown
qualitatively in Figure 1
Table 1. Modal abundance of particles from SEM and
slab data from a sample area approximately 20cm2
Summary: The similar broad distribution measured between ChonMax, unrimmed core, and CAI distributions suggests that one event or process sorted
CAIs, rimless chondrules, and already-rimmed chondrules similarly prior to their incorporation into the
chondrite parent body. This event would have overprinted previous differences (e.g., PO vs. POP) that
existed between particle types. This also suggests that
the rim-forming event for both coarse and fine-grained
rims (since both are included in the ChonMax designation) occurred before this final sorting event.
References: [1] Scott et al. (1996) Chondrules and
the protoplanetary disk, 87-96. [2] Teitler S. A. et al.
(2010) MPS, 45, 1124-1135. [3] Cuzzi, J. N. et al.
(2001) APJ, 546, 496-508. [4] Hogan R.C. et al. (1999)
Physical Rev. E, 60, 1674-1680. [5] Shu F. H. et al.
(1996) Science, 271, 1545-1552. [6] Wurm G. &
Krauss O. (2006), Icarus, 180, 487-495. [7] Hezel et
al. (2008) MPS, 43, 1879-1824. [8] Dodd R.T. (1976)
EPSL, 30, 281-291. [9] Christoffersen, et al., (2012)
LPSC XLIII. [10] Fisher, et al., (2014) LPSC XLV. [11]
Srinivasan et al. (2013) LPSC XLIV. [12] Chayes
(1954) Textbook. [13] Weibel, E. R. (1980) Stereological Methods; Volume 2: Theoretical Foundations; Academic Press.

© Copyright 2026