
LATE NOACHIAN ICY HIGHLANDS: SPATIAL DISTRIBUTION OF
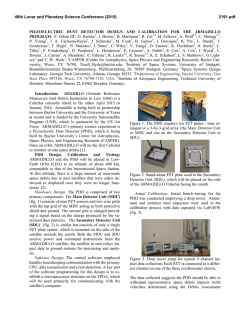
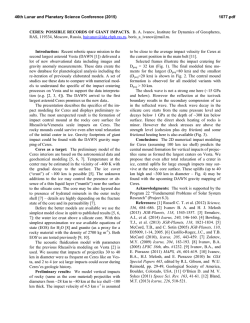
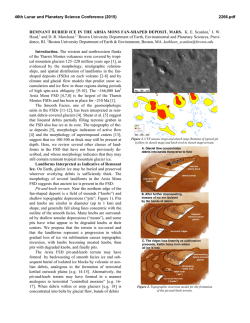
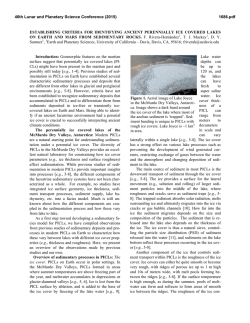
46th Lunar and Planetary Science Conference (2015)
1555.pdf
LATE NOACHIAN ICY HIGHLANDS: SPATIAL DISTRIBUTION OF TOP-DOW N MELTING AND VOLUMES OF M ELTW ATER FOR SINGLE-YEAR W ARMING EVENTS. James L.
Fastook1 and James W. Head2, 1University of Maine, Orono, ME 04469, [email protected], 2Brown University,
Providence, RI 02912.
Introduction: We present here the next level of detail
for the general calculation of top-down melting on supply-limited ice sheets for the Late Noachian Icy Highlands (LNIH) [1], in this case looking specifically at the
spatial distribution of meltwater produced by PositiveDegree-Day melting at the ice sheet surface that results
from a single-year warming. Knowledge as to where this
meltwater is produced in relationship to the existing valley networks (VN) and open-basin lakes (OBL) can provide insight into possible mechanisms for their formation, as well as climatic conditions necessary to produce
the required volumes of water thought to have fed the
VN and OBL.
Reasonable supply limits on the amount of water
available to grow LNIH ice sheets range from 1 to 5
times the present available water [2]. Using a lapse-ratedominated climate with an ice-stability elevation predicted by GCM results for a denser Martian atmosphere
[3], ice sheets are cold-based [4] and incapable of producing the large volumes of liquid water necessary to
form VN or OBL, features and deposits known to have
existed in this region. We investigate how such water
might be released by surface melting during short-lived
climatic warmings due to large meteor impacts (e.g., [5])
or periods of intense volcanism (e.g., [6]). For the minimum estimate of the magnitude of meltwater required,
we assume that all the OBLs were filled simultaneously,
and adopt as our target the total volume of all of the
filled OBLs measured by [7], ~0.42 Mkm3, a value less
than 10% of the current (1X) surface/near-surface ice
volume [2].
Results: With our relatively simple climate parameterization, short-lived warmings are handled by shifting
the base temperature, which produces a uniform shift of
the global temperature field. Simultaneously, the mass
balance as a function of elevation is adjusted by a combination of a specified lapse rate (2.4 K/km) and a posi-
tive-degree-day factor [8.9] of 1.05 mm/PDD.
Here we investigate the distribution and amount of
melting one might obtain from a single-year melting
event, using our target value of 0.42 Mkm3 to assess
plausible scenarios. Extracting and calculating temperature from our climate parameterization for all points that
are ice covered for our 1X, 2X, and 5X ice sheet simulations, we impose various degrees of warming by offsetting the base temperature in the climate parameterization. We impose a seasonal swing of 40 K (+/-20),
analogous to that observed in the McMurdo Dry Valleys,
where the mean annual temperature is 253 K and where
seasonal melting is known to occur [10-11]. Applying
this seasonal cycle we count PDDs and compute a melting for each point for various PDD factors ranging from
high albedo snow (1.05 mm/PDD) to low albedo ice
(2.55 mm/PDD) [9]. Summing these over the area of our
simulated ice sheets we obtain potential mass losses for a
single year with warmer temperatures for various warmings and PDD factors.
Figure 1 shows volume losses for our three supplylimited ice sheets as a function of warming. Also shown
is the target volume of 0.42 Mkm3 [7], representing the
total volume of all open-basin lakes. Clearly, with a
snow surface (PDD factor of 1.05 mm/PDD, the bottom
solid line in each figure) it is difficult to obtain our target
volume for any of the simulated ice sheets. The 2X ice
sheet reaches the target, but only PDD factors typical of
an ice surface, and even with that, it requires unreasonably large warmings (36, 38, and 41 C for PDD factors of
2.55, 2.25, and 1.95 mm/PDD respectively). For the 5X
ice sheet, an ice surface PDD factor of 2.55 mm/PDD
obtains the target volume loss with the least warming, 31
K, yielding an average temperature for the ice sheet surface close to the melting point. These results are summarized in Table 1, which also includes the average melt,
temperature over the ice sheet, and number of PDDs, as
Figure 1: Showing volume loss during a single-year warming event for the 1X, 2X and 5X supply-limited model ice sheets for various
PDD factors ranging from 1.05 mm/PDD (snow) to 2.55 mm/PDD (ice) as a function of the warming. Also shown is the target volume
of the OBL, 0.42 Mkm3.
46th Lunar and Planetary Science Conference (2015)
1555.pdf
Conclusions: Scenarios for a single year of warming of the LNIH glacial scenario are sufficient in some
cases (e.g., the dusty ice scenario) to produce a volume
of meltwater comparable to our minimum estimate of the
total volume of all open-basin lakes. Water melted on
the surface of the ice sheet will in general flow down local surface slopes to the nearest margin. While our
treatment does not at this point allow us to predict the
exact flux delivered to the ice sheet margin, one would
expect from Figure 2 that the largest delivery would be
along the yellow margin, where surface melting is in the
14-17 m range. Figure 2 also includes all of the OBL
Table 1: Summarizing the scenarios from Figure 1 that achieve the
cataloged by [7] (green stars). There are major clusters
target volume for various warmings and PDD factors.
of lakes just outside the margin (e.g. the clusters near
well as the area of the ice sheet and the volume lost.
grid (4000,-4000), (7000,0), (4500,1000), and several
Figure 2 shows the distribution of mass loss for the
others. Lakes are very rare within the boundaries of the
scenario that achieves the target volume with the least
ice sheet (only two near grid (5000,3000), two more near
required warming, the 5X ice sheet with a PDD factor of (3200,-3200), and one near (5250,-750); the rest inside
2.55 mm/PDD, typical of a low albedo ice surface. It is
the ice sheet are within ~100 km of a margin).
worth noting that the presence of dark impurities in the
We conclude that the LNIH glacial scenario proice could reduce the albedo further, resulting in larger
vides a huge reservoir of potential meltwater, and that
PDD factors [12-14], resulting in larger melt amounts for this meltwater would be delivered in locations that could
less warming. However, too much debris on the surface
account for many of the observed valley networks and
can have the opposite effect of armoring the surface and open-basin lakes under several plausible top-down meltlowering melt rates [15]. Where [6] suggests a warming
ing scenarios. In general, episodes of punctuated heating
of 26 C due to volcanic activity, we might ask what PDD and melting of the LNIH ice sheet, cycled through the
factor is necessary to achieve our target volume in a sin- valley network system over extended periods, could
gle year, and whether these values are reasonable. The
readily account for their formation. Not yet determined
1X supply requires a PDD factor of 7.0, 2X requires
is the detailed mechanism of top-down heating and melt5.38, and 5x requires 3.85 mm/PDD. Of these, only the
ing, the predicted regional valley network patterns and
5X case is possible given our assumption of a 25% reassociated landforms, and their comparison to the obduction in the solar intensity during the Noachian, and
served valley-network distribution and patterns. These
even this requires a low but not unreasonable albedo less preliminary comparisons of the distribution of open bathan 0.2 [16].
sin lakes with the LNIH supply-limited ice sheets show a
close correlation [11], but more detailed studies are required to compare the nature of valley networks with the
predictions of “warm and wet” and “cold and icy” climate models.”
References:
[1] Fastook and Head, 2015, this symposium. [2] Carr and
Head (2014) LPSC 45 #1427. [3] Wordsworth et al. (2013)
Icarus, 222,1. [4] Fastook and Head (2014) PSS In Press. [5]
Toon et al. (2010) Annu. Rev. Earth Planet. Sci. 38, 303. [6]
Halevy and Head (2014) Nat. Geosci. 7, 865. [7] Fassett and
Head (2008) Icarus 198, 37. [8] Huybrechts et al. (1991) Paleogeogr. Paleoclimatol. Paleoecol. 89(4), 399. [9] Braithwaite
(1995) J. Glaciol 41(137), 153. [10] Marchant and Head(2007)
Icarus 192(1), 187. [11] Head and Marchant (2014) Antarc.
Sci. 26(6), 774. [12] Alley (2007) Science, 317(5843), 1333.
[13] McConnell et al. (2007) Science, 317(5843), 1381. [14]
Ramanathan and Carmichael (2008) Nat. Geosci. 1, 221. [15]
Wilson and Head (2009) J. Volcanol. Geother. Res. 185, 290.
[16] Bell et al. (2008) JGR 113, E06S18.
Figure 2: Showing the distribution of surface melt across the 5X ice
sheet in mm/Martian year. The South Pole is at grid coordinate 0,0.


© Copyright 2026