
Non-Obvious Secondary Crater Detection on the Moon
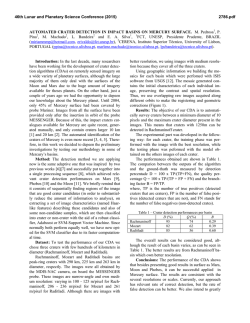
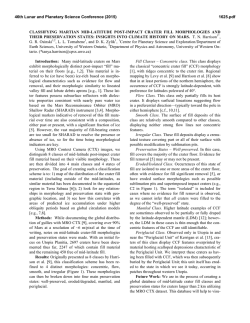
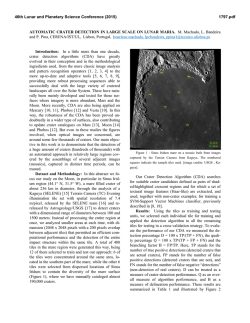
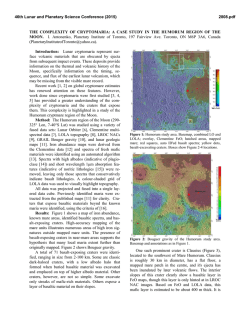
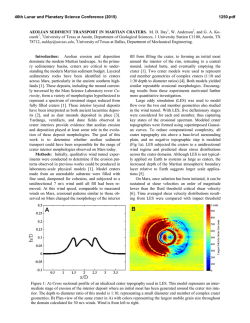
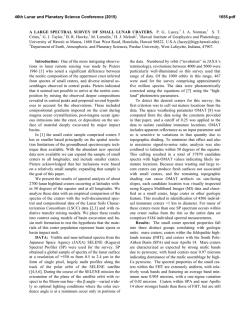
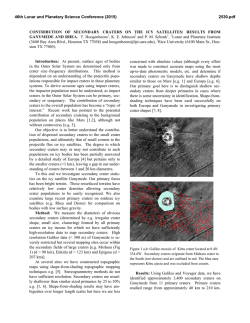
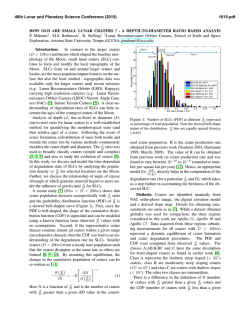
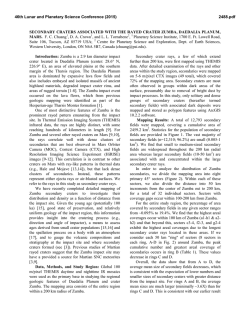
46th Lunar and Planetary Science Conference (2015)
1082.pdf
NON-OBVIOUS SECONDARY CRATER DETECTION ON THE MOON. L. R. Ostrach1, K. N. Singer2, and
M. S. Robinson3, 1NASA Goddard Space Flight Center, Greenbelt, MD; 2Southwest Research Institute, Boulder,
CO; 3School of Earth and Space Exploration, Arizona State University, Tempe, AZ. ([email protected])
Introduction: Identifying secondary craters (and
removing the area containing them) within a region
used to measure crater size-frequency distributions
(SFDs) is critical for appropriate age determination
(relative and absolute). Recent investigations [1,2]
indicate that secondaries do not always display typical
features (e.g., chains, overlapping clusters), suggesting
that “non-obvious” secondaries dominate SFDs at diameters ≤1 km [3], particularly in the mare. Here, we
build upon a previous analysis of the density of impact
craters in Mare Imbrium [4] to investigate clusters of
circular, non-overlapping impact craters that are candidate far-flung, non-obvious secondaries.
Methods: Crater SFDs for all circular, nonoverlapping impact craters with diameters D ≥500 m
were measured on LROC WAC 100 m/pixel mosaics
for a region encompassing 2.27×10⁵ km2 within Mare
Imbrium. Crater density was determined from a point
density calculation according to the methodology of
Ostrach and Robinson [4]. Varying neighborhood radius alters the spatial structure observed in the density
map; small neighborhoods emphasize local, statistical
variations. Therefore, systematic local trends in groupings of craters, which are expected for clusters of nonobvious far-flung secondaries, will be visible. Locations with candidate non-obvious secondaries identified in the crater density map were then investigated
through morphology, and potential source craters were
predicted by expected secondary crater size distribution relative to the parent crater. Estimates of the maximum secondary size at a given range from a primary
were derived from the power-law quantile regression
fitting of measured secondary crater fields [5].
Results: The density map [Fig. 1] suggests locations for candidate non-obvious secondaries. Measurements of the crater diameters within the clusters
identified in the density map interpreted to be secondaries range from 500 m to ~2 km. Some clusters of
craters are within a higher albedo region (ejecta ray)
than the surrounding terrain and can be traced back to
a probable parent primary [i.e., Copernicus], consistent
with origin as a secondary impact. For other clusters of
craters, size-range distributions estimate the maximum
secondary size at a given distance from a primary [Fig.
2; 5]; several parent craters likely contribute to the
expansive rays and secondary crater chains observed,
including Copernicus, Aristillus, Autolycus, Aristarchus, and in one case, Aristoteles [Fig. 3].
Discussion: What is the effect of including these
far-flung secondaries in crater SFDs? Obvious secondary craters, those that display typical features, are recognized and excluded from measurements, along with
the surface area they cover. However, clusters of circular, non-overlapping craters are not as easily identified
as secondary in nature. The inclusion of these craters
has the potential not only to contaminate the SFDs but
also to over-predict the small primary crater production
function. Secondary contamination was considered for
the lunar chronology, with an estimated <10% uncertainty for the standard distribution curve between 0.8–
3 km [6,7]. However, recent reassessment [8] indicates
that earlier investigations suffered from images with
non-uniform illumination conditions as well as the
effects of lower resolution on crater identification.
Typically, absolute ages for the mare are determined
from craters with D ≥1 km to limit inclusion of potential secondaries [e.g., 3,6-9], and although the presence
of non-obvious secondaries with D ≥1 km is estimated
to constitute <5% of craters of comparable size [e.g.,
10], high-resolution image data enable new, quantitative assessments of lunar secondary populations.
Conclusions and Future Work: Candidate clusters of non-obvious secondary craters (500 m to ~2 km
in diameter) were identified in Mare Imbrium through
measures of crater density. Observations of morphology and size-range distribution estimates indicate that
several parent craters likely contribute to these clusters
of craters in Mare Imbrium. Additional observations of
morphology in LROC NAC images are required to
determine whether the clustered craters have similar
degradation states (similar ages), because it is possible
that the clusters are comprised of craters of different
ages (superposed younger primaries or secondaries).
Nonetheless, measures of areal density aid in the identification and determination of clustered non-obvious
secondaries, and it is probable that at least some portion of the clustered non-overlapping craters in Mare
Imbrium represent far-flung, non-obvious secondaries,
similar to those observed at Tycho [2] and Zunil [on
Mars; 1].
Candidate clusters of non-obvious secondaries can
be identified in crater density maps and their probable
parent primary determined from secondary crater size
distributions. These techniques provide improvements
in identification of secondary craters, particularly previously unrecognized clustered non-obvious secondaries, and enable quantitative assessment of the secondary population on the Moon.
46th Lunar and Planetary Science Conference (2015)
1082.pdf
References: [1] McEwen, A.S. et al. (2005) Icarus 176, 351–381.
[2] Dundas, C.M. and McEwen, A.S. (2007) Icarus 186, 31–40. [3]
McEwen, A.S. and Bierhaus, E.B. (2006) Ann. Rev. Earth Planet.
Sci. 34, 535–567. [4] Ostrach, L.R. and Robinson, M.S. (2014) Lunar Planet. Sci. Conf. 45, abstract 1266. [5] Singer, K.N. et al. (2014)
Lunar Planet. Sci. Conf. 45, abstract 1162. [6] Neukum, G. et al.
(1975) The Moon 12, 201–229. [7] Neukum, G. et al. (2001) Space
Sci. Rev. 96, 55–86. [8] Robbins, S.J. (2014) EPSL, 403, 188–198.
[9] Hartmann, W.K. et al. (1981) In: BVTP, 1049–1127. [10] Werner, S.C. et al. (2009) Icarus, 200, 406–417.
Fig. 1. Density of impact craters
for craters with D ≥500 m (2.27
× 105 km2 measurement area);
output cell size is 1 km and
neighborhood radius is 10 km.
This region is centered on and
encompasses a distinct multispectral boundary between Imbrian-aged and Eratosthenianaged basalts; this boundary is
observed in measures of crater
density derived from larger
neighborhood sizes [5]. Here, a
small neighborhood size emphasizes local clustering trends that
may reflect non-obvious secondaries contaminating the crater
measurements. Boxes surround
three locations of candidate nonobvious secondaries. Density
map overlaid on LROC WAC
mosaic centered at 45.0°N,
340.0°E in Mare Imbrium.
Fig. 2. Predicted secondary crater diameter (color) as a
function of both primary crater diameter and distance
(Range) from the parent primary. Red ellipses centered on
primary D (Aristillus, Aristoteles, and Copernicus) and
distance from crater center to the center of the study region (33.0°N, 345.0°E), extending ±200 km from the
region center point. Differences between this estimate and
the size-range distributions [Fig. 3] reflect differences
between individual craters and the generalized regression
fits [5].
Fig. 3. Secondary size-range distributions estimate the maximum secondary crater size at 100 km radial interval ranges from Aristillus (Ar;
cyan), Aristoteles (A; red), and Copernicus (C; yellow). Shaded boxes
are the three regions in the figures at the upper right. Derived from
quantile regression fits to secondary crater field measurements [5].
© Copyright 2026