
An Open Source Alternative for Crater Counting Using QGIS and the
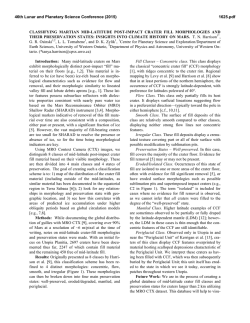
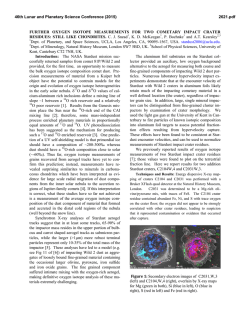
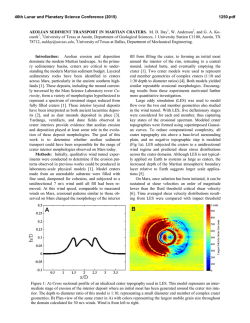
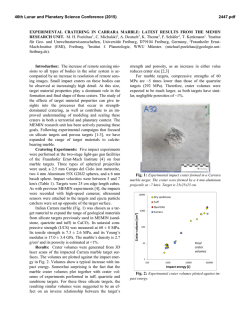
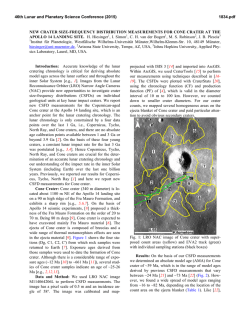
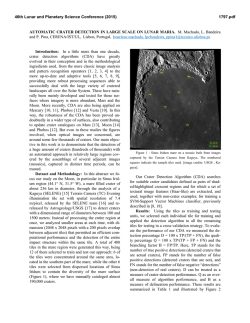
46th Lunar and Planetary Science Conference (2015)
1816.pdf
AN OPEN SOURCE ALTERNATIVE FOR CRATER COUNTING USING QGIS AND THE CIRCLECRATERS PLUGIN. S. E. Braden1, 1HireIQ Solutions, Inc., 1101 Cambridge Square, Alpharetta, GA 30009,
[email protected].
Introduction: Statistical analysis of crater size
frequency distributions (CSFDs) from impact craters
on planetary surfaces is a method to derive ages on the
basis of remotely-sensed image data [1-5]. Data required for the statistical analysis are area size and
mapped geologic units, as well as measurements of primary impact crater diameters within the study area.
Data collection techniques have changed over time.
Initially, photogrammetric instruments were used to
measure image coordinates on film transparencies, and
then the coordinates were translated into crater diameters. More recently, measurements of impact crater diameters were made from projected raster images
through measurements of pixels.
Geographic Information Systems (GIS) provided
an environment for both the projected image data
(raster data) and the measurements of digitized craters
(vector data), however, a challenge remained for accu rate crater diameter measurements. Distortions of distances and areas due to different map projections was
still a significant source of error when making measurements from projected raster data [6]. In general,
distortions produced by different map projections increase with distance from the projection center. The
CraterTools extension for Environmental Systems Research Institute's (ESRI's) ArcGIS addressed this issue
by preforming undistorted re-projection of each digitized impact crater and using the undistorted crater diameter as the true measurement output [6].
At present, the only crater counting tool utilizing a
Geographic Information System (GIS) is CraterTools
[6]. There is not an open source alternative to the combination of ArcGIS and CraterTools.
This abstract presents a new open source tool, CircleCraters, for crater counting built as a QGIS plugin.
QGIS is an Open Source Geographic Information System (GIS) licensed under the GNU General Public License [7]. QGIS is an official project of the Open
Source Geospatial Foundation (OSGeo). It runs on
Linux, Unix, Mac OSX, Windows and Android. In
contrast, ArcGIS limits the user by requiring a Windows operating system.
The advantages to using a combination of QGIS
and a community developed open source plugin for
crater counting are not only lower cost compared to using ArcGIS, but also the ability of independent individuals to make improvements to the code and long-term
maintainability with transparent version control. Open
source code is essential to the scientific process, not
only to support the reproducibility of results, but to
contribute to the scientific community and develop
methodologies over time [8].
Measurement Tool: CircleCraters uses the same
three point crater digitizing method as ArcGIS CraterTools. The method assumes that impact craters have a
near circular shape, which excludes oblique impact
craters. Errors in diameter measurements due to projection related distortions are avoided by using spherical coordinates to create a circle through the three
points defining the crater rim, and then using the
haversine formula (Fig. 1) to calculate the diameter of
the circle. When solved for distance, the haversine formula finds the shortest distance between two points
given in latitude and longitude [9]. The haversine formula is accurate even for craters that cover a large portion of the planetary surface. The final undistorted diameter is saved as a property of the group of three
Figure 1. The haversine formula solved for distance
where d is the distance in meters, r is the radius of the
planetary body in meters, phi is latitude and lambda is
longitude for two points.
points selected by the user, along with the latitude and
longitude of the center of the circle. On the screen a
circle is drawn in the same projection as the raster data
(Fig. 2).
When all study areas are mapped and the crater
counting process is complete, data can be exported as a
comma delimited file (.csv), shapefile (.shp), or as a
crater-diameter list with a defined surface area (a .diam
file) designed to be imported by Craterstats2, a tool for
plotting crater counts and determining surface ages using the techniques described in [2-5, 10]. Craterstats2
requires the area containing the impact craters, which
is calculated automatically by CircleCraters as long as
the user has defined the area in a vector layer. The area
is computed with an equal-area sinusoidal projection.
In a sinusoidal projection, scales are true along paral lels and along the central meridian, while being distorted in directors not along the parallels.
Source Code: The code and documentation for
CricleCraters is on the GitHub website at
github.com/sbraden/circle-craters. Github is a public
source code repository for code hosting, sharing, and
46th Lunar and Planetary Science Conference (2015)
collaboration using the version control system Git.
Contributions to the code base of CircleCraters, or any
comments, suggests, or other input are welcome from
the planetary science community. Github provides an
easy-to-use platform for documentation and feedback.
CircleCraters will be included in the QGIS plugin
repository (plugins.qgis.org), which allows the plugin
to be installed with one click from within the QGIS
desktop application. The plugin is written in Python, a
relatively easily-adopted programming language. CircleCraters is made available under the BSD (Berkeley
Software Distribution) 3-Clause (“BSD Simplified”) license [11].
Conclusion and Future Work: This open source
tool provides planetary scientists with an alternative to
the ArcGIS platform. The hosting of the code in a
GitHub repository will promote long-term maintainability and transparency. Other scientists requiring
crater counting software tools may use the source code
from this repository. CircleCraters will evolve together
with new QGIS releases and improvements.
Figure 2. An example of impact crater definition as a
circle automatically generated after the user defines
three points along the crater rim. The image data is a
raster layer while the group of three points and circle
are vector layers. The crater center latitude, longitude
and diameter are stored as feature properties for later
export and use in Craterstats2.
1816.pdf
Immediate development priorities include:
•
A crater size frequency distribution preview
plot with isochrons, similar to what is available in CraterTools.
• Exporting crater counting data as a binned
.stats file readable by Craterstats2 [10].
• An option to use more than three points to define the crater rim.
• Option for users to label craters within the
crater counting vector layer as uncertain when
considering possible secondary craters.
• A measurement scale/guide that includes a default minimum crater diameter spatial resolution limitation based on number of pixels.
References: [1] Crater Analysis TechniquesWorking Group (1979) Icarus, 37 (2), 467-474. [2] Neukum,
G. (1971) PhD thesis, Heidelberg. [3] Hartmann W. K.
and Neukum G. (2001) Space Science Reviews, 96,
165-194. [4] Ivanov B. A. (2001) Space Science Reviews, 96, 87-104. [5] Michael, G. G. and Neukum, G.
(2010)
Earth Planet. Sci. Lett. 294, 223-229. [6]
Kneissl T. et al. (2011) Planetary and Space Science,
59, 1243-1254. [7] The GNU GPL Licenses.
http://www.gnu.org/licenses. [8] Prlić A. and Procter J.
B. (2012) Plos Comput Biol, 8(12). [9] Gellert W. et al.
The VNR Concise Encyclopedia of Mathematics, 2nd
ed., ch. 12 (Van Nostrand Reinhold: New York, 1989).
[10] Software Tools, Craterstats. http://hrscview.fuberlin.de/craterstats.html. [11] The BSD 3-Clause License. http://opensource.org/licenses/BSD-3-Clause.
© Copyright 2026