
preliminary numerical modeling of brine formation on mars during
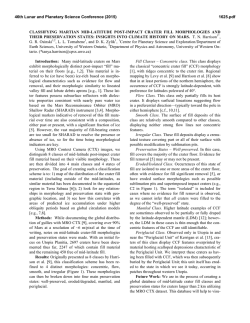
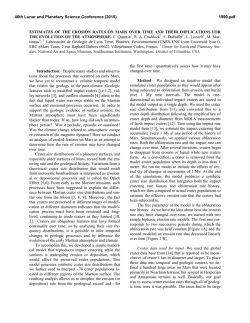
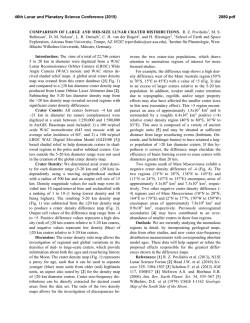
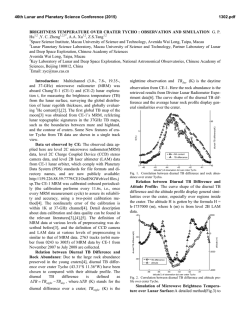
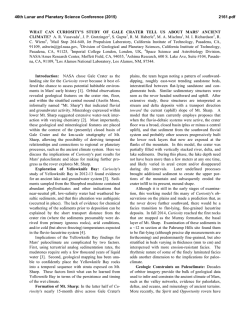
46th Lunar and Planetary Science Conference (2015)
2998.pdf
PRELIMINARY NUMERICAL MODELING OF BRINE FORMATION ON MARS DURING IMPACTDRIVEN HYDROTHERMAL CIRCULATION: THE CHESAPEAKE BAY ANALOG. Pavithra Sekhar1 and
Robert. P. Lowell2, Virginia Polytechnic Institute and State University (Department of Geosciences, 4044 Derring
Hall (0420), Blacksburg, VA 24061; [email protected], [email protected]).
perature and salinity of fluid entering or leaving the
upper boundary. The bottom boundary is impermeable
and maintained at constant temperature. The left and
right hand boundaries are insulated and impermeable.
Figure 1: Model setup in FISHES
The system is divided into three sections for modeling purpose. The left section (zone 1) contains the
base of the crater at a depth of 2 km and width of 20
km with a temperature gradient of 295oC/km. Beneath
the crater; we assume that the gradient decreases by
100oC/km. The middle section (zone 2) of the system
contains the 5 km wide rim of the crater. In this zone,
there is a linear increase in temperature horizontally
and vertically. The right section (zone 3) contains the
colder part of the system, where the geothermal gradient of the system is 20oC/km. We assume the system
has a uniform permeability of 10-16 m2 (Figure 1).
Results: To investigate phase separation and the
formation of brine in this system, we simulated hydrothermal circulation for 500 years.
Pressure (bars)
Temperature (C)
Salinity (wt% NaCl)
600
600
500
400
3000
mbsf
300
2000
500
3000
400
mbsf
2000
4000
4000
300
200
5000
5000
200
100
6000
6000
1
2
3
distance (m)
1
4
x 104
2
3
4
distance (m)
x 104
100
1000
3.4
3000
3.2
4000
6000
600
1000
2000
500
2000
3000
300
400
mbsf
3000
5000
300
5000
200
5000
6000
100
6000
100
6000
1
2
3
distance (m)
4
x 104
3000
4000
200
1
2
3
4
x 104
distance (m)
12
8
mbsf
400
4000
2
3
4
distance (m)
x 104
16
1000
500
2000
2.8
1
Salinity (wt% NaCl)
600
1000
3
5000
Pressure (bars)
Temperature (C)
3.6
2000
mbsf
1000
1000
mbsf
Introduction: Even though there is little water
vapor present in the Martian atmosphere [1] and liquid
water is unstable on the Martian surface [2], there is
abundant evidence that liquid water was present at the
surface earlier in the planet’s history. There is also
evidence of recent groundwater seepage [3], and it is
widely accepted that water is stored beneath the Martian surface either as solid-state ice [4], as clathrates
[5,6] or in liquid form [7]. If liquid water exists below
the Martian surface, it likely occurs as a thermodynamically stable saline brine [8]. The formation of
brines on Mars has been related to evaporative processes from the Martian surface [8]. But brines can also
be formed during boiling and phase separation of a
saline fluid as a result of high-temperature magmadriven hydrothermal circulation [9], during convection
and near surface freezing of saline groundwater [10],
and during impact-driven hydrothermal flow. To explore the possibility of brine formation and storage on
Mars, we construct a 2-D numerical model of twophase flow in a NaCl-H2O hydrothermal system driven
by an impact event. This is the first attempt to model
two-phase flow and brine formation in an impactdriven hydrothermal system using a NaCl-H2O fluid.
Modeling: In order to constrain the numerical
model for brine formation during an impact-driven
Martian hydrothermal system, we model two-phase
NaCl-H2O hydrothermal circulation associated with
the Chesapeake Bay impact event [11] using the numerical simulator FISHES [12,13]. FISHES uses the
finite volume method [14] to solve the equations that
describe conservation of mass, momentum, and energy
in a NaCl-H2O system [15] and the equation that describes conservation of salt [16]. This code has been
previously used to model phase separation in hydrothermal systems at mid-ocean ridges [17,18]. The
model geometry shown in Figure 1 depicts a 6 km
deep by 40 km wide system similar to that of [11] consisting of square cells of 500 m size in the x-axis and
y-axis. This model geometry represents one half of the
impact crater along with its rim. We assume the whole
crater to be 40 km wide and 2 km deep with a rim of 5
km. The surface is assumed to be overlain by a 1 km
thick layer of seawater, so the surface pressure and
temperature are held constant at 10 MPa and 10oC,
respectively. The constant pressure upper boundary
permits free fluid exchange. Consequently we apply
upstream weighting boundary condition on the tem-
4000
4
1
2
distance (m)
3
4
x 104
Figure 2: Temperature, pressure and salinity at 1 yr
(top) and 500 yr (bottom) of simulation time for the
geometry in Figure 1.
46th Lunar and Planetary Science Conference (2015)
Figure 2 shows the temperature, pressure and salinity distribution after the initial step (1 year) and final
step (500 years) of the model. The temperature distribution has changed relatively little during 500 years of
the simulation. In addition, the pressure distribution
shows a low pressure in zone 1 that results from the
high temperature and formation of low-density vapor
beneath the crater. The salinity plot (top right) shows
the development of a two-phase system where brine
and vapor is formed at the crater boundary and beneath
the crater. As the model evolves (bottom image), the
brine layer formed near the bottom of the crater has
increased in salinity and low-density vapor occurs both
beneath and above the brine. In addition brine formed
near the edge of the crater tends to sink and grow laterally at depth.
The isotherm distribution and velocity vectors in
zones 1 and 2 were analyzed. The velocity vectors
show convection driven by the large lateral temperature gradient associated with the crater rim. The velocity plot also shows brine sinking and vapor rising beneath the crater. The rising vapor transports heat upward beneath the crater while thermal conduction and
brine formation tend to transport heat downward.
These interactions tend to maintain the thermal regime
in quasi-steady state and modulate the salinity within
the brine layer.
Discussion: These preliminary model simulations
show clear evidence of phase separation and two-phase
flow. The results show that a
several hundred meter thick
brine layer forms beneath the
crater
whose
salinity
increases
with
time.
Increasing the permeability
to 10-15 m2 (Figure 3) results
in a more vigorous convection system so that the
convection in zone 2 move
Figure 3:High perfurther beneath the crater. A
meability model at
plume of vapor rises toward
100 years
the surface near the right
boundary of the crater. The vapor above the brine
layer is more pronounced and the sinking of brine in
the region of vigorous convection near the edge of the
crater is more rapid. The results in Figure 3 at 100
years, compared to the results in Figure 2 at 500 years
indicates that increasing the permeability strongly affects brine formation and the dynamics of the convection system.
Conclusion: These preliminary simulations have
run for a relatively short time. They do not show the
expected cooling with time, in part because of the low
permeability assumed and also because of the interac-
2998.pdf
tions between rising vapor and sinking brine beneath
the crater. Previous modeling of two-phase hydrothermal circulation in Chesapeake Bay Crater used pure
water [11]; and it took 100000 years for the system to
reach near hydrostatic pressures. Therefore, our models represent an early stage of evolution. The models
do show the formation of a significant brine layer,
suggesting that the brines observed beneath the Chesapeake Bay Crater could have been produced by twophase flow of seawater during impact-driven hydrothermal circulation. Similar processes of brine formation could have also occurred on Mars. Further modeling that covers a broader range of parameter space and
runs for longer times are needed to explore the evolution and ultimate fate of brines formed during impactdriven hydrothermal circulation. Higher resolution
modeling would also provide a clearer picture of brine
evolution in the system.
References:
[1] Baker (2001) Nature, 412, 228-236. [2] Jakosky
and Phillips (2001) Nature, 412, 237-244. [3] Malin
and Edgett (2000) Science, 288, 2330-2335. [4] Plaut
et al (2007) Science, 316. [5] Max and Clifford (2000)
JGR, 105, 4165-4171. [6] Max and Clifford (2001)
GRL, 28, 1787-1790. [7] Haberle et al (2001) JGR,
106, 23,317-23,326. [8] Knauth and Burt (2002) Icarus
158, 267-271. [9] Bischoff and Pitzer (1989), American Journal of Science, 289, 217-248. [10] Travis et al
(2013) JGR 118, 877-890 [11] Sanford (2005) Geofluids 5, 185–201. [12] Lewis and Lowell (2009a) JGR,
114, B05202. [13] Lewis and Lowell (2009b) JGR,
114, B08204. [14] Patankar (1980) 197, Taylor and
Francis, London. [15] Faust and Mercer (1979) Water
Resour. Res., 15, 23–30. [16] Bai et al. (2003) GRL,
30(3), 1108. [17] Han et al (2013) JGR, 118, 2635–
2647. [18] Singh et al (2013) Geochem, Geophy, Geosys. 14, 4021-4034.
© Copyright 2026