
2789
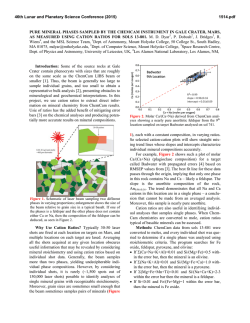
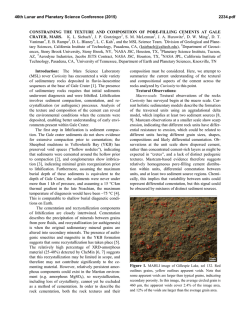
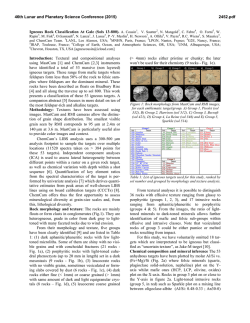
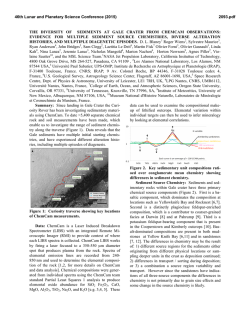
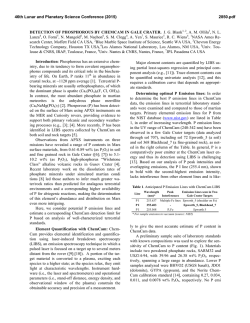
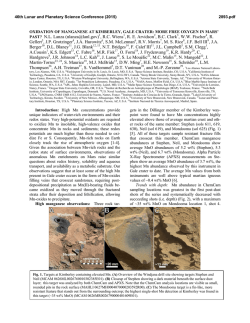
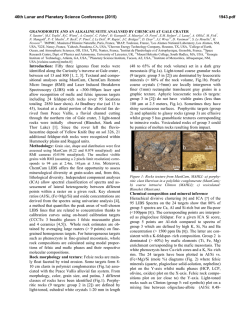
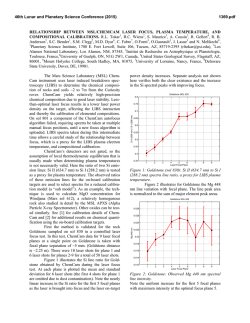
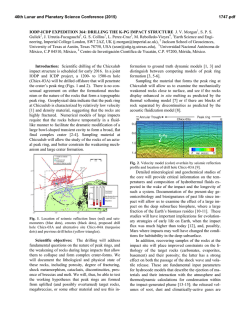
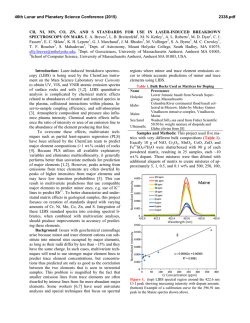
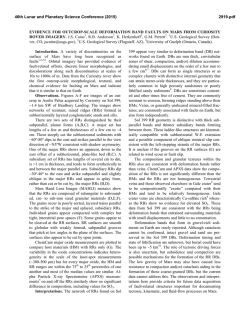
46th Lunar and Planetary Science Conference (2015)
2789.pdf
UPDATED PERSPECTIVE ON CHEMCAM DATA THROUGH CLUSTERING. O. Gasnault1, O. Forni1,
N Mangold2, R. Wiens3, P.-Y. Meslin1, J. Lasue1, P. Pinet1, S. Maurice1, E. Lewin4, R. Anderson5, B. Clark6,
N. Melikechi7, H. Newsom8, V. Sautter9, and J. Blank10, 1IRAP (Univ. Toulouse, France - [email protected]),
2
LPG-Nantes, France, 3LANL, Los Alamos, US, 4ISTerre, Grenoble, France, 5USGS, Flagstaff, USA, 6PSI, Tucson,
USA, 7DSU, Dover, USA, 8UNM, Albuquerque, USA, 9IMPMC, Paris, France, 10BAERI, Sonoma, USA.
Introduction:
Curiosity encountered diverse
rocks by their textures and compositions, along its
traverse inside Gale Crater (Mars), including fluviolacustrine deposits [1], conglomerates supporting multiple sources for the sediments [2], and more recently
evidences for chemical weathering [3].
Here we update the clustering analysis of ChemCam data [4, 5] in support of a more comprehensive
classification of Curiosity targets [6].
ChemCam uses Laser-Induced Breakdown Spectroscopy (LIBS) to sample remotely the elemental
composition of targets up to a few meters. ChemCam
is sensitive to most major elements and some minor/trace elements [7, 8]. The submillimeter scale of
the sampling gives access to the composition of crystals, grains, sediments, and cements.
We define 6 groups of relative uniform composition and distinct from each other, with observations up
to Sol 586. We also project the most recent data (Sols
600-801) into these 6 groups to demonstrate the ability
to classify new targets based on their chemistry.
Method: The approach is based on a hierarchical
divisive clustering of scores produced by an Independent Component Analysis (ICA) of the spectra, which
are normalized to their total intensity. The spectra are
averages of 25 laser shots or more (the first 5 of each
burst are excluded because of dust). The quantitative
abundances are given by Partial Least Square processing (PLS1) [9]. The following 9 chemical elements
are included in the analysis (Si, Ti, Al, Fe, Mg, Ca, Na,
K, and H). Outliers characterized by high abundances
in other elements are generally processed separately.
Summary of results up to Sol 600: This reference dataset includes 3358 measurements. To first
order, the analysis distinguishes more mafic from more
felsic compositions (Fig. 1), with a clear enrichment in
Mg, Fe, Ti on one side and in Si, Al, Na on the other
side, which is a characteristic of this landing site [10].
Among all the ChemCam measurement points,
84% show a “classical” martian mafic composition,
which was found all along the traverse in both rocks
and soils (the latter being characterized by a higher H
signal, from a spectrum point of view, e.g.
Sandy_Dam on Sol 544). Most of these rocks were
found in the Sheepbed unit (e.g. CumberlandNew_RP,
Sol 277), but similar compositions are found in all
stratigraphic units and in float rocks. This group is
characterized by relatively high abundances of Fe and
Ti, typically FeOT abundances between 17.1 and 19.6
wt. %, and TiO2 abundances between 0.9 and 1.3 wt.
%. This is also the only group showing a strong anticorrelation between Fe and Mg, and some between Fe
and H. This is a large group and these trends may have
various causes (orthopyroxene solid solution, mixing
with iron oxides, such as magnetite and hematite, or
alteration in these layers).
Calcium-sulfate veins and nodules identified by
ChemCam in the Sheepbed unit (Sols 125-300) define
a small but well-defined group in the mafic branch
(denoted by a mixing line between mafic and calciumsulfate end-members, which results from traces of the
host rocks or variations in the vein compositions [11]).
This group has the highest calcium abundances, typically between 29.3 and 51.4 wt. % CaO (e.g. Tukarak,
Sol 165).
While we found a few felsic samples everywhere
along the traverse, there were very few in the Sheepbed unit, and we found most of them just after landing
(Bradbury area), during the traverse to Darwin waypoint (Sols 350-400), and around the Dingo Gap bifurcation (Sols 500-550). This group also can be subdivided with a group rather enriched in Ca, suggesting
plagioclase minerals, while the remaining points are
enriched in K, suggesting K-feldspars.
These intermediate-Ca materials (pebbles and float
rocks, median abundance at 5.9 wt. % CaO) were
found mostly after Sol 300 and could correspond to
white feldspar crystals with Ca-rich cores [12] for the
igneous materials (e.g. Harrison and Sparkle, Sol 514).
The K-rich materials were mainly found in bedrocks and float rocks between Shaler and Darwin areas
(around Sols 300-400, e.g. Angmaat, Sol 337, with up
to 4.8 wt. % K2O). Potassium is indeed quite discriminant between the 6 groups. This K-rich group in the
felsic branch could correspond to compositions like
alkali feldspar for the igneous materials [12]. Some of
that material could be incorporated in small proportions to sedimentary rocks, which would explain higher K contents than expected in some observations [13,
14]. Another example is given by 4 of the 5 points
measured on Chakonipau (a flat-lying, light-toned
rock, just exposed at the surface in a pebbly soil, Sol
338) that are rich in Si (75 wt. % SiO2), Al (15 wt. %
Al2O3), Na (3.9 wt. % Na2O), and K (4.0 wt. % K2O).
46th Lunar and Planetary Science Conference (2015)
New data since Sol 600: We computed the barycenters of the 6 groups defined so far as the mean
composition weighted by the silhouette parameter [15],
which quantifies the clustering quality for each target.
It is then possible for each of the 1902 new measurements to compute (in the ICA compositional space) the
distance to the center of the groups and to compare it
with the typical distances of well classified targets.
With only 3 exceptions (1 point on Kittery,
Quechee_Gorge, and Crystal_Spring), all the targets
post Sol 600 can fall in the pre-defined groups. Although a new clustering analysis suggests slightly different groupings, in which Fe vs. Ti on one side and K
vs. Na on the other side could play more important
roles in the subdivisions of the main branches. Less
Ca-rich points were measured on rocks, even though
the Ca/Si ratio tends to increase in aeolian deposits
[16]. However, observations at the most recent rover
waypoint: Pahrump Hills (since Sol 758), reveal many
diagenetic features, including Ca-rich veins, which
will change again the definition of that group along the
traverse [17].
Conclusions: The initial clustering seems robust
as the vast majority of new measurements relates to
one of its groups. Even if this suggests some common
sources with materials encountered before by the rover, we also see some changes since Curiosity arrived at
the base of Aeolis Mons (Mount Sharp) in the target
chemical compositions [18]. Consequently, it may
eventually become necessary to define a new group or
2789.pdf
a subdivision in a pre-existing group. A statistical test
can be developed to decide if the clustering must be
revised by checking occasionally the consistency of
the groups, for example through silhouette calculations
or standard deviation profiles of target distances to the
cluster centers. In future steps, the clustering can be
conducted separately on igneous rocks, conglomerates,
and sedimentary rocks. Finally this work is meant to
be included in a larger effort of classification using the
entire Curiosity payload.
References: [1] Grotzinger et al. (2013) Science,
10.1126/science.1242777. [2] Mangold et al. (2015)
EGU, submitted. [3] McLennan et al. (2015) LPS
XLVI, this issue. [4] Gasnault et al. (2013) LPS XLIV,
Abstract #1994. [5] Gasnault et al. (2014) Mars 8
Conf., Abstract #1269. [6] Schmidt et al. (2015) LPS
XLVI, this issue. [7] Wiens R.C. et al. (2012) Space
Sci. Rev., 10.1007/s11214-012-9902-4. [8] Maurice S.
et al. (2012) Space Sci. Rev., 10.1007/s11214-0129912-2. [9] Wiens et al. (2013) SCAB 82, 1-27.
[10] Sautter et al. (2014) JGR 119, 10.1002/
2013JE004472. [11] Nachon et al. (2014) JGR 119,
10.1002/2013JE004588. [12] Sautter et al. (2015) LPS
XLVI, this issue. [13] Fisk et al. (2014) AGU, Abstract
# P54B-08. [14] Le Deit et al. (2015) LPS XLVI, this
issue. [15] Rousseeuw (1987) J. Comput. Appl. Math.
20, 53–65. [16] Cousin et al. (2015) LPS XLVI, this
issue. [17] Nachon et al. (2015) LPS XLVI, this issue.
[18] Forni et al. (2015) LPS XLVI, this issue.
Figure: Schematic dendrogram for the first six groups defined with ChemCam data between Sols 13 and 586. The
two insets illustrate the distribution of the ICA scores for Si and Ca in the groups.

© Copyright 2026