
Computer Programs for Performing Hierarchical
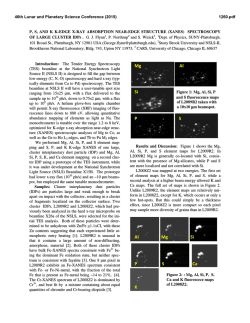
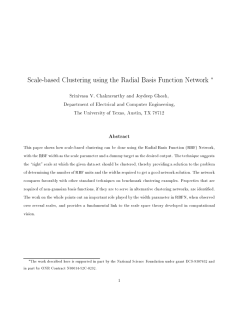
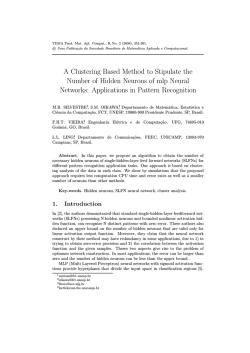
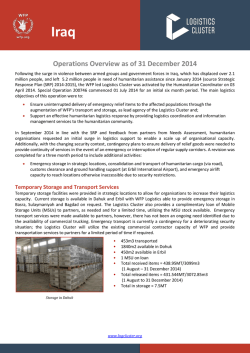
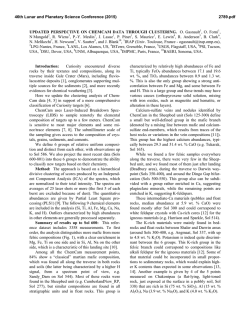
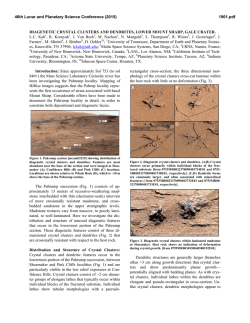
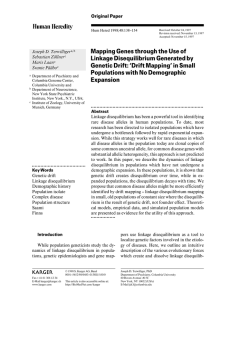
Computer Programs for Performing Hierarchical
Cluster Analysis
Mark S. Aldenderfer
University of Missouri—St. Louis
Roger K. Blashfield
University of Florida
This paper analyzes the versatility of 10 different popular programs which contain hierarchical
methods of cluster analysis. The intent of the paper
is to provide users with information which can be
of assistance when choosing a cluster analysis program. The four dimensions which are emphasized
when discussing these programs are (1) agglomeration vs. division, (2) linkage form, (3) similarity
measure, and (4) hierarchical solution vs. singlerank.
Corresponding with the rapid growth of interest in cluster analysis as a method for forming
objective classifications has been the development of a large number of computer programs
and packages which have made the technique
widely available. Blashfield (1976a) has documented that well over fifty different programs
and packages which perform cluster analysis are
currently in use. This figure probably underestimates the amount of computer software developed to perform these techniques, and more
realistic estimates range into the hundreds.
A consumer-oriented evaluation of this large
amount of software is clearly required because
there is a striking diversity in the quality, versatility, and usability of these programs. Some
programs are user-oriented, whereas others proAPPLIED PSYCHOLOGICAL MEASUREMENT
Vol. 2. No. 3 Summer 1978 pp. 403-411
@ Copyright 1978 West Publishing Co.
vide the user with only the barest information on
the clustering process and its solution. All programs differ in terms of the number and types of
linkage options available, data handling features, similarity options, graphics, and cluster
diagnostics. This report is intended to provide
users with information that will help them
choose the programs most appropriate for their
needs and also inform them of the advantages
and disadvantages of popular programs.
Because of the enormous literature on hierarchical methods of cluster analysis (Sneath &
Sokal, 1973), it is impossible for any single researcher to attempt a truly comprehensive review. Also, because the number of programs developed to implement these methods has grown
rapidly in the last 13 years, only the most popular and commonly available programs will be reviewed. There are three general sources of clustering programs: (1) statistical &dquo;packages,&dquo; (2)
programs which perform only one type of cluster
analysis, and (3) programs collected in books.
The statistical packages discussed in this paper
BMP, CLUSTAN, NTPAK, NTSYS,
OSIRIS, and SAS. The programs emphasizing
are
one method of clustering analysis
HGROUP and HICLUS. Finally, books
only
are
by
Anderberg (1973), denoted as ANDER, and
Hartigan (1975), denoted as HART, are included. These 10 programs are among the 14
most popular, as determined through a ques405
Downloaded from the Digital Conservancy at the University of Minnesota, http://purl.umn.edu/93227.
May be reproduced with no cost by students and faculty for academic use. Non-academic reproduction
requires payment of royalties through the Copyright Clearance Center, http://www.copyright.com/
406
tionnaire sent to cluster
analysis
users
(Blash-
field, 1976a).
this report is an
of
versatility
clustering software. Versatility is defined as the range of hierarchical options available to the user, the clarity
and completeness of interpretive aids, and the
flexibility of the software for application to a
wide variety of research problems. Versatility is
especially important when considering cluster
analysis because of the confusion surrounding
the evaluation of the adequacy of clustering results. Because no consensus on appropriate
evaluative criteria exists, it is essential that the
user be aware of the many types of cluster analysis and the specific properties of each method.
Moreover, no single clustering method is applicable to all research problems; the option to
choose the most suitable method for a particular
research problem is thus extremely important.
Specifically, this report will focus on the general hierarchical options and graphics available
in each program or package. Interested readers
will find more detailed discussions of other types
of clustering software in a series of unpublished
&dquo;Consumer Reports&dquo; available from the second
author (Blashfield & Aldenderfer, 1977; AldenThe
primary emphasis of
single-rank solution. Table 1 summarizes the
characteristics of the 10 programs along these 4
dimensions.
vs.
assessment of the
derfer, 1977 ; Blashfield, 1977a, 1977b).’
General Hierarchical
Options
There have been numerous attempts to specify the most important dimensions of variability
said to characterize all clustering methods.
Bailey (1974) has listed 12 &dquo;criteria&dquo; to be used
in choosing a clustering method; Sneath and
Sokal (1973) have presented 8 &dquo;options&dquo; which
also serve to guide choice of method. Four of
these dimensions are crucial for the understanding of hierarchical clustering methods: (1)
agglomeration vs. division, (2) linkage form, (3)
similarity measure, and (4) hierarchical solution
’Copies of the four "Consumer Reports" on cluster analysis
software can be obtained for one dollar ($1.00) from the address given at the end of this article.
Agglomeration vs. Division
In hierarchical
clustering systems, there are
strategies of creating a classification:
agglomeration or division. Agglomerative
methods begin with N individuals (cases, opera-
two basic
tional taxonomic units, or OTUs), each in its
own cluster, and then combine individuals into
more clusters until only one cluster exists. That
is, if K is defined as the number of clusters,
K=N at the start of the procedure; and at the
end, K=1. Divisive procedures are the exact
opposite: K=1 at the start of a divisive procedure, and K=N at its termination (or the endpoint value of K in divisive methods can be determined by the user). Of the 10 programs, only
CLUSTAN contains a divisive method; all 10
programs contain agglomerative methods.
Linkage Form
Linkage form refers to the set of rules used in
agglomerative methods to join individuals together to create groups or clusters. Linkage
types have been described by many authors in
great detail. Sneath and Sokal (1973) provide an
exceptionally clear representation of how each of
the linkage types works by using hypothetical
data sets to illustrate the sequence of links which
create the dendrogram. Everitt (1974) also provides simple examples of linkage form differences. The following are the most common
linkage types found in hierarchical agglomerative clustering:
Single linkage clustering. First discussed by
Sneath (1977), this method of clustering specifies that an individual may join a cluster if it has
a certain level of similarity with at least one of
the members of that cluster. Connections between entities and clusters and between two
clusters are thus based on links between single
entities. In application, single linkage leads to
Downloaded from the Digital Conservancy at the University of Minnesota, http://purl.umn.edu/93227.
May be reproduced with no cost by students and faculty for academic use. Non-academic reproduction
requires payment of royalties through the Copyright Clearance Center, http://www.copyright.com/
407
Table 1
Characteristics of Popular Software Programs for
Hierarchical Cluster Analysis
the formation of long, straggly clusters, described as chaining. Despite this difficulty, one
&dquo;school&dquo; of numerical taxonomy claims that this
method is to be preferred because it is the only
method satisfying a set of analytical criteria
which should be satisfied by all methods. (Jardine & Sibson, 1968a, 1968b, 1971). All programs except HGROUP, OSIRIS, and SAS contain the single linkage method as an option.
Complete-linkage clustering. This method is
logically the opposite of single-linkage analysis.
Instead of an entity joining with only one entity
in a cluster, complete linkage requires that an
entity be within a specified level of similarity
with all members of that cluster. This method
tends to form compact, hyperspherical clusters
which join one another only at very low levels of
similarity. Only HART and HGROUP do not
contain a complete linkage option.
Average linkage methods. These were first
discussed by Sokal and Michener (1958) as an
antidote to the extremes of single and complete
linkage. Essentially, these methods compute an
average of the similarity of an entity with the entities of a cluster and will join the entity to the
cluster if a given level of similarity is achieved
using this average. A number of definitions
computing the average similarity exist. One
of
of
these is the arithmetic average, in which the
average of the similarity values between entities
and cluster are computed. Sneath and Sokal
(1973) differentiate the use of arithmetic averaging from centroid clustering. In the latter
method, the first step is to calculate the centroid
of each cluster and then to measure the similarity between that centroid and the centroid of the
cluster or entity which joins it. Average linkage
methods can be further specified by noting if
weighting of the clusters is permitted. There has
been a long debate in biology concerning
whether or not a researcher should a priori
weight clusters joining another on the basis of
the number of entities each may possess. (The
interested reader may consult Sokal &
Michener, 1958, and Sneath, 1969, for details.)
The four prominent methods of average linkage
cluster analysis are
1.
Unweighted pair-group method using arithmetic averages (UPGMA; available in
ANDER, BMDP, CLUSTAN, HARTIGAN, NTPAK, and NTSYS)
Downloaded from the Digital Conservancy at the University of Minnesota, http://purl.umn.edu/93227.
May be reproduced with no cost by students and faculty for academic use. Non-academic reproduction
requires payment of royalties through the Copyright Clearance Center, http://www.copyright.com/
408
method using
arithmetic averages (WPGMA; available in
NTSYS and CLUSTAN)
Unweighted pair-group centroid method
(UPGMC; available in NTPAK, NTSYS,
2.
3.
Weighted pair-group
and CLUSTAN)
4.
Weighted pair-group
(WPGMC; available in
centroid method
NTSYS and CLUS-
TAN)
tion-UPGMA. OSIRIS, HICLUS, SAS,
HART, and NTPAK are the least versatile of the
programs and packages under discussion from
the standpoint of linkage options.
Similarity Measures
UPGMA is by far the most commonly used of
these methods and is the only one of these
methods to be recommended if group averages
are sought (see Sneath &
Sokal, 1973, for relevant
complete, and average linkage-but this procedure only clusters variables. BMDP2M, designed to cluster cases, has one op-
arguments).
Minimum variance methods. While a
number of these methods exist, the best known
is Ward’s (1963) method. This method erects a
hierarchical tree by satisfying an objective function each time the program joins entities and/or
clusters. In Ward’s method, the objective function is the sum of the within-group sum of
squares, also known as the error sum of squares.
At each stage in the analysis, every possible pair
of combinations of clusters is considered, and
the pair that produces the minimum increase in
the objective function is clustered together. This
method has been virtually ignored in the biological literature but has been extensively used in
many of the social sciences. This method generally finds clusters of spherical shape but also
has a tendency to find clusters of equal size.
Monte carlo comparisons of cluster analysis
methods have favored Ward’s method (Blashfield, 1976b; Hubert, 1972). ANDER, CLUSTAN, and HGROUP are the only programs containing Ward’s method.
CLUSTAN is by far the most versatile package in terms of the number of methods available. CLUSTAN contains 10 hierarchical
methods, including 2 divisive methods. ANDER
(7 methods) and NTSYS (6 methods) also show
high versatility, with the only popular method
absent from NTSYS being Ward’s method. The
BMDP procedures have moderate versatility.
The BMDP1M procedure has 3 options-single,
All hierarchical methods of clustering require
the calculation of a similarity matrix of the cases
or OTUs used in the clustering exercise.2 If the
number of cases is N, the order of the similarity
matrix is N x N. That is, the similarity of each
case to every other case is calculated, and these
values are used by the clustering method to
create clusters. Similarity can be defined as the
degree of value of resemblance an entity has
with another entity on the basis of the characters
or attributes each of them possesses. Dissimilarity, of course, is the converse, being in
some sense the &dquo;distance&dquo; between entities.
High similarity values imply low dissimilarity
values, and vice versa.
The literature on how to choose a similarity
coefficient is almost as confused and complex as
that which surrounds the choice of the sorting
strategy. It has been observed repeatedly that
different similarity measures used with the same
clustering method can produce quite different
results. The concept of similarity varies from
problem to problem, and the researcher must
choose coefficients on the basis of two general
criteria: (1) what metrics best assess the characteristics of the entities and (2) what similarity
measures best express resemblance among enA note of caution on terminology and representation is
2
N
appropriate. Jardine and Sibson (1971b) refer to the N ×
matrix of similarities as raw data. Normally, this term is reserved for the N x P matrix of cases and their attributes,
where P is the number of attributes. Also, the representation
of the N x P matrix differs in the biological sciences. In
biology, the rows are the attributes (P) and the columns are
the cases (N). In the nonbiological sciences, this is usually reversed.
Downloaded from the Digital Conservancy at the University of Minnesota, http://purl.umn.edu/93227.
May be reproduced with no cost by students and faculty for academic use. Non-academic reproduction
requires payment of royalties through the Copyright Clearance Center, http://www.copyright.com/
409
tities. As with the choice of
clustering method,
single similarity measure is appropriate for
all problems.
Following Sneath and Sokal (1973), the large
body of similarity measures can be divided into
four major groups:
no
1.
Distance measures are generally used with
continuous or ordinal data but are applicable to binary/qualitative data as well. The
user must be aware that many types of distance exist, and not all of them need be
similar to the Euclidean metric. (Distance
metrics are discussed at length by Gower,
1972).
2.
3.
4.
Association coefficients are generally used
with binary, categorical, or qualitative data.
Correlation coefficients, such as Pearson’s r,
are used for continuous data.
Probabilistic similarity coefficients are
based on information statistics. These are
unique in that instead of a measure of
similarity being computed between entities,
the information gain of the combination of
two entities is evaluated, and the pair which
provides the least information gain (in the
Shannon sense) is fused. This type of measure works directly from the raw data and
does not require the estimation of similarity
between entities in the traditional sense of
the term.
in the number of similarity
among the packages is great, ranging
from 1 to 38. CLUSTAN has by far the most extensive range of coefficients (38), covering all 4
coefficient types discussed above. NTSYS has 21
similarity measures, including all but a
probabilistic coefficient; ANDER has 15
similarity options; and BMDP has 9. None of
the remaining programs contains more than 2
The
variability
measures
similarity measures.
Two programs, HICLUS and OSIRIS, are
unique in that they require the user to input the
similarity matrix instead of the raw data. All
programs except HGROUP will permit the user
to input a similarity matrix as an option.
Finally, it should be noted that optional
procedures in two programs-BMDP, using
BMDP1M, and OSIRIS, using CLUSTR-permit the
user
to cluster variables instead of ob-
jects.
Hierarchical vs.
Single-Rank
This dimension of hierarchical clustering
methods refers to the nature of the relationships
among cases at the finish of the clustering procedure. The most familiar representation of a
hierarchical system. is that of a &dquo;tree,&dquo; or
dendrogram, as defined by Hartigan (1967).
Ranks in a tree or dendrogram are represented
by the level of similarity at which individuals,
groups of individuals, and finally groups of
groups of individuals are successively joined.
Thus, an individual may be simultaneously a
member of clusters at two or more ranks; that is,
clusters formed early in the clustering procedure
can be members of &dquo;higher order&dquo; clusters
joined at later stages.
The concept of hierarchical representation of
data set was developed primarily in biology.
The structure of output from a hierarchical clustering method resembles the traditional hierarchical structure of Linnean taxonomy with its
graded sequence of ranks. The preference for
hierarchical clustering methods in the biological
sciences is further strengthened by a &dquo;school&dquo; of
taxonomic thought which claims that it is possible to reconstruct the phylogenetic relationships
of organisms using numerical taxonomy. This
school of thought was first expressed in Principles of Numerical Taxonomy by Sokal and
Sneath (1963), which revolutionized the development of cluster analysis.
In contrast to the biological sciences, which
favor classifications having a hierarchical structure, many of the social sciences are generally interested in single-rank classifications. The intent
behind this use of clusters is to produce a given
number of homogeneous clusters, which may or
may not be related in a hierarchical fashion.
Iterative partitioning methods of clustering are
a
Downloaded from the Digital Conservancy at the University of Minnesota, http://purl.umn.edu/93227.
May be reproduced with no cost by students and faculty for academic use. Non-academic reproduction
requires payment of royalties through the Copyright Clearance Center, http://www.copyright.com/
410
the methods used most
clusters of single rank.
frequently
to
produce
Although most trees generated by hierarchical methods are interpreted as wholes (i.e., on
the nature of the linkages and levels of fusion of
the entities), they can also be &dquo;cut&dquo; to form single-rank classifications. To accomplish this, the
user must decide how many clusters exist in the
data set and then scan the tree to find the level
of similarity at which this number of clusters is
produced. A line drawn at right angles to the
tree at the level produces the desired number of
clusters.
The most popular form of graphic output
from the hierarchical cluster analysis is the dendrogram. This is the well-known &dquo;tree&dquo; which
provides the user with a visual representation of
the results of the cluster analysis. This visual
representation is extremely helpful in the
evaluation of the results of the clustering. As
might be expected, the programs and packages
differ considerably in their representation of the
tree
or
dendrogram.
The output of a tree is standard for most programs ; but some packages, such as NTSYS and
CLUSTAN, require the user to include control
cards with output specifications so the tree can
be printed. All other packages have as standard
default options the drawing of a tree. The exception to this is CLUSTAN. While CLUSTAN IC
has an extensive graphics package, the graphics
are not produced by the line printer. Separate
job steps must be run in order to obtain a
dendrogram from an off-line plotting device.
The portability of these off-line graphic features
from CLUSTAN may present difficulty at some
computer centers. All other packages and programs have line printer graphics.
NTSYS generates the most easily visualized
dendrograms from a line printer. An example of
an NTSYS tree is shown in Figure 1. From this
figure it can be seen that at the first step, Entities 1 and 5 join to form a cluster; at the next
step, Entity 2 joins the clusters of 1 and 5, while
8 and 10, 3 and 4, and 6 and 7 also merge. The
dendrograms of the remaining packages are not
as well organized visually. For instance, the tree
from BMDP2M (Figure 2) is difficult to read because of its compactness, orientation, and the
lack of easily observable &dquo;nodes&dquo; in the tree
where entities and clusters fuse. A revision of
BMDP2M generates a tree which is much
Downloaded from the Digital Conservancy at the University of Minnesota, http://purl.umn.edu/93227.
May be reproduced with no cost by students and faculty for academic use. Non-academic reproduction
requires payment of royalties through the Copyright Clearance Center, http://www.copyright.com/
411
easier to interpret. The same problem exists with
the trees formed by HICLUS, OSIRIS, and SAS
(see example of SAS plot in Figure 3). This type
of tree is better described as &dquo;sky-line plot&dquo; because of its shape. Although the nodes can be
discerned, these plots do not have the visual
crispness of the trees produced by NTSYS and
ANDER.
CLUSTAN, SAS, HGROUP, BMDP, and
ANDER are the five programs which make it
relatively easy for a user to determine a singlerank solution. Both programs provide output
which details the agglomeration, or division, occurring at each step in the hierarchial clustering
process. In this regard, CLUSTAN’s output is
the most readable. CLUSTAN will output, as an
option, the entire membership list of entities in
each cluster for a given number of clusters
(rank) and the means and standard deviations of
these clusters. The latter output (membership
lists and descriptive statistics) is very useful to
any user interested in a single-rank solution
from a hierarchical method and is only available
at present in CLUSTAN.
Conclusion
Of these 10 programs, CLUSTAN and
NTSYS are the most versatile and flexible of the
popular existing clustering programs.
Each of them contains a wide variety of clustering methods and similarity options. For the
biological scientist, NTSYS is superior because
of its easily generated dendrogram and other
features, such as the cophenetic correlation coefficient, which are specifically designed for
biological usage. Also, its user manual is
couched in the jargon of numerical taxonomy,
and the logic of the entire system is well suited
for biological problems. CLUSTAN is the program of choice for general users, particularly
those in the non-biological sciences, although
biologists will also appreciate some of CLUSTAN’s features. CLUSTAN will be preferred by
those researchers interested in single-rank solutions because of the superior output features
(other than graphics) which describe each level
of clustering. If the graphics package of CLUSTAN can be made available at an institution for
most
Downloaded from the Digital Conservancy at the University of Minnesota, http://purl.umn.edu/93227.
May be reproduced with no cost by students and faculty for academic use. Non-academic reproduction
requires payment of royalties through the Copyright Clearance Center, http://www.copyright.com/
412
reasonable cost, it is clearly superior to NTSYS
in many areas of user interest.
Of the other packages and programs considered, only ANDER shows comparable versatility ; however, the portability of ANDER is
somewhat limited because the programs were
written for CDC systems. Nevertheless, it was
found that adapting these programs for IBM
FORTRAN compliers was fairly easy. While the
ANDER collection of programs offers a reasonable amount of versatility, they are not user
oriented, and their use presupposes sophistication with FORTRAN and Anderberg’s book.
a
References
report on cluster
Hierarchical methods
(Report No. 2, N.S.F. Grant 74-20007). July 1977.
.
Anderberg, M.R. Cluster analysis for applications
New York: Academic Press, 1973.
Bailey, K.D. Cluster analysis. In D. Heise (Ed.),
Sociological methodology. San Francisco: Jossey-
Aldenderfer, M.S. A
consumer
analysis software: (2)
Bass, 1974.
Blashfield, R.K. Questionnaire
on cluster analysis
software. Classification Society Bulletin, 1976, 3,
25-42. (a)
Blashfield, R.K. Mixture model tests of cluster analysis : Accuracy of four agglomerative hierarchical
methods. Psychological Bulletin, 1976, 83,
377-388. (b)
Blashfield, R.K. A consumer report on cluster analysis software: (3) Iterative partitioning methods
(Report No. 3, N.S.F. Grant 74-20007). March
1977. (a)
Blashfield, R.K. A consumer report on cluster analysis software: (4) Usability (Report No. 4, N.S.F.
Grant 74-20007). March 1977. (b)
Blashfield, R.K., & Aldenderfer, M.S. A consumer
report on cluster analysis software: (1) Clustering
methods and their literature (Report No. 1, N.S.F.
Grant 74-20007). February 1977.
Everitt, B.S. Cluster analysis
. London: Halstead
Press, 1974.
Gower, J.C. Measurements of taxonomic distance
and their analysis. In J.S. Weiner & J. Huzinga
(Eds.), The assessment of population affinites
. Oxford : Clarendon Press, 1972.
Hartigan, J.A. Representation of similarity matrices
by trees. Journal of the American Statistical Association, 1967,
, 1140-1158.
62
. New York:
Hartigan, J.A. Clustering algorithms
Wiley, 1975.
Hubert, L. Some extensions of Johnson’s hierarchical
and nonhierarchical classifications. Psycho, 1972,
metrika
, 261-274.
37
Jardine, N., & Sibson, R. Construction of hierarchical and nonhierarchical classifications. Computer
, 1968,
Journal
, 116-117. (a)
13
Jardine, N., & Sibson, R. A model for taxonomy.
Mathematical Biosciences, 1968, 465-482. (b)
Downloaded from the Digital Conservancy at the University of Minnesota, http://purl.umn.edu/93227.
May be reproduced with no cost by students and faculty for academic use. Non-academic reproduction
requires payment of royalties through the Copyright Clearance Center, http://www.copyright.com/
413
Sibson, R. Mathematical taxonomy.
New York: Wiley, 1971.
Sneath, P.H.A The application of computers to
taxonomy. Journal of General Microbiology, 1957,
Jardine, N., &
jective
function. Journal
of the
American Statis-
tical Association, 1963,
, 236-244.
58
, 201-226.
17
Sneath, P.H.A. Evaluation of clustering methods. In
Acknowledgments
A.J. Cole (Ed.), Numerical taxonomy. London:
Academic Press, 1969.
Sneath, P.H.A., & Sokal, R.R. Numerical taxonomy.
San Francisco: W.H. Freeman, 1973.
Sokal, R.R., & Michener, C.D. A statistical method
for evaluating systematic relationships. Kansas
, 1409-1438.
38
University Science Bulletin, 1958,
Sokal, R.R., & Sneath, P.H.A. Principles of numerical taxonomy. San Francisco: W.H. Freeman,
1963.
Ward, J.H. Hierarchical grouping to optimize an ob-
This report was supported by a grant from the National Science Foundation (grant DCR #74-20007).
Appreciation is extended to Lyle Schoenfeldt for his
helpful suggestions on the preparation of this paper.
Author’s Address
K. Blashfield, Box J-256, JHMHC, DepartUniversity of Florida, Gainesville,
FL 32610
Roger
ment of Psychiatry,
Downloaded from the Digital Conservancy at the University of Minnesota, http://purl.umn.edu/93227.
May be reproduced with no cost by students and faculty for academic use. Non-academic reproduction
requires payment of royalties through the Copyright Clearance Center, http://www.copyright.com/


© Copyright 2026