
1369
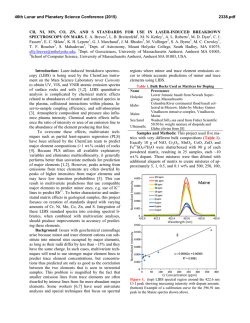
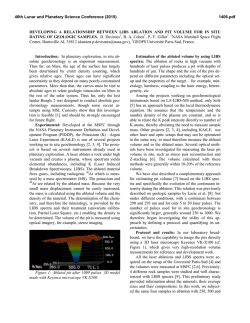
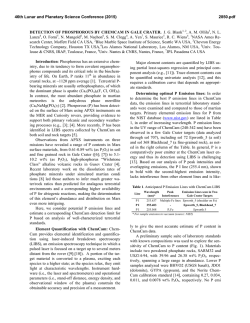
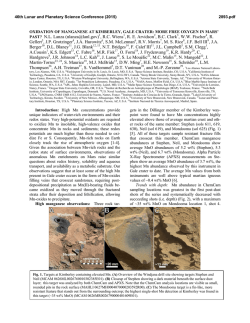
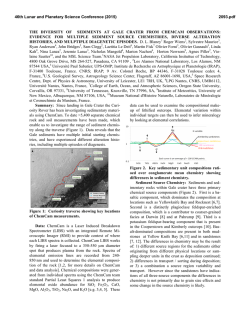
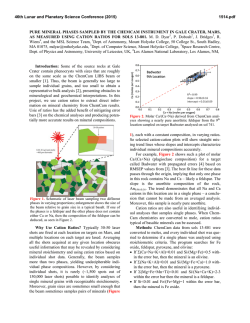
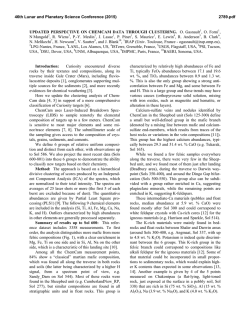
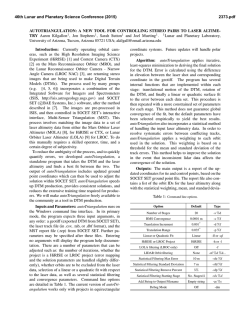
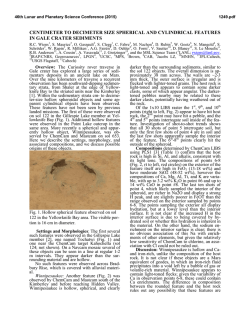
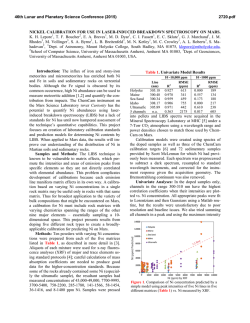
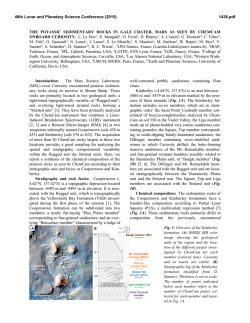
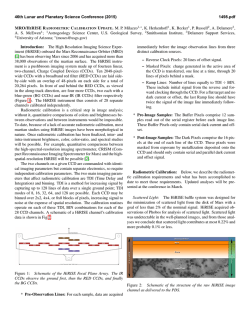
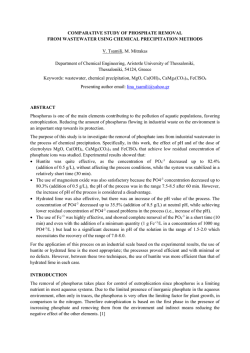
46th Lunar and Planetary Science Conference (2015)
1369.pdf
RELATIONSHIP BETWEEN MSL/CHEMCAM LASER FOCUS, PLASMA TEMPERATURE, AND
COMPOSITIONAL CALIBRATIONS. R.L. Tokar1, R.C. Wiens2, S. Maurice3, A. Cousin3, R. Gellert4, R. B.
Anderson5, S.C. Bender1, S.M. Clegg2, M.D. Dyar6, C. Fabre7, O.Forni3, O.Gasnault3, J. Lasue3 and N. Melikechi8,
1
Planetary Science Institute, 1700 E. Fort Lowell, Suite 106, Tucson, AZ, 85719-2395 ([email protected]), 2Los
Alamos National Laboratory, Los Alamos, NM, 87545, 3Institut de Recherche en Astrophysique et Planetologie,
Toulouse, France,4University of Guelph, ON, N1G 2W1, Canada, 5United States Geological Survey, Flagstaff, AZ,
86001, 6Mount Holyoke College, South Hadley, MA, 01075, 7University of Lorraine, Nancy, France, 8Delaware
State University, Dover, DE, 19901.
power density increases. Separate analysis not shown
here verifies both the clear existence and the increase
in the Si spectral peaks with improving focus.
Goldstone SOL 830
0.8
0.75
Si II (634 nm) / Si I (288 nm)
0.7
0.65
0.6
0.55
0.5
0.45
0.4
0.35
1
2
3
4
5
6
Laser Focal Plane
7
8
9
Figure 1: Goldstone (sol 830): Si II (634.7 nm) to Si I
(288.2 nm) spectra line ratio, a proxy for LIBS plasma
temperature.
Figure 2 illustrates for Goldstone the Mg 448
nm line variation with focal plane. The line peak area
is normalized to the sum of major element peak areas.
Goldstone SOL 830
0.028
0.026
0.024
Mg 448 nm
The Mars Science Laboratory (MSL) ChemCam instrument uses laser induced breakdown spectroscopy (LIBS) to determine the chemical composition of rocks and soils ~2 to 7m from the Curiosity
rover. ChemCam yields relatively high-precision
chemical composition due to good laser stability. Lessthan-optimal laser focus results in a lower laser power
density on the target, affecting the LIBS interaction
and thereby the calibration of elemental compositions.
On sol 801 a component of the ChemCam autofocus
algorithm failed, requiring spectra be taken at multiple
manual focus positions, until a new focus algorithm is
uploaded. LIBS spectra taken during this intermediate
time allows a careful study of the relationship between
focus, which is a proxy for the LIBS plasma electron
temperature, and compositional calibration.
ChemCam’s detectors are not gated, so the
assumption of local thermodynamic equilibrium that is
usually made when determining plasma temperatures
is not necessarily valid. Here the ratio of two Si emission lines: Si II (634.7 nm) to Si I (288.2 nm) is tested
as a proxy for plasma temperature. The observed ratios
of these emission lines for the on-board calibration
targets are used to select spectra for a reduced calibration model (a “sub model”). As an example, the technique is used to calculate MgO concentration for
Windjana (Mars sol 612), a relatively homogenous
rock also studied in detail by the MSL APXS (Alpha
Particle X-ray Spectrometer). Other oxides can be tested similarly. See [1] for calibration details of ChemCam and [2] for additional results on chemical quantification using the on-board calibration targets.
First the method is validated for the rock
Goldstone sampled on sol 830 in a controlled laser
focus test. In this test, ChemCam data for 9 laser focal
planes at a single point on Goldstone is taken with
focal plane separation of ~5 mm. (Goldstone distance
is ~2.25 m). There were 10 laser shots for plane 1 and
6 laser shots for planes 2-9 for a total of 58 laser shots.
Figure 1 illustrates the Si line ratio for Goldstone obtained by ChemCam during the laser focus
test. At each plane is plotted the mean and standard
deviation for 6 laser shots (the first 4 shots for plane 1
are omitted due to dust contamination). Note the nearly
linear increase in the Si ratio for the first 5 focal planes
as the laser is brought into focus and the laser on-target
0.022
0.02
0.018
0.016
0.014
0.012
1
2
3
4
5
6
Laser Focal Plane
7
8
9
Figure 2: Goldstone: Observed Mg 448 nm spectral
line intensity.
Note the uniform increase for the first 5 focal planes
with maximum intensity at the optimal focus plane 5.
46th Lunar and Planetary Science Conference (2015)
12
10
0.65 < Si634/Si288 < 0.80
0.50 < Si634/Si288 < 0.65
0.35 < Si634/Si288 < 0.50
236*Mg448 + 0.1
277*Mg448 + 0.1
313*Mg448 − 0.2
90
80
70
60
Number of Spectra
To create the calibration sub models, the Si
line ratios observed for Goldstone (Figure 1) are
binned. For these bins, simple linear fits to the onboard calibration target known MgO composition vs.
observed Mg 448 nm line intensity are obtained (Figure 3). Note that Goldstone spectra from planes 1 and
2 are in bin 1 (blue), planes 3 and 4 in bin 2 (green)
and planes 5-9 in bin 3 (red).
1369.pdf
50
40
30
20
10
8
6
4
2
0
0
0.01
0.02
0.03
Mg 448 nm
0.04
0.05
0.06
Figure 3: Fits to on board calibration target known
MgO composition vs observed Mg line strength. MgO
composition offset slightly for clarity.
Note the slopes decrease as the Si ratio increases. For constant MgO, the Mg line intensity
should exhibit a corresponding increase. From the data
in Figure 2 the ratio of the average Mg 448 line from
bin 1 to bin 3 is 0.0232/0.0176 or 1.32 whereas the
ratio of the slopes is 313/236=1.33, a nearly constant
product. Specifically, MgO composition for Goldstone
for the three coarse bins is 5.3, 6.3 and 5.6% for an
average of 5.7% comparing favorably to the Goldstone
APXS MgO of 5.74±0.17% and 6.18±0.17%.
90
0.035
0.04
Mg 448 nm Peak Area
0.045
0.05
0.055
0.61 < Si634/Si288 < 0.72
10
8
Average Windjana
6
4
2
0.01
0.02
0.03
Mg 448 nm
0.04
0.05
0.06
Figure 6: MgO sub model for Windjana
Figure 6 illustrates the calibration target MgO
sub model for Windjana. An estimate of MgO concentration is obtained using the average fit (red line) and
the observed Mg line strength for Windjana. For MgO,
average concentration is 9.0 ± 1.3 weight percent, in
good agreement with APXS. It should be noted that
similar techniques can be used to create partial least
square (PLS) calibration sub models.
References: [1] Wiens, R.C. et al. (2013) Spectrochim Acta B, 82, 1–27. [2] Fabre, C. et al. (2014) Spectrochim Acta B, 99, 34-51.
80
70
Number of Spectra
0.03
12
0
0
100
60
50
40
30
20
10
0
0.45
0.025
Figure 5: Windjana Mg 448 = 0.036 ± 0.005
Finally, this technique is applied to Windjana
where APXS obtained 9.18 ± 0.25% (pre-brush) and
10.87 ± 0.25% (post-brush) for MgO weight percent.
Figures 4 and 5 show histograms of the Si ratio and
Mg 448 nm line strength for the 750 ChemCam laser
shots on Windjana. Note the well-behaved normal
distributions.
MgO (%)
MgO (%)
0
0.02
0.5
0.55
0.6
0.65
0.7
0.75
Si II (634.7 nm) / Si I (288.2 nm)
0.8
Figure 4: Windjana Si ratio = 0.66 ± 0.05
0.85
0.9


© Copyright 2026