
Atmospheric Condensation in the Mars Phoenix TECP and MET Data
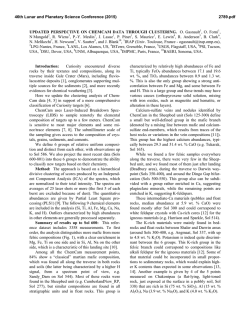
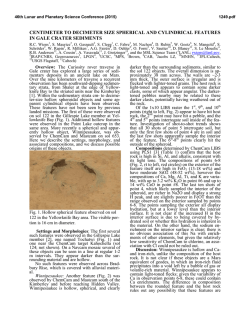
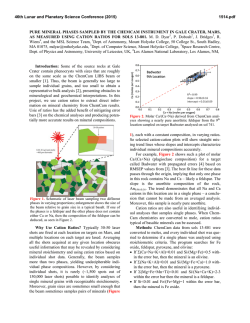
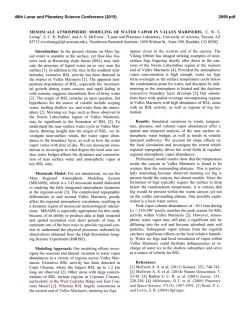
46th Lunar and Planetary Science Conference (2015)
2861.pdf
ATMOSPHERIC CONDENSATION IN THE MARS PHOENIX TECP AND MET DATA A. P. Zent, MS
245-3 NASA Ames Research Center, Moffett Field, CA 94035 ([email protected])
Introduction: A new calibration function for the
humidity sensor in the Thermal and Electrical Conductivity Probe (TECP), a component of the Microscopy,
Electrochemistry, and Conductivity Analyzer (MECA)
on the Phoenix Mars mission has been developed. The
data is now cast in terms of Frost Point (Tf) and some
flight data, taken when the atmosphere is independently known to be saturated, is included in the calibration
data set. Combined with data from the Meteorology
Mast air temperature sensors, a very sensitive detection
of atmospheric saturation becomes possible (Figure 1).
Discussion: Overnight, the Mars atmosphere saturated with respect to water vapor, particularly late in
the mission. On several sols, the TECP captured data
during this event. For all atmospheric temperatures, we
report only values from the uppermost thermocouple
on the 1-meter meteorology mast (total height ~ 1.9),
which we refer to as Tair. Heating from the lander deck
and instruments can affect data from the other thermocouples under some wind regimes, whereas fluid dynamics calculations indicate that temperatures at the
top of the mast are minimally affected [1].
Generally the atmosphere cools rapidly, and around
2400h or earlier reaches saturation At that time, two
things can be seen in the data. First, on most nights
after ~ sol 50, there is an inflection in the Tf data; that
is, ∂Tf/∂t changes when saturation is reached. Tf tracks
Tatm, but is generally a few degrees warmer, a point
which will be addressed below. Secondly (also after
sol 50), Tatm exhibits excursions of up to 6K upon
reaching Tf, accompanied by a sharp increase in variance that persists for 1 -2 hours. The fact that changes
the independent TECP and MET data occur essentially
simultaneously, and at the point that the atmosphere
cools to the frost point, leaves little doubt that the instruments are responding to saturation of the atmosphere and the beginnings of H2O condensation/deposition. This is grossly consistent with the
LIDAR observations of surface-based clouds forming
near 0000h [2].
The combined TECP and MET data provide strong
support for the argument [3] that the Viking landers
detected the signature of atmospheric saturation in air
temperature measurements. The Viking landers did not
have an instrument designed to detect atmospheric
water vapor. However, during the night, the observed
rate of decline of the atmospheric temperature at the
1.6-m height of the meteorology boom decreased for a
period of about an hour and then resumed its original
value. Based on the behavior of this inflection and the
detection of enhanced atmospheric opacity at night
Ryan and Sharman [3] interpreted the nighttime tem-
perature inflection to be a radiative effect due to the
formation of an ice fog and thus the result of atmospheric saturation and condensation of water vapor. In
Figure 2, the air temperature data from VL1 (Sol 21) is
plotted along with the MET and TECP data for the
evening of Sol 70. The Viking data are at a much lower frequency (~ 8 minute intervals) than the MET data,
and miss the high frequency signal. The inflection occurs later (near 0200h v. 2300h for PHX) and at lower
temperature (191 K, v. 200 K for PHX), but the similarity of shape and magnitude of the two curves suggests a commonality, which we argue is the detection
of the frost point.
The TECP-MET data indicate that the base of the
atmosphere was regularly saturating at night by sol 47.
Ice fogs were observed as early as sol 38, [4] but
LIDAR did not begin to reliably detect ground fogs
until ~ sol 80. This is not necessarily an inconsistency, since the TECP-MET measurements were made at
≤ 2 m elevation, while the LIDAR was limited to
measurements at heights >50 m due to transmitter/receiver overlap. SSI observations of the LIDAR
beam include scatter from atmospheric aerosols below
200 m, and allow recovery of the ice water content
(IWC) of fogs [5]. Ice fogs were detected as early as
sol 61 using this approach, which was the first observation of its kind. Thus, the TECP and LIDAR data
are consistent with saturation beginning much earlier
in the mission than sol 80.
Models of cloud microphysics in the martian environment typically require supersaturation of 10 – 20 %
in order to initiate nucleation. From our data alone, it
is not possible to distinguish between cases where: a)
there is no supersaturation and Tf is the actual condensation temperature, and b) supersaturation is required,
such that the actual frost point of the atmosphere is
somewhat lower than the measured Tf. However, a
sample calculation of both cases for sol 70 demonstrates that the resulting uncertainty in the partial pressure of H2O is ≤ 0.1 Pa.
With respect to the coldest overnight hours, where Tf
is seemingly several K warmer than Tair, Figure 2
makes it clear that Tf is pegged to Tb, the internal temperature of the TECP, for a period slightly in excess of
1.5 hours centered about 0100h. A reasonable inference is frost condensation inside the TECP housing;
the instrument was designed to allow equilibration
between ambient and internal H2O vapor, so this would
not be a totally surprising outcome. Measured Tf values do not reflect the ambient conditions if ice is present in the TECP housing, but Tb and Tf diverge by
0200h, indicating the ice is short-lived.
46th Lunar and Planetary Science Conference (2015)
There appear to be complementary excursions in
Tair, both of which initiate at the time Tair reaches Tf ; in
the present case a positive signal at ~2230h and a
negative deviation just before 0400h. The short term
variance in Tf also changes more or less commensurately with both intersections with Tair; variance decreases after 2300h, and increases again after 0400h. It
is possible to draw a simple continuum through the Tair
curve and numerically integrate the area of the signal
to estimate the heat associated with this processes. The
two areas in Figure 2 are the same to within 5%, and
indicate an average absolute ΔTair of just over 4 K in
both cases. This appears to require far more energy
than would be available from latent heat if ice were
condensing directly on the thermocouple (see [3]; the
numerical values in the Phoenix case are of the same
order as their analysis of the Viking data).
The highest Tf measured by TECP occurs in the early morning (~0700h) on Sol 80 and later [6]. Given the
possibility of overnight condensation in the TECP
housing, one must question these maxima. Generally,
as on sol 70, Tf follows the internal temperature after
saturation. The frost point diverges from the TECP
temperature sometime between 0100-0400h, indicating
that ice is no longer present in immediate proximity to
the humidity sensor. However, Tf > Tair for another
few hours. During this interval Tf continues to increase
in a smooth and continuous manner, indicating that ice
continues to control the humidity, but there is uncertainty whether the ice is in the ambient, or some relatively cold corner of the TECP housing. The MET and
Solid State Imager (SSI) data are consistent with the
former.
After ~ sol 80, clouds, and to an unspecified extent
ground fog, remained through the early morning hours
[2]. In addition, the length of the fall streaks indicated
that the ice crystals had fall speeds that are consistent
with prolate ellipsoids with volume-equivalent radii of
35 µm, similar to terrestrial cirrus clouds (i.e. fall velocities will be several cm s-1). LIDAR suggests [1, 4]
somewhat smaller particles for the fog (~ 20 µm), but
even these should fall at ~ 1 cm s-1. Thus, small quantities of ice are expected on the surface early in the
morning. Calculations of ~ 4 pr µm on the surface [7]
on the morning of sol 100, and ~ 2.5 pr µm on sol 113
[5] have appeared in the literature. Since the surface
will begin warming before the PBL is fully convective,
the morning Tf maxima may result from sublimation of
that surface ice and the subsequent decrease in Tf
would reflect the onset of convective instability that
mixes the near-surface vapor back into the PBL. A
causal relationship with precipitation of fog aerosols
would likewise explain why early morning humidity
peaks do not occur prior to the regular appearance of
nighttime fogs.
2861.pdf
As for the frost point apparently exceeding the air
temperature, this may well demonstrate a limitation in
our assumption that the MET sensor represents the
temperature of the air around the TECP; at the time of
the measurements, the TECP was about 50 cm closer
to the surface than the MET sensor, and just over 3
meters to the northeast, on the opposite side of the
lander body (Fig. 1).
References: [1] Davy, R. J. et al., 2010. J. Geophys. Res.,
115, E00E13, doi:10.1029/2009JE003444; [2] Whiteway et
al., 2009, Science, 325, 68 – 70; [3] Ryan and Sharman,
1981, J. Geophys. Res., 86, 503-511. [4] Dickinson, C., et
al., 2010. GRL, 37, L18203, doi:10.1029/2010GL044317. [5]
Moores et al.; 2011, GRL., 38, L04203, doi:10.1029/
2010GL046315. [6] Zent, A. P. et al., 2015, Submitted to:
JGR, [7]. Daerden, F., et al. 2010. GRL, 37, L04203,
doi:10.1029/2009GL041523.
Figure 1. Relative positions of the MET mast atmospheric
temperature transducer and the atmospheric H2O sensor on
the TECP.
Figure 2. Sol 70. Simultaneous excursions in frost point
(blue circles) and air temperature (black line) at around
2300h. Red cicrcles are the TECP internal temperature.
Grey circles record similar phenomenon at VL1.


© Copyright 2026