
Idea Cellular Ltd.| Q3FY15 Result Update
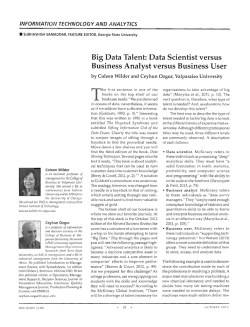
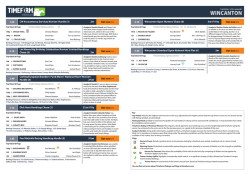
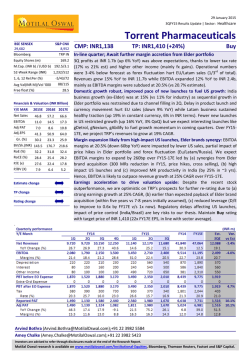
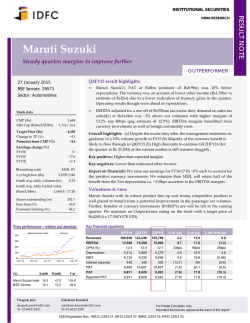
Result Update January 28, 2015 Idea Cellular Ltd. Previous Mixed-set of performance: Maintain HOLD but downward revision in TP of Rs.160 Rating : HOLD Rating : HOLD Key Result Highlights Target : Rs.160 Target : Rs.167 Rs.mn Q3 FY15 Q2 FY15 Q3 FY14 Q‐o‐Q % Revenue 80,175 75,699 66,130 5.9% EBIDTA 27,527 24,907 20,557 10.5% PAT 7,670 7,559 4,677 1.5% EPS 2.2 2.1 1.4 1.5% Current CMP : Rs.170 STOCK INFO BSE NSE Bloomberg Reuters Sector Equity Capital (Rs mn) Face Value (Rs) Mkt Cap (Rs mn) 52w H/L (Rs) Avg Daily Vol (BSE+NSE) 532822 IDEA IDEA IN IDEA.BO Telecom - Services 33,100 10 612,832 177/125 7,149,744 SHAREHOLDING PATTERN % (as on Dec. 2014) Institutions Others, Incl Public Promoters 28.2 29.1 42.7 Source: BSE STOCK PERFORMANCE (%) 1m IDEA 13 SENSEX 6 3m 9 12 12m 10 39 Y‐o‐Y % INSPL est Variance(%) Comments 21.2% 80,421 -0.3% In-line Est 33.9% 26,797 2.7% In-line Est 64.0% 8,236 -6.9% Below-Est 52.7% 2.3 -6.9% Below-Est Source: Company Filings; IndiaNivesh Research Idea Cellular Ltd (Idea) Q3FY15 result was largely in-line with our expectations; except net profit which was below our estimates. Top-line grew by 21.2% Y/Y (+5.9% Q/Q) to Rs 80.2bn against INSPL est of Rs.80.4bn. The revenue growth was led by 18.1% Y/Y (+5.1% Q/Q) increase in total volume minutes and 16.8% Y/Y (+4.7% Q/Q) increase in subscriber addition. During the quarter, minutes of usage per user per month (MoU) increased 3.2% Y/Y (+1.0% Q/Q) to 388 mints (v/s 376 mints in Q3FY14 and 384 mints in Q2FY15). Average revenue per user (APRU) also went-up 5.9% Y/Y (+1.7% Q/Q) to Rs.179 (v/s Rs.169 in Q3FY14 and Rs.176 in Q2FY15). ARPM went-up to 46.3 paisa (v/s 44.9 paisa in Q3FY14 and 45.9 in Q2FY15). EBITDA stood at Rs27.5bn (INSPL est: Rs26.7bn), Up 33.9% Y/Y (+10.5% Q/Q) on account of higher revenue base. As a result, consolidated EBITDA margin expanded 325bps Y/Y (down 143 bps Q/Q) to 34.3% (v/s 31.1% in Q3FY14). PAT for quarter stood at Rs.7.7 bn (INSPL est. Rs.8.2 bn), up 64.0% Y/Y/1.5% Q/Q, owing to higher EBITDA base, partially offset by rise in depreciation expenditure. During the quarter, the company reported higher other income of Rs.1,321 mn (v/s Rs.1,139 mn in Q3FY14 and Rs. 1139 mn in Q2FY15). After adjusting other income, net profit stood at Rs. 6.4 bn, Up 61.0% Y/Y (down 1.1% Q/Q) relative to Rs.3.9 bn in Q3FY14. Source: Capitaline, IndiaNivesh Research Key Results Takeaway IDEA v/s SENSEX Operating KPI’s Update… 150 140 130 Idea registered increase in subscriber base of 6.7 mn resulting in total subscriber base of 150 mn (up 4.7% Y/Y). Voice volume grew by 18.1% Y/Y to 171 bn minutes (v/s 145 bn minutes in Q3FY14). On the sequential basis voice volume increased 5.1% y/y due to seasonal uptick. MoU/sub increased at 388 minutes relative to 376 minutes in Q3FY14 and 384 minutes in Q2FY15. Blended churn rate reduced on y-o-y/q-o-q basis to 4.2% from 5.6%/5.0% in Q3FY14/Q2FY15. During the quarter post-paid churn rate stood at 2.7% [v/s 3.0% in Q2FY15 and 2.7% in Q3FY14] and pre-paid churn rate was at 4.3% [v/s 5.8% in Q2FY15 and 5.1% in Q3FY14]. ARPU increased to Rs.178 v/s (Rs.171 in Q3FY14 and Rs.176 in Q2FY15). Average revenue per minutes (ARPM) increased 3.1% Y/Y/0.9%Q/Q to 46.3 paisa due to increase in VAS revenue. Idea remains the key gainer in MNP with net gain of 11.9 mn subscribers. Idea’s VLR subscribers (active subscribers) remain highest in the industry at 100.9% (to 149 mn subscribers) of total subscriber base. The share of VAS (non-voice) revenues went up to 23.1% (v/s 21.1% in Q2FY15 and 16.1% in Q3FY14) of total revenue. Total data subscribers increased 33.8%Y/Y to 34.1 mn [v/s 25.5 mn in Q3FY14]. Sequentially, data subscribers increased 10.4% to 34.1 mn [v/s 30.9 mn in Q2FY15]. Average revenue per megabytes (ARMB) stood at 26.9 paisa (v/s 26.5 paisa in Q2FY15 and 29.6 paisa in Q3FY14). The company reported data ARPU of Rs.126 (v/s Rs.119 in Q2FY15 and Rs.91 in Q3FY14). Data contribution to the total services revenue 120 110 100 90 80 70 60 IDEA 22/Jan/15 08/Jan/15 25/Dec/14 11/Dec/14 30/Oct/14 27/Nov/14 16/Oct/14 13/Nov/14 02/Oct/14 18/Sep/14 04/Sep/14 24/Jul/14 21/Aug/14 10/Jul/14 07/Aug/14 26/Jun/14 12/Jun/14 29/May/14 17/Apr/14 15/May/14 03/Apr/14 01/May/14 20/Mar/14 06/Mar/14 23/Jan/14 20/Feb/14 06/Feb/14 50 Sensex Source: Capitaline, IndiaNivesh Research Daljeet S. Kohli Head of Research Tel: +91 22 66188826 [email protected] Amar Mourya Research Analyst Tel: +91 22 66188836 [email protected] IndiaNivesh Research IndiaNivesh Securities Private Limited 601 & 602, Sukh Sagar, N. S. Patkar Marg, Girgaum Chowpatty, Mumbai 400 007. Tel: (022) 66188800 IndiaNivesh Research is also available on Bloomberg INNS, Thomson First Call, Reuters and Factiva INDNIV. Result Update (contd...) stood at 15.7% [v/s 14.0% in Q2FY15 and 9.5% in Q3FY14]. Non-data business contribution to the total services revenue went-up to 7.4% (v/s 6.6% in Q3FY14 as % of services rev]. The 3G Cell Sites (EOP) increased 39.4% Y/Y to 27,744 (v/s 19,904 in Q3FY14). Services business EBIDTA Margins update… Idea revenues in established and new circles grew by 20.3% Y/Y and 38.5% Y/Y, respectively. Additionally, EBIDTA from established circles (ESA) increased 35.6% Y/Y. However, losses in new circles (NSA) expanded to Rs.1.9bn [v/s Rs1.6bn in Q3FY14 and Rs.1.8 bn in Q2FY15]. ESA EBITDA margin expanded 399bps Y/Y to 35.4% on back of strong operational performance. On sequential basis, ESA EBITDA margin expanded 150bps Q/Q to 35.4% (v/s 33.9% in Q2FY15) due to seasonal uptick. The losses in NSA attributable to expansion of 3G services in new circles (rolled out 2,580 v/s 1,873 3G cell sites in Q3FY14). We believe losses from the new circles could contract going ahead, as data business starts generating higher volumes. Implied Indus EBITDA margins expanded In Q3FY15 revenues from Indus JV (16%) stood at Rs.6.09bn, up 8.0% Y/Y and 1.8% Q/Q. Indus EBITDA for the quarter also went up 10.0% y/y/6.1% Q/Q at Rs.2,667 mn on back of higher revenue base. As a result, Indus implied EBITDA margin stood at 43.7% (v/s 42.9% in Q3FY14 and 41.9% in Q2FY15). Indus EBITDA margin to total revenue remain contracted to 3.3% (v/s 3.6% in Q3FY14). On the sequential basis Indus EBITDA margin to total revenue remain muted to 3.3% (v/s 3.3% in Q2FY15). During the quarter, the owned towers tenancy ratio stood at 1.59 (v/s 1.57 in Q3FY14 and 1.58 in Q2FY15). In Q3FY15, Idea rolled out ~2,326 2G cell sites (v/s ~5,630 in Q3FY14), taking the total 2G cell site base to ~1,09,931. Idea owns 9,521 towers and rest of the sites are rented (58,799 sites to Indus). Capex Update The Capex guidance for FY15 stands at Rs. 35 billion, excluding any spectrum related payout. The company’s consolidated net debt stood at Rs.142 bn (v/s Rs.146 in Q2FY15) with net debt to equity ratio of 0.64x (v/s 0.68x in Q2FY15). Net-debt to forward EBIDTA is at 1.39x (Rs142/Rs97bn) for FY15E. During the quarter, the capex and net debt amounts were higher by around Rs.814 million each due to forex loss on account of currency fluctuation. 3G+Broadband update Idea launched 4,906 (v/s 7,503 in Q3FY14) new sites (2G+3G) and expanded optical fibre network to 90,200 km [v/s 71,600 km in Q3FY14] in order to strengthen network capacities in NLD, ILD, ISP, Data Services and Devices. During the quarter, out of 144 mn subscriber, the number of customers adopting data services stood at 34.2 mn, now contributing 23.1% to total service revenue. The Data volume grew by 121% Y/Y to 46,077 mn MB in Q3FY15 [v/s 20,840 mn MB in Q3FY14]. The active 3G subscriber base for the company now stands at 16.1 mn (v/s 8.7 mn in Q3FY14). Valuations At CMP of Rs.170/share, the stock is trading at 7.4x FY15E, 6.5x FY16E, and 5.7x FY17E EV/ EBITDA estimates. The current quarter performance was well in-line with our estimate with strong volume growth. Additionally, the consistent growth in 3G subscriber base, increasing data as % of services revenue, and trajectory growth in total data volume (Mn MB) looks positive. However, uncertainty over launch of Reliance-JIO in 4G (voice/data) and upcoming spectrum auction remains the key hangover for the stock price. Our target price of Rs.167 is achieved, yielded 14% return since our recommendation. We maintain HOLD but reduce our target price to Rs.160 (5.3x FY17 EV/EBITDA) on stock due to above mentioned overhang. YE March (Rs. Mn) Net Sales PBDIT Adj PAT EPS (Rs) EBITDA Margin (%) ROE (%) P/E (x) EV/EBITDA (x) FY14A FY15e 2,65,190 83,204 20,096 6.0 31.4 12.8 28.7x 7.8x 3,10,272 1,02,390 27,925 7.9 33.0 13.8 21.7x 7.4x FY16e 3,50,608 1,15,701 33,308 9.4 33.0 13.4 18.2x 6.5x FY17e 3,96,187 1,32,723 39,619 12.0 33.5 13.1 14.3x 5.7x Source: Company Filings; IndiaNivesh Research IndiaNivesh Research Idea Cellular Ltd|Result Update January 28, 2015 | 2 Result Update (contd...) Quarterly Performance Income Statement (Conso) (Rs Mn) Revenue Gross Revenue - ESA Gross Revenue - NSA Revenue ‐ Standalone Indus (@ 16%) Spi ce (@41.09) Eli mi nations Revenue ‐ Consolidated Q3 FY15 Q2 FY15 QoQ Ch % Q1 FY15 Q4FY14 Q3 FY14 YoY Ch % 75,543 4,605 80,148 6,098 -6,071 80,175 71,437 4,236 75,673 5,990 -5,964 75,699 5.7 8.7 5.9 1.8 NM 1.8 5.9 71,547 4,015 75,562 5,854 -5,806 75,610 66,699 3,707 70,406 5,735 -5,703 70,438 62,779 3,326 66,105 5,645 -5,620 66,130 20.3 38.5 21.2 8.0 NM 8.0 21.2 48,802 6,486 55,288 3,431 -6,071 52648 47,245 6,034 53,279 3,477 -5,964 50792 3.3 7.5 3.8 NM ‐1.3 1.8 3.7 47,222 5,744 52,966 -1 3,412 -5,806 50571 45,144 5,381 50,525 -2,420 5,703 48105 43,063 4,907 47,970 -2,422 5,620 45548 13.3 32.2 15.3 NM ‐241.7 NM 15.6 26,741 -1,881 24,860 2,667 27527 0.033265 24,192 -1,798 22,394 2,513 24907 0.033197 10.5 4.6 11.0 NM 6.1 10.5 24,325 -1,729 22,596 2,442 25038 0.032297 21,555 -1,674 19,881 2,420 22301 0.034356 19,716 -1,581 18,135 2,422 20557 0.036625 35.6 19.0 37.1 NM 10.1 33.9 13,792 1,034 14826 18% 10,774 1,014 11788 16% 28.0 NM 2.0 25.8 10,586 959 11545 15% 10,402 977 11379 16% 10,671 995 11666 18% 29.2 NM 3.9 27.1 11,068 1,632 12700 11,621 1,498 13119 ‐4.8 NM 8.9 ‐3.2 12,010 1,483 13493 9,479 1,443 10922 7,465 1,426 8891 48.3 NM 14.4 42.8 2041 -1,321 720 263 983 2315 -1,139 1,176 269 1,445 ‐11.8 16.0 NM -38.8 NM ‐2.0 -31.9 2295 -290 2,005 270 2,275 2060 -425 19 1,654 312 1,966 1913 -733 34 1,214 362 1,576 6.7 80.2 NM -40.7 NM ‐27.3 -37.6 Dividend from Indus 0 1026 ‐100.0 3623 0 0 NM Tax‐Break Up Tax- Standal one Tax -Spi ce (@41.09) Tax - Indus (@16%) Tax-Consoli dated 3,565 482 4047 3,676 439 4115 ‐3.0 NM 9.8 ‐1.7 3,511 426 3937 2,687 371 3058 2,270 368 2638 57.0 NM 31.0 53.4 PAT Break‐Up PAT- Standal one PAT- Spi ce (@41.09) PAT- Indus (@16%) Di vi dent El i mi nati ons PAT‐ Consolidated 6,783 887 7670 7,795 790 7559 ‐13.0 NM 12.3 NM 1.5 10,117 788 7282 5,138 760 5898 3,981 696 4677 70.4 NM 27.4 NM 64.0 EBITDA Margin % Sta ndal one Cons ol i dated 31.0% 34.3% 29.6% 32.9% 142 143 29.9% 33.1% 28.2% 31.7% 27.4% 31.1% 358 325 8.5% 9.6% 10.3% 10.0% ‐184 ‐42 13.4% 9.6% 7.3% 8.4% 6.0% 7.1% 244 249 Q2 FY14 22 127 164 368 44.7 1.6 96 Q3FY14 22 129 169 376 44.9 2 96 Q4 FY14 22 136 173 397 43.6 2 96 Q1 FY15 22 139 181 401 45.1 2 96 Q2 FY15 22 143.6 176 384 45.9 2 96 Q3FY15 22 150 179 388 46.3 2 96 COGS - ESA COGS - NSA COGS ‐ Standalone Spi ce (@41.09) Indus (@ 16%) Eli mi nations COGS ‐ Consolidated EBITDA EBITDA- ESA EBITDA- NSA EBITDA ‐ Standalone Spi ce (@41.09) Indus (@ 16%) EBITDA ‐ Consolidated Dep & Amort. Break‐Up Dep & Amort.- Standal one Dep & Amort.- Spi ce (@41.09) Dep & Amort.- Indus (@ 16%) Dep & Amort ‐ Consolidated EBIT EBIT - Standal one EBIT -Spi ce (@41.09) EBIT - Indus (@ 16%) EBIT - Cons ol i dated Interest & Finance Cost Break‐Up Int Cos t - Standal one Int Income - Standal one Forex Loss /(Gai n) - Standal one Int & Fin Cost Standalone Int & Fi n Cost - Spice (@41.09) Int & Fi n Cost - Indus (@16%) Int & Fin Cost‐ Consolidated PAT Margin % Sta ndal one Cons ol i dated Key Performance Indicators (KPIs) Operating Service Area (EoP) - nos Subscriber Base (EoP) - mn Average Revenue Per Unit (ARPU) Average Minutes of Use Per User (MOU) Average Realisation per Minute (ARPM) Tenancy Ratio - Owned Towers Pre-Paid Subs (% of EoP Subscribers) Source: Company Filings; IndiaNivesh Research IndiaNivesh Research Idea Cellular Ltd|Result Update January 28, 2015 | 3 Result Update (contd...) Disclaimer: This document has been prepared by IndiaNivesh Securities Private Limited (“INSPL”), for use by the recipient as information only and is not for circulation or public distribution. INSPL includes subsidiaries, group and associate companies, promoters, employees and affiliates. INSPL researches, aggregates and faithfully reproduces information available in public domain and other sources, considered to be reliable and makes them available for the recipient, though its accuracy or completeness has not been verified by INSPL independently and cannot be guaranteed. The third party research material included in this document does not represent the views of INSPL and/or its officers, employees and the recipient must exercise independent judgement with regard to such content. This document has been published in accordance with the provisions of Regulation 18 of the Securities and Exchange Board of India (Research Analysts) Regulations, 2014. This document is not to be altered, transmitted, reproduced, copied, redistributed, uploaded or published or made available to others, in any form, in whole or in part, for any purpose without prior written permission from INSPL. This document is solely for information purpose and should not to be construed as an offer to sell or the solicitation of an offer to buy any security. Recipients of this document should be aware that past performance is not necessarily a guide for future performance and price and value of investments can go up or down. The suitability or otherwise of any investments will depend upon the recipients particular circumstances. INSPL does not take responsibility thereof. The research analysts of INSPL have adhered to the code of conduct under Regulation 24 (2) of the Securities and Exchange Board of India (Research Analysts) Regulations, 2014. This document is based on technical and derivative analysis center on studying charts of a stock’s price movement, outstanding positions and trading volume, as opposed to focusing on a company’s fundamentals and, as such, may not match with a report on a company’s fundamentals. Nothing in this document constitutes investment, legal, accounting and/or tax advice or a representation that any investment or strategy is suitable or appropriate to recipients’ specific circumstances. INSPL does not accept any responsibility or whatever nature for the information, assurances, statements and opinion given, made available or expressed herein or for any omission or for any liability arising from the use of this document. Opinions expressed are our current opinions as of the date appearing on this document only. The opinions are subject to change without any notice. INSPL directors/employees and its clients may have holdings in the stocks mentioned in the document. This report is based / focused on fundamentals of the Company and forward-looking statements as such, may not match with a report on a company’s technical analysis report Each of the analysts named below hereby certifies that, with respect to each subject company and its securities for which the analyst is responsible in this report, (1) all of the views expressed in this report accurately reflect his or her personal views about the subject companies and securities, and (2) no part of his or her compensation was, is, or will be, directly or indirectly, related to the specific recommendations or views expressed in this report: Daljeet S Kohli, Amar Maurya, Abhishek Jain, Yogesh Hotwani, Prerna Jhunjhunwala, Kaushal Patel, Rahul Koli, Tushar Manudhane & Dharmesh Kant. Following table contains the disclosure of interest in order to adhere to utmost transparency in the matter: 1. 2. 3. 4. 5. 6. 7. 8. 9. 10. 11. 12. 13. 14. Disclosure of Interest Statement INSPL is a Stock Broker registered with BSE, NSE and MCX - SX in all the major segments viz. Cash, F & O and CDS segments. INSPL is also a Depository Participant and registered with both Depository viz. CDSL and NSDL.Further, INSPL is a Registered Portfolio Manager and is registered with SEBI. Details of Disciplinary History of INSPL No disciplinary action is / was running / initiated against INSPL Details of Associates of INSPL Please refer to the important 'Stock Holding Disclosure' report on the IndiaNivesh website (investment Research Section - http://www.indianivesh.in/Research/Holding_Disclosure.aspx?id=10- link). Also, please refer to the latest update on respective stocks for the disclosure status in respect of those stocks. INSPL and its affiliates may have investment positions in the stocks recommended in this report. Research analyst or INSPL or its relatives'/associates' financial interest in the subject No (except to the extent of shares held by Research analyst or INSPL or its relatives'/associates') company and nature of such financial interest Research analyst or INSPL or its relatives'/associates' actual/beneficial ownership of 1% or more Please refer to the important 'Stock Holding Disclosure' report on the IndiaNivesh website (investment in securities of the subject company, at the end of the month immediately preceding the date Research Section - http://www.indianivesh.in/Research/Holding_Disclosure.aspx?id=10- link). of publication of the document. Also, please refer to the latest update on respective stocks for the disclosure status in respect of those stocks. INSPL and its affiliates may have investment positions in the stocks recommended in this report. Research analyst or INSPL or its relatives'/associates' any other material conflict of interest at the time of publication of the document No Has research analyst or INSPL or its associates received any compensation from the subject company in the past 12 months No Has research analyst or INSPL or its associates managed or co-managed public offering of securities for the subject company in the past 12 months No Has research analyst or INSPL or its associates received any compensation for investment banking or merchant banking or brokerage services from the subject company in the past 12 months No Has research analyst or INSPL or its associates received any compensation for products or services other than investment banking or merchant banking or brokerage services from the subject company in the past 12 months No Has research analyst or INSPL or its associates received any compensation or other benefits from the subject company or third party in connection with the document. No Has research analyst served as an officer, director or employee of the subject company No Has research analyst or INSPL engaged in market making activity for the subject company No Other disclosures No Details of business activity of IndiaNivesh Securities Private Limited (INSPL) INSPL, its affiliates, directors, its proprietary trading and investment businesses may, from time to time, make investment decisions that are inconsistent with or contradictory to the recommendations expressed herein. The views contained in this document are those of the analyst, and the company may or may not subscribe to all the views expressed within. This information is subject to change, as per applicable law, without any prior notice. INSPL reserves the right to make modifications and alternations to this statement, as may be required, from time to time. Definitions of ratings BUY. We expect this stock to deliver more than 15% returns over the next 12 months. HOLD. We expect this stock to deliver -15% to +15% returns over the next 12 months. SELL. We expect this stock to deliver <-15% returns over the next 12 months. Our target prices are on a 12-month horizon basis. Other definitions NR = Not Rated. The investment rating and target price, if any, have been arrived at due to certain circumstances not in control of INSPL CS = Coverage Suspended. INSPL has suspended coverage of this company. UR=Under Review. Such e invest review happens when any developments have already occurred or likely to occur in target company & INSPL analyst is waiting for some more information to draw conclusion on rating/ target. NA = Not Available or Not Applicable. The information is not available for display or is not applicable. NM = Not Meaningful. The information is not meaningful and is therefore excluded. Research Analyst has not served as an officer, director or employee of Subject Company One year Price history of the daily closing price of the securities covered in this note is available at www.nseindia.com and www.economictimes.indiatimes.com/markets/stocks/stock-quotes. (Choose name of company in the list browse companies and select 1 year in icon YTD in the price chart) IndiaNivesh Securities Private Limited 601 & 602, Sukh Sagar, N. S. Patkar Marg, Girgaum Chowpatty, Mumbai 400 007. Tel: (022) 66188800 / Fax: (022) 66188899 e-mail: [email protected] | Website: www.indianivesh.in Home IndiaNivesh Research Idea Cellular Ltd|Result Update January 28, 2015 | 4 IndiaNivesh Research is also available on Bloomberg INNS, Thomson First Call, Reuters and Factiva INDNIV.


© Copyright 2026