
Coal India (COALIN)
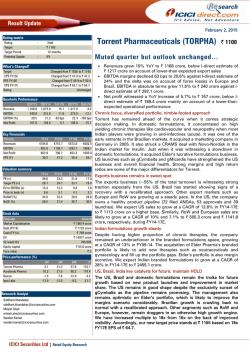
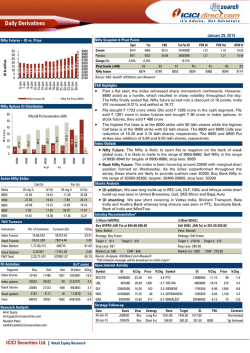
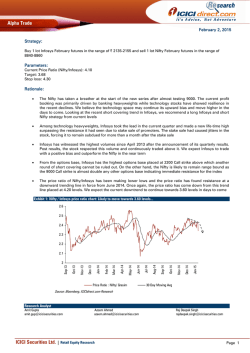
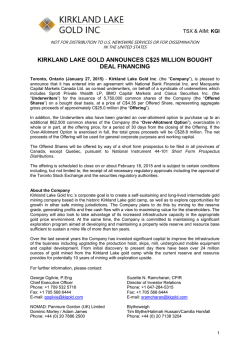
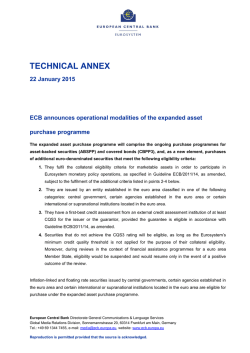
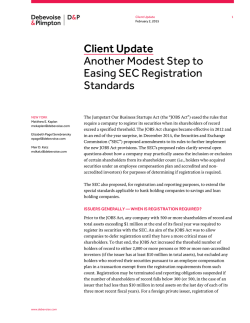
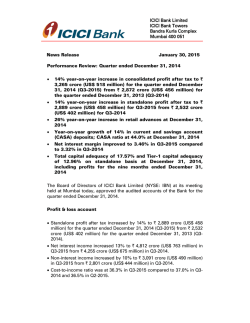
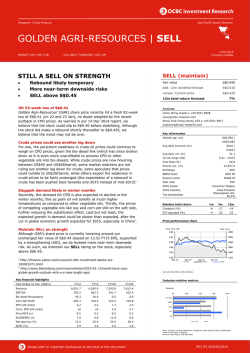
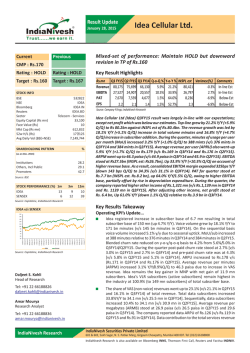
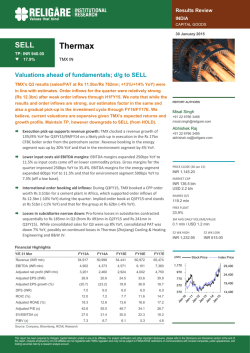
Offer for Sale Note
January 29, 2015
Rating matrix
Coal India (COALIN)
Rating
:
Floor Price | 358
Subscribe
Maharatna available at fair valuation…
Issue Details
Auction Date
Issue Size
January 30, 2015
| 22613 crore*
No of Shares on offer
63.16 crore *
Fresh Issue
Nil
*Based on floor price, considering 10% equity stake sale
Objects of the Issue
Objects of the Issue
It is an offer for sale wherein the entire proceeds will go to the
promoters of the company ie GoI by way of disinvestment and no
proceeds shall go to the company
Shareholding Pattern
Pre -Issue
Post - Issue#
No Of Shares (in Crore)
631.6
631.6
Promoters(%)
89.65
79.65
10.35
20.35
Non-Promoter (%)
#Considering 10% equity stake sale
Stock Data
Particular
Market Capitalization
Total Debt (FY14)
Amount
| 236863.7 Crore
| 171.5 Crore
Cash and Investments (FY14)
EV
52 week H/L
Equity capital
| 52389.5 Crore
| 184645.6 Crore
424 / 238
| 6316.4 Crore
Face value
| 10
Research Analyst
Dewang Sanghavi
[email protected]
Isha Bansal
[email protected]
ICICI Securities Ltd | Retail Equity Research
The Government of India (GoI) has launched an offer for sale (OFS) of
31.58 crore equity shares (5% stake) of Coal India (CIL) with an option to
sell an additional 31.58 crore equity shares (5% stake) collectively
aggregating to approximately 10% of the total paid-up equity share
capital of the company. Retail investors will be allocated shares at a
discount of 5%.
Government’s thrust on augmenting output augurs well for company
One of the key thrust areas of the new government has been on
augmenting domestic coal production to ease the crippling fuel scarcity in
the power sector. The Coal Ministry has highlighted CIL’s production
target at 1 billion tonnes by FY20 from the current level of 462 MT in
FY14. Though the government’s target is significantly optimistic and
aggressive, it reinforces its strong focus on enhancing CIL’s production.
We believe it is too early to model such aggressive assumptions.
However, easing of norms and simultaneous removal of offtake
bottlenecks could help realise the full potential performance of CIL.
Furthermore, most of the production growth is likely to be back-ended as
projects get implemented.
Healthy volume growth in Q3FY15 reiterates positive stance
Over the last couple of years, coal production at CIL has been sluggish
with FY13 and FY14 coal production growth at 3.7% and 2.3%,
respectively. However, with the increased thrust of the new government
on augmenting coal production, CIL was able to report healthy growth in
production volumes in the current fiscal year. In Q3FY15, CIL reported
double digit growth in its production volume, reiterating our positive
stance on the company. During Q3FY15, CIL’s production volume stood
at 131.7 MT, up 10.9% YoY. Sales volume in Q3FY15 was healthy at 124.6
MT, up 6.3% YoY. During April-December 2014, CIL’s production and
offtake stood at 342.4 million tonnes (MT) and 354.6 MT, respectively, up
7.3% and 3.8%, respectively, YoY.
Margins likely to increase, going forward
We believe Coal India will be a key beneficiary of declining diesel cost.
Hence, we expect EBITDA margins to improve, going forward, from
~19.0% reported in H1FY15 to ~22.5% in FY15E and ~22.1% in FY16E.
Furthermore, CIL is also likely to enjoy economies of scale on account of
increase in volumes. Going forward, on the back of strong demand from
key user industries, we also expect domestic prices to remain firm with an
upward bias.
Long term growth story intact, recommend subscribe
CIL has a strong balance sheet with robust cash flows and a healthy
liquidity position. At floor prices of | 358, the stock is quoting at FY16E
adjusted EV/EBITDA of 7.0x. We remain positive on the long term
prospects of the company. With a stable government in place at the
Centre, we believe the stock will be a key beneficiary of reforms in the
sector. Going forward, CIL is well poised to deliver a healthy performance
and is a priced asset worth holding in one’s portfolio. We recommend
SUBSCRIBE on the stock in the OFS.
Operational Highlights
Exhibit 1: Coal sales volume & realisations trend
1463
1500
1452
1400
1183
1200
400
1000
300
200
1600
423
464
433
525
498
472
800
600
| per tonne
million tonne (MT)
500
1472
1441
600
400
100
200
0
0
FY11
FY12
FY13
Sales
FY14
FY15E
FY16E
Blended Realizations
Source: Company, ICICIdirect.com Research
26.5
22.1
23.2
22.5
30
25
20
15,963
16,571
17,382
10
FY12
FY13
FY14
FY15E
FY16E
EBITDA
EBITDA Margin
5
(5)
%
15
| per tonne
25.1
18,084
18,500
18,000
17,500
17,000
16,500
16,000
15,500
15,000
14,500
14,000
Exhibit 3: … corresponding EBITDA/tonne
15,668
| crore
Exhibit 2: EBITDA margins trend
1600
1400
1200
1000
800
600
400
200
0
1443
1472
1463
1452
1500
317
362
389
339
333
335
FY11
FY12
FY13
FY14
FY15E
FY16E
1187
Realization
EBITDA/tonne
Source: Company, ICICIdirect.com Research
Source: Company, ICICIdirect.com Research
ICICI Securities Ltd | Retail Equity Research
Page 2
Financial Summary
Profit & Loss Account
Cash flow statement
[
(Year-end March)
Net Sales
Other Operating Income
Total Operating Income
Growth (%)
Raw Materials Consumed
Employee Expenses
Contractual Expenses
Overburden removal adjustment
Power & Fuel
Others
Total Operating Expenditure
EBITDA
Growth (%)
Depreciation
Interest
Other Income
Exceptional Item
PBT
Total Tax
PAT
Growth (%)
Adj EPS (|)
FY13
68302.7
68302.7
9.4
6,556.0
27,320.8
5,802.0
3,201.7
2,333.5
5,005.1
50219.1
18083.6
15.4
1813.0
45.2
8746.7
-6.9
24979.0
7622.7
17356.4
17.4
27.5
FY14
68810.0
68810.0
0.7
7,114.7
27,769.4
6,827.5
3,286.6
2,282.2
5,566.4
52846.9
15963.2
(11.7)
1996.4
58.0
8969.3
-1.4
22879.5
7767.9
15111.6
-12.9
23.9
FY15E
73704.1
73704.1
7.1
9,308.0
29,852.1
7,450.0
2,755.3
2,344.7
5,423.4
57133.5
16570.6
3.8
2115.3
4.4
8080.5
(20.6)
22552.0
7592.9
14959.1
-1.0
23.7
(Year-end March)
Profit after Tax
Add: Depreciation
Add: Interest
(Inc)/dec in Current Assets
Inc/(dec) in CL and Prov.
CF from operating activities
(Inc)/dec in Investments
(Inc)/dec in Fixed Assets
Others
CF from investing activities
Issue/(Buy back) of Equity
Inc/(dec) in loan funds
Interest Paid
Dividend paid & dividend tax
Others
CF from financing activities
Net Cash flow
Opening Cash
Closing Cash
FY16E
78750.6
78750.6
6.8
8,660.5
32,091.0
8,398.1
3,096.8
2,624.4
6,498.0
61368.9
17381.8
4.9
2325.5
4.8
11188.6
26240.1
8659.2
17580.8
17.5
27.8
FY13
17356.4
1813.0
45.2
-8492.4
5878.6
16600.7
-413.6
-2430.4
-722.1
-3566.0
0.0
381.7
-45.2
-10166.1
828.7
-9000.9
4033.8
58202.8
62236.6
FY14
15111.6
1996.4
58.0
10710.9
-9517.2
18359.6
-1237.3
-4278.0
283.3
-5232.1
0.0
-1737.6
-58.0
-21156.6
-22.4
-22974.7
-9847.1
62236.6
52389.5
FY15E
14959.1
2115.3
4.4
-21864.8
25917.1
21131.2
-100.0
-3500.0
0.0
-3600.0
0.0
0.0
-4.4
-8868.2
10.4
-8862.1
8669.0
52389.5
61058.5
FY16E
17580.8
2325.5
4.8
16018.0
-3658.6
32270.5
-100.0
-4000.0
0.0
-4100.0
0.0
0.0
-4.8
-8868.2
0.0
-8873.0
19297.5
61058.5
80356.0
[
Source: Company, ICICIdirect.com Research
Source: Company, ICICIdirect.com Research
[
Balance sheet
(Year-end March)
Liabilities
Equity Share Capital
Reserve and Surplus
Total Shareholders funds
Total Debt
Minority Interest & Others
Total Liabilities
Assets
Gross Block
Less: Acc Depreciation
Net Block
CWIP
Investments
Inventory
Debtors
Loans and Advances
Other Current Assets
Cash
Total Current Assets
Current Liabilities
Provisions
Current Liabilities & Prov
Net Current Assets
others
Application of Funds
Ratio Analysis
FY13
FY14
FY15E
FY16E
6,316.4
42,155.6
48472.0
1909.1
2369.5
52750.6
6,316.4
36,088.1
42404.5
171.5
2369.5
44945.5
6,316.4
42,189.5
48505.9
171.5
2369.5
51046.8
6,316.4
50,902.1
57218.5
171.5
2369.5
59759.5
39010.0
25544.9
13465.1
3496.0
2395.0
5617.8
10480.2
17370.1
4248.9
62236.6
99953.7
17222.9
51591.3
68814.2
31139.5
2255.0
52750.6
39010.0
27398.8
11611.3
7631.4
3632.3
5558.1
8241.0
7769.6
5437.5
52389.5
79395.7
18883.1
40413.9
59296.9
20098.7
1971.7
44945.5
41510.0
29514.1
11995.9
8631.4
3732.3
6557.7
9086.8
28640.3
4586.2
61058.5
109929.5
20192.9
65021.2
85214.1
24715.4
1971.7
51046.8
47010.0
31839.6
15170.4
7131.4
3832.3
8976.7
8198.7
9475.0
6202.6
80356.0
113209.1
19418.0
62137.5
81555.4
31653.6
1971.7
59759.5
(Year-end March)
Per share data (|)
Adj EPS
Cash EPS
BV
DPS
Cash Per Share
Operating Ratios (%)
EBITDA Margin
PBT / Total Operating income
PAT Margin
Inventory days
Debtor days
Creditor days
Return Ratios (%)
Adj RoE
Adj RoCE
RoA
Valuation Ratios (x)
P/E
EV / EBITDA
EV / Net Sales
Market Cap / Sales
Price to Book Value
Solvency Ratios
Debt/EBITDA
Debt / Equity
Current Ratio
Quick Ratio
[
Source: Company, ICICIdirect.com Research
FY13
FY14
FY15E
FY16E
27.5
30.3
76.7
14.0
98.5
23.9
27.1
67.1
29.0
82.9
23.7
27.0
76.8
12.0
96.7
27.8
31.5
90.6
12.0
127.2
26.5
36.6
25.4
31
56
92
23.2
33.3
22.0
30
44
100
22.5
30.6
20.3
30
45
100
22.1
33.3
22.3
36
38
90
35.8
32.3
32.9
35.6
32.8
33.6
30.8
29.7
29.3
30.7
26.2
29.4
12.7
8.9
2.4
3.2
4.6
14.6
10.6
2.5
3.2
5.2
14.8
9.7
2.2
3.0
4.6
12.6
8.1
1.8
2.8
3.9
0.1
0.0
1.5
1.4
0.0
0.0
1.3
1.2
0.0
0.0
1.3
1.2
0.0
0.0
1.4
1.3
[
Source: Company, ICICIdirect.com Research
ICICI Securities Ltd | Retail Equity Research
Page 3
RATING RATIONALE
ICICIdirect.com endeavours to provide objective opinions and recommendations. ICICIdirect.com assigns
ratings to its stocks according to their notional target price vs. current market price and then categorises them
as Strong Buy, Buy, Hold and Sell. The performance horizon is two years unless specified and the notional
target price is defined as the analysts' valuation for a stock.
Strong Buy: >15%/20% for large caps/midcaps, respectively, with high conviction;
Buy: >10%/15% for large caps/midcaps, respectively;
Hold: Up to +/-10%;
Sell: -10% or more;
Pankaj Pandey
Head – Research
[email protected]
ICICIdirect.com Research Desk,
ICICI Securities Limited,
1st Floor, Akruti Trade Centre,
Road No 7, MIDC,
Andheri (East)
Mumbai – 400 093
[email protected]
ICICI Securities Ltd | Retail Equity Research
Page 4
Disclaimer
ANALYST CERTIFICATION
We /I, Dewang Sanghavi, MBA (FIN) and Isha Bansal, MBA (FIN) research analysts, authors and the names subscribed to this report, hereby certify that all of the views expressed in this research report
accurately reflect our views about the subject issuer(s) or securities. We also certify that no part of our compensation was, is, or will be directly or indirectly related to the specific recommendation(s) or
view(s) in this report.
Terms & conditions and other disclosures:
ICICI Securities Limited (ICICI Securities) is a full-service, integrated investment banking and is, inter alia, engaged in the business of stock brokering and distribution of financial products. ICICI Securities is
a wholly-owned subsidiary of ICICI Bank which is India’s largest private sector bank and has its various subsidiaries engaged in businesses of housing finance, asset management, life insurance, general
insurance, venture capital fund management, etc. (“associates”), the details in respect of which are available on www.icicibank.com.
ICICI Securities is one of the leading merchant bankers/ underwriters of securities and participate in virtually all securities trading markets in India. We and our associates might have investment banking
and other business relationship with a significant percentage of companies covered by our Investment Research Department. ICICI Securities generally prohibits its analysts, persons reporting to analysts
and their relatives from maintaining a financial interest in the securities or derivatives of any companies that the analysts cover.
The information and opinions in this report have been prepared by ICICI Securities and are subject to change without any notice. The report and information contained herein is strictly confidential and
meant solely for the selected recipient and may not be altered in any way, transmitted to, copied or distributed, in part or in whole, to any other person or to the media or reproduced in any form, without
prior written consent of ICICI Securities. While we would endeavour to update the information herein on a reasonable basis, ICICI Securities is under no obligation to update or keep the information current.
Also, there may be regulatory, compliance or other reasons that may prevent ICICI Securities from doing so. Non-rated securities indicate that rating on a particular security has been suspended
temporarily and such suspension is in compliance with applicable regulations and/or ICICI Securities policies, in circumstances where ICICI Securities might be acting in an advisory capacity to this
company, or in certain other circumstances.
This report is based on information obtained from public sources and sources believed to be reliable, but no independent verification has been made nor is its accuracy or completeness guaranteed. This
report and information herein is solely for informational purpose and shall not be used or considered as an offer document or solicitation of offer to buy or sell or subscribe for securities or other financial
instruments. Though disseminated to all the customers simultaneously, not all customers may receive this report at the same time. ICICI Securities will not treat recipients as customers by virtue of their
receiving this report. Nothing in this report constitutes investment, legal, accounting and tax advice or a representation that any investment or strategy is suitable or appropriate to your specific
circumstances. The securities discussed and opinions expressed in this report may not be suitable for all investors, who must make their own investment decisions, based on their own investment
objectives, financial positions and needs of specific recipient. This may not be taken in substitution for the exercise of independent judgment by any recipient. The recipient should independently evaluate
the investment risks. The value and return on investment may vary because of changes in interest rates, foreign exchange rates or any other reason. ICICI Securities accepts no liabilities whatsoever for any
loss or damage of any kind arising out of the use of this report. Past performance is not necessarily a guide to future performance. Investors are advised to see Risk Disclosure Document to understand the
risks associated before investing in the securities markets. Actual results may differ materially from those set forth in projections. Forward-looking statements are not predictions and may be subject to
change without notice.
ICICI Securities or its associates might have managed or co-managed public offering of securities for the subject company or might have been mandated by the subject company for any other assignment
in the past twelve months.
ICICI Securities or its associates might have received any compensation from the companies mentioned in the report during the period preceding twelve months from the date of this report for services in
respect of managing or co-managing public offerings, corporate finance, investment banking or merchant banking, brokerage services or other advisory service in a merger or specific transaction.
ICICI Securities or its associates might have received any compensation for products or services other than investment banking or merchant banking or brokerage services from the companies mentioned
in the report in the past twelve months.
ICICI Securities encourages independence in research report preparation and strives to minimize conflict in preparation of research report. ICICI Securities or its analysts did not receive any compensation
or other benefits from the companies mentioned in the report or third party in connection with preparation of the research report. Accordingly, neither ICICI Securities nor Research Analysts have any
material conflict of interest at the time of publication of this report.
It is confirmed that Dewang Sanghavi, MBA (FIN) and Isha Bansal, MBA (FIN), research analysts of this report have not received any compensation from the companies mentioned in the report in the
preceding twelve months. Compensation of our Research Analysts is not based on any specific merchant banking, investment banking or brokerage service transactions.
ICICI Securities or its subsidiaries collectively or Research Analysts do not own 1% or more of the equity securities of the Company mentioned in the report as of the last day of the month preceding the
publication of the research report.
Since associates of ICICI Securities are engaged in various financial service businesses, they might have financial interests or beneficial ownership in various companies including the subject
company/companies mentioned in this report.
It is confirmed that Dewang Sanghavi, MBA (FIN) and Isha Bansal, MBA (FIN), research analysts do not serve as an officer, director or employee of the companies mentioned in the report.
ICICI Securities may have issued other reports that are inconsistent with and reach different conclusion from the information presented in this report.
Neither the Research Analysts nor ICICI Securities have been engaged in market making activity for the companies mentioned in the report.
We submit that no material disciplinary action has been taken on ICICI Securities by any Regulatory Authority impacting Equity Research Analysis activities.
This report is not directed or intended for distribution to, or use by, any person or entity who is a citizen or resident of or located in any locality, state, country or other jurisdiction, where such distribution,
publication, availability or use would be contrary to law, regulation or which would subject ICICI Securities and affiliates to any registration or licensing requirement within such jurisdiction. The securities
described herein may or may not be eligible for sale in all jurisdictions or to certain category of investors. Persons in whose possession this document may come are required to inform themselves of and
to observe such restriction.
ICICI Securities Ltd | Retail Equity Research
Page 5


© Copyright 2026