
Top Stories
Asia Pacific Equity Research 30 January 2015 Top Stories AFL Samsung Electronics (005930.KS, OW – W1,360,000), South Korea (JJ Park) Watch GS6 and System LSI: Expect the stock to break-through its historical high Despite macro headwinds, all the divisions (except CE) fared better than our expectations, and notably smartphone performance surprised on the upside on the back of ASP hike thanks to increased sales of high-end products and efficient expense management. SEC boosted its year-end dividend to W19,500/share. China Everbright International (0257.HK, OW – HK$11.46), China (Elaine Wu) Water M&A is the key catalyst in 2015 China Everbright Int'l is likely looking for water acquisition targets, in our view, after its water subsidiary announced a share placement last week. We see potential 10% upside to CEI’s earnings if Everbright Water geared up its balance sheet for M&A. Water acquisitions will likely be the key catalyst for CEI in 2015 as we believe awards of new waste-to-energy projects will slow this year after a record year in 2014. Indonesia 101 (Aditya Srinath, CFA) Equity Investors' Guide to ASEAN's Largest Economy Herein, we present a detailed guide for equity investors interested in Indonesia. High equity returns: 16% 10-year USD CAGR (20% Rp). High economic growth: 6%oya 10 year average GDP growth. init Taiwan Paiho Limited (9938.TW, OW – NT$49.70),Asia Pacific (Andre Chang, CFA) Hidden champion of sports-leisure growth; initiate at OW with PT of NT$65 We initiate coverage on Taiwan Paiho (Paiho) with an OW rating and a Dec-15 PT of NT$65, implying 31% potential upside. Paiho is the largest touch-fastener ODM manufacturer in the world, and also a leading producer of shoelaces/webbings, supplying all the major sportswear brands and their OEM/ODM producers. Trading at 13x 2015E P/E with a 20% EPS CAGR in 2014-16E, and a 3-4% dividend yield, the stock looks undervalued vs. other Taiwan sportswear stocks (17x-23x P/E). Paiho is also a beneficiary of US dollar strength, lower petrochemical prices, and the potential of Vietnam entering TPP. TSC Auto ID Technology (3611.TW, OW – NT$257.50), Taiwan (William Chen) Geared for market share gain; raise PT to NT$370 TSC is the No.6 barcode printer maker globally, competing with Zebra and Sato. We expect the upcoming market reshuffle to benefit Taiwan plays (as we have seen before). We expect TSC to deliver 20% Y/Y earnings growth in 2015-16 on market share gain and better product mix. TSC is now trading at 14x 1-year forward PER, with ROE of 33-34% and dividend yield of 4%+. Send me your feedback! Click below for the: J.P. Morgan Daily Valuations GLOBAL Stock Guide Daily Global Economic Briefing Link to Other FTMs page Link to J.P. Morgan Markets page Key Rating, Price Target & EPS Changes Markets at a glance AM perspective Adrian Mowat, Chief Equity Strategist Philippines: Bumper 4Q14 GDP Easing inflation and low domestic interest rates Source: BSP and Philippine Statistics Agency. The Philippines economy grew at a solid 6.9%oya (consensus 6.0%oya) in 4Q14. The tailwind from declining oil prices and easing inflation provide substantial room for monetary easing. Our economists forecast a 25bps RRP and SDA rate cut in 2H15. For more, please see Philippines: Bumper 4Q14 GDP sets tone for positive 2015 – oil provides material policy flex, penciling in 2H15 cut, Ong, et. al, 29 January 2015. ▼Pidilite Industries (PIDI.NS, N – Rs575.90), India (Gunjan Prithyani) Growth remains slow, and crude fall benefit priced in; downgrade to Neutral PIDI’s 3Q EPS of Rs2.4 was below estimates primarily due to lower-than-expected revenues. Volume growth of 8% Y/Y was the lowest in recent history, pointing to a sluggish demand environment. Comments from other building product companies corroborate this view. Margin tailwinds exist, though, given the sharp fall in crude price. However, we think the extent of the benefit from this will be lower than what the market seems to be pricing in. We factor in the benefit of lower RM prices and raise our earnings estimates by 14-16% for FY16/17. While we see PIDI as a high-quality company with monopolistic market share in its consumer business, valuations look demanding.Downgrade to Neutral with a new Mar-16 PT of Rs550. *J.P. Morgan Live Conference Call Series: Key Sectors, Markets & Themes - New - Sean Wu/ MW Kim - Asia Healthcare and Insurance* See end pages for analyst certification. For important disclosures, please refer to the disclosure section at the end of the individual linked notes. J.P. Morgan does and seeks to do business with companies covered in its research reports. As a result, investors should be aware that the firm may have a conflict of interest that could affect the objectivity of this report. Investors should consider this report as only a single factor in making their investment decision. Recommendation Changes Results and Company Views, continued ▼Pidilite Industries (PIDI.NS – Neutral), India KLCC Property Holdings (KLCC.KL – Neutral), Malaysia (Simone Yeoh) Analyst briefing takeaways: Retail sales outperform peers; Potential office oversupply should not be a concern (Gunjan Prithyani) Growth remains slow, and crude fall benefit priced in; downgrade to Neutral init Taiwan Paiho Limited (9938.TW – Overweight), Asia Pacific (Andre Chang, CFA) Hidden champion of sports-leisure growth; initiate at OW with PT of NT$65 Price Target and Estimate Changes Adani Power (ADAN.BO – Underweight), India (Sumit Kishore) Not out of the woods yet: Maintain UW AU Optronics (2409.TW – Underweight), Taiwan (Narci Chang) Confirmation of another capacity expansion plan; Reiterate UW CapitaRetail China Trust (CRCT.SI – Overweight), Singapore (Brandon Lee) Another quarter of sterling tenant sales growth Dr. Reddy's Laboratories Limited (REDY.BO – Overweight), India (Neha Manpuria) Strong results despite concerns on Russia; progress on Form 483s at API facility key for approvals Hyundai Steel Company (004020.KS – Overweight), South Korea (Daniel Kang) 4Q14 results - Beat, margins continue to expand on merger benefits, construction sector picking up I.T Ltd. (0999.HK – Neutral), Hong Kong (Shen Li, CFA) 3Q15 Update - Weak Sales Offset by Better than Expected Gross Margins Korea Aerospace Industries (047810.KS – Overweight), South Korea (Wan Sun Park) 4Q14 results in-line - differentiated earnings growth continues with high visibility AFL LG Electronics (066570.KS – Overweight), South Korea (JJ Park) Relative weak 4Q results and muted 1Q15 guidance Naver (035420.KS – Overweight), South Korea (Stanley Yang) LINE's robust monetization intact but disappointing MAU growth PTT Exploration & Production (PTTE.BK – Neutral), Thailand (Scott L Darling) Higher than expected impairment; Dividend disappoints PTT Exploration & Production (PTTE.BK – Neutral), Thailand (Scott L Darling) Potential net loss; impairment risks and dividend cut Samsung Electro-Mechanics (009150.KS – Overweight), South Korea (Masashi Itaya) 4Q Results: Good Impression from Swing to Profit, Buyback Announcement Samsung Engineering (028050.KS – Underweight), South Korea (Sokje Lee) 4Q14 results: In line, but contraction continues Samsung Heavy Industries (010140.KS – Neutral), South Korea (Sokje Lee) 4Q14 results: Harsh test of its offshore bias LG Display (034220.KS – Overweight), South Korea (JJ Park) Sizable FCF along with prudent capex should translate into higher shareholder returns Sands China (1928.HK – Overweight), Hong Kong (DS Kim) Unexiciting 4Q, as expected MakeMyTrip Ltd. (MMYT – Overweight), India (Viju K George) Muted quarter due to one-off miss in H&P; structural growth story intact; stay OW Sesa Sterlite (SESA.NS – Overweight), India (Pinakin Parekh, CFA) Strong results driven by Ally and Cu Tc/Rc; Ally prod guidance sharply higher and implies upside risk to FY16 AFL NTT Docomo (9437) (9437.T – Underweight), Japan (James R. Sullivan, CFA) 3Q expenses present 5% downside to FY15E EBITDA Sumitomo Mitsui Trust Holdings (8309) (8309.T – Overweight), Japan (Makoto Kuroda) 3Q Results: Buybacks Announced, Writebacks & Fees Continue to Support Pidilite Industries (PIDI.NS – Neutral), India (Gunjan Prithyani) Growth remains slow, and crude fall benefit priced in; downgrade to Neutral Wijaya Karya (WIKA.JK – Underweight), Indonesia, Thailand (Felicia Tandiyono) Analyst meeting takeaways Strategy POSCO (005490.KS – Neutral), South Korea (Daniel Kang) FY14 results - Miss, FY15 OP guidance at risk of downgrade PTT Exploration & Production (PTTE.BK – Neutral), Thailand (Scott L Darling) Cost reduction - a challenge AFL Samsung Electronics (005930.KS – Overweight), South Korea (JJ Park) Watch GS6 and System LSI: Expect the stock to break-through its historical high Emerging Markets Strategy Dashboards, , Global Emerging Markets (Adrian Mowat) Identifying change and providing perspective on key economic and equity market data of global emerging markets Indonesia 101, Asia Pacific (Aditya Srinath, CFA) Equity Investors' Guide to ASEAN's Largest Economy Philippine Strategy Flash (Jeanette Yutan) 2014 GDP growth surprise sets tone for better 2015E growth Economics SK Telecom (017670.KS – Overweight), South Korea (Stanley Yang) 2015 catalysts: Significant earnings growth, soft dividend hike, share buyback, SK Planet Autos drive December production; 4Q GDP set for manufacturing lift, Thailand (Benjamin Shatil) TSC Auto ID Technology (3611.TW – Overweight), Taiwan (William Chen) Geared for market share gain; raise PT to NT$370 Bumper 4Q14 GDP sets tone for positive 2015 – oil provides material policy flex, penciling in 2H15 cut, Philippines (Sin Beng Ong) Results and Company Views FKI business sentiment improved modestly in January, South Korea (Jiwon Lim) Advanced Info Services (ADVA.BK – Underweight), Thailand (Princy Singh) 2015 Outlook: Higher Capex and tepid growth. Time to shift the debate from regulation to data economics January inflation eases further; trade balance in small deficit — watching oil impact on fiscal revenues, Vietnam (Benjamin Shatil) Asian Paints Limited (ASPN.NS – Neutral), India (Latika Chopra, CFA) Q3FY15 First cut : Earnings disappoint on sales miss Bank Negara Indonesia Persero (BBNI.JK – Overweight), Indonesia (Harsh Wardhan Modi) Solid beat across the board; accumulate while the Street worries about management changes Bank of China (BOCHK) (2388.HK – Overweight), Hong Kong (Jemmy S Huang) Considering the sale of NCB? Bursa Malaysia Bhd (BMYS.KL – Neutral), Malaysia (Harsh Wardhan Modi) Good 4Q, but limited upside China Everbright International (0257.HK – Overweight), China (Elaine Wu) Water M&A is the key catalyst in 2015 AFL Genting Singapore (GENS.SI – Underweight), Singapore (Daisy Lu) Implication from MBS 4Q result HDFC (Housing Development Finance Corporation) (HDFC.BO – Overweight), India (Seshadri K Sen, CFA) 3Q15: strong retail loan growth; spreads improve Hotel Shilla (008770.KS – Neutral), South Korea (Youna Kim) Weak headline disguises strong details What to expect for CNY?, China (Haibin Zhu) Sector Research China City Gas Distributors, China, Hong Kong (Boris Kan) News of potential gas cost cut a positive China SMID Ideas, China, Hong Kong (Leon Chik, CFA) Feedback from China SMID Caps 1X1 Forum China Steel Sector, China (Daniel Kang) Mid-January CISA output falls ahead of CNY Dry Bulk Shipping, Asia Pacific (Corrine Png) Capesize earnings rose, mainly driven by higher iron ore shipping demand to China; port congestion fell Macau gaming, Asia Pacific (DS Kim) Full-smoking ban on the horizon? Our quick-and-dirty impact analysis Thai banks, Thailand (Anne Jirajariyavech, CFA) Solid liquidity; funding cost to stay low for longer with further downside possible IDFC (IDFC.BO – Overweight), India (Seshadri K Sen, CFA) 3Q15: NPLs stable; loan book contracts; loan spreads stable Appendix Key Rating, Price Target & EPS Changes Rating Changes J.P. Morgan EPS Estimate Changes Company Decreases Pidilite Industries New Rating Old Rating N OW Initiations Company Taiwan Paiho Limited Rating OW Price Target 65.00 Price Target Changes Company Increases Samsung Electronics TSC Auto ID Technology CapitaRetail China Trust Pidilite Industries Decreases POSCO I.T Ltd. Adani Power Source: J.P. Morgan estimates. Rating OW OW OW N N N UW Price Target New Old KRW 1,700,000 KRW 1,500,000 NT$370.00 NT$340.00 1.80 1.75 INR550.0 INR440.0 KRW 300,000 HK$2.50 INR40.0 KRW 330,000 HK$2.70 INR46.0 Company Increases Dr. Reddy's Laboratories Limited LG Display Pidilite Industries Samsung Electronics Decreases Adani Power AU Optronics Bank of Baroda CapitaRetail China Trust POSCO Revisions I.T Ltd. SK Telecom TSC Auto ID Technology Current FY Next FY +8.1% +13.1% +3.2% +13.9% +0.4% +6.1% +14.0% +9.0% -1141.4% -5.6% -80.0% -3.3% -52.7% -197.9% -4.9% -80.0% -2.6% -9.0% +5.3% +5.4% -1.1% -3.0% -5.4% +4.1% J.P. Morgan DPS Estimate Changes Company Increases Dr. Reddy's Laboratories Limited Pidilite Industries Samsung Electronics Decreases Bank of Baroda CapitaRetail China Trust Revisions AU Optronics TSC Auto ID Technology Current FY Next FY +8.1% +3.2% +29.1% +0.4% +14.0% +54.9% -80.0% -3.4% -80.0% -2.7% -5.6% -1.1% Markets at a glance China SHASHR Index Chg from previous day T/O value (CNYmn / US$MM) Chg from previous day Exchange rate O/N interbank (%) Market cap (CNYBn) Market cap (US$ Bn) FY1E Market P/E FY2E Market P/E Hong Kong 3,418.43 -1.32% 297,020 / 47,548 -13.24% CNY6.2 / US$1 2.78 24,887.4 3,984 18.0 15.6 Indonesia JCI Index Chg from previous day T/O value (Rp bn / US$MM) Chg from previous day Exchange rate O/N interbank (%) Market cap (US$Bn) Market cap (Rp bn) FY1E Market P/E FY2E Market P/E 3,419.05 0.00% 656 / 485 -28.79% SGD1.35 / US$1 1.35 574.7 777 22.3 18.5 Source: Bloomberg, J.P. Morgan estimates. KOSPI Index Chg from previous day T/O value (KRW bn / US$MM) Chg from previous day Exchange rate O/N interbank (%) Market cap (KRW Bn) Market cap (US$ Bn) FY1E Market P/E FY2E Market P/E 1,586.40 -0.40% 54 / 1,641 -3.62% Bt32.76 / US$1 1.90 450.5 14,758 16.4 15.1 TPX Index Chg from previous day T/O value (JPY bn / US$bn) Chg from previous day Exchange rate O/N interbank (%) Market cap (US$ bn) Market cap (JPY bn) FY1E Market P/E FY2E Market P/E SX5E Index Chg from previous day T/O value (Euro bn / US$bn) Chg from previous day Exchange rate O/N interbank (%) Market cap (US$ bn) Market cap (Euro bn) FY1E Market P/E FY2E Market P/E 29,681.77 0.41% 635 / 10,261 7.13% INR61.9 / US$1 7.75 1687.6 104,415 26.8 21.3 PSE Index Chg from previous day T/O value (Php MM / US$MM) Chg from previous day Exchange rate O/N interbank (%) Market cap (US$ bn) Market cap (Php bn) FY1E Market P/E FY2E Market P/E 7,617.30 -0.57% 13,054 / 296 24.82% Php44.09 / US$1 4.00 198.8 8,762 20.7 18.1 Taiwan 1,951.02 -0.54% 5,172 / 4,728 27.6% KRW1093.94 / US$1 2.00 1,347,709 1,232 15.1 12.5 TWSE Index DoD Change 52-Week Range T/O value (NT$ mn / US$MM) Chg from previous day Exchange rate O/N interbank (%) 10 Year Gov Bond Yield (%) Market cap (NT$Bn) Market cap (US$ Bn) FY1E Market P/E FY2E Market P/E 9,426.90 -0.88% 9,594 / 8,230 100,125 / 3,178 -2.26% TWD31.5 / US$1 0.39 1.49 27,147.9 999 18.3 13.6 Australia 1,413.58 -1.14% 2,453 / 21 7.09% JPY117.98 / US$1 0.13 4396.2 518,659 18.5 17.4 Euro Stoxx 6,825.94 0.21% 4.70 / 7.12 -0.63% US$1.51 / GBP1 0.47 2825.1 1,866 15.1 13.5 Sensex Index Chg from previous day T/O value (INR bn / US$MM) Chg from previous day Exchange rate O/N interbank (%) Market cap (US$Bn) Market cap (INR Bn) FY1E Market P/E FY2E Market P/E Philippines 1,782.18 -0.76% 2,230 / 615 -3.56% MYR3.63 / US$1 3.25 278.2 1,010 20.1 18.3 Japan UK UKX Index Chg from previous day T/O value (GBP Bn / US$bn) Chg from previous day Exchange rate O/N interbank (%) Market cap (US$ bn) Market cap (GBP bn) FY1E Market P/E FY2E Market P/E KLCI Index Chg from previous day T/O value (MYR MM / US$MM) Chg from previous day Exchange rate O/N interbank (%) Market cap (US$ bn) Market cap (MYR bn) FY1E Market P/E FY2E Market P/E South Korea Thailand SET Index Chg from previous day T/O value (Bt bn / US$MM) Chg from previous day Exchange rate O/N interbank (%) Market cap (US$Bn) Market cap (Bt bn) FY1E Market P/E FY2E Market P/E 24,595.85 -1.07% 80,388 / 10,369 0.01% HKD7.75 / US$1 0.04 33,635.4 4,338 15.0 13.9 Malaysia 5,262.72 -0.12% 4,304 / 342 4.67% Rp12,582 / US$1 6.51 418.2 5,261,914 20.3 17.9 Singapore STI Index Chg from previous day T/O value (SGD MM / US$MM) Chg from previous day Exchange rate O/N interbank (%) Market cap (US$ bn) Market cap (SGD bn) FY1E Market P/E FY2E Market P/E HSI Index Chg from previous day T/O value (HK$ mn / US$MM) Chg from previous day Exchange rate O/N interbank (%) Market cap (HK$Bn) Market cap (US$ Bn) FY1E Market P/E FY2E Market P/E India ASX200 Index Chg from previous day T/O value (AUD MM / US$MM) Chg from previous day Exchange rate O/N interbank (%) Market cap (AUD$ bn) Market cap (US$ bn) FY1E Market P/E FY2E Market P/E 5,569.49 0.30% 3,938 / 5,063 12.86% AUD0.78 / US$1 2.50 1550.1 1,206 18.6 18.0 US 3,358.96 -0.40% 12.19 / 13.76 4.82% US$1.13 / EURO1 3.21 2937.5 2,603 14.3 12.8 S&P Index Chg from previous day T/O value (US$ bn) Chg from previous day O/N interbank (%) Market cap (US$ bn) FY1E Market P/E FY2E Market P/E 2,002.16 -1.35% 38.44 17.73% 0.12 18357.1 16.7 14.8 Asia Analyst Focus List Open Trades (as of January 29, 2015 close) Country India Indonesia Malaysia OW UW Sector OW Tenaga PT Ace Hardware Indonesia, Tbk Petronas Chemicals Group Berhad Globe Telecom Consumer PT Ace Hardware Indonesia, Tbk Lite-On Technology Corporation Beijing Capital International Airport Daelim Industrial Oil and Natural Gas Corporation China Coal Energy - H Shanghai Electric Group Company Limited Quality Houses TAL Education Group Wowprime Samsung Electronics ASUSTek Computer Bharti Infratel Ltd. Maxis Berhad Air China – H Hanjin Shipping Co Ltd ICICI Bank Philippines Singapore Taiwan Sheng Siong Group TSMC Thailand Siam Commercial Bank Genting Singapore Formosa Chemicals and Fibre Corp Autos Financials UW Great Wall Motor Company Limited Daihatsu Motor (7262) Bank of China - H AMMB Holdings Emerging Technology Infrastructure and Industrials Oil/Gas - Energy Basic Materials Power Utilities Real Estate SMID Caps Technology Telecommunications and Media Transportation Source: J.P. Morgan Country relative performance in US$ (MSCI AC Asia Pacific ex JP) Sector relative performance in US$ (MSCI AC Asia Pacific ex JP) Source: J.P. Morgan, Bloomberg. Source: J.P. Morgan, Bloomberg. Last Four Weeks’ Additions Company Name Wowprime BBG Ticker 2727 TT Analyst Name Leon Chik Rating UW Add Date 12-Jan-15 Analyst Name Leon Chik, CFA Alex Yao Scott YH Seo Bharat Iyer Alex Yao Alvin Kwock Aditya Srinath, CFA Anne Jirajariyavech, CFA Ebru Sener Kurumlu Rating UW OW OW UW UW OW OW UW OW Removal Date 5-Jan-15 7-Jan-15 7-Jan-15 9-Jan-15 14-Jan-15 19-Jan-15 22-Jan-15 23-Jan-15 27-Jan-15 Add Price 290.50 Current Price 287.00 Price Target 246.00 Removal Date Price 111.2 220.18 117000 375 13.74 79.40 22800.00 28.50 9.91 Price Target 80.00 266.00 168000 325 15.00 105.00 30500 23 12 Source: J.P. Morgan, Bloomberg. Priced at Jan 29, 2015 Last Four Weeks’ Deletions Company Name VTech Holdings Baidu.com Hyundai Department Store Coal India Forgame Holdings Ltd Chroma ATE Indocement Tunggal Prakarsa CH. Karnchang Chow Tai Fook Jewellery Company Ltd. Source: J.P. Morgan, Bloomberg. BBG Ticker 303 HK BIDU US 069960 KS COAL IN 484 HK 2360 TT INTP IJ CK TB 1929 HK Add Price 105.99 249.70 133500 356 16.66 81.40 24200 27 11 Japan stocks are not included at the Country Team level. Japan stocks may continue to appear in Sector Team selections. For details on selection process please see Asia AFL methodology. AFL – Country team stocks All stock and market returns shown in local currency (LC) terms, and reflect performance since date added to the AFL. All aggregates include cumulative returns since inception of the AFL on September 2, 2013. Country AFL total aggregate returns are shown in US$ terms. Aggregate US$ return spread uses the MSCI AC Asia Pacific ex JP Index as the benchmark. Country/Company Name ICICI Bank Aggregate India performance PT Ace Hardware Indonesia, Tbk Aggregate Indonesia performance Tenaga Petronas Chemicals Group Berhad Aggregate Malaysia performance Globe Telecom Aggregate Philippines performance Sheng Siong Group Genting Singapore Aggregate Singapore performance TSMC Formosa Chemicals and Fibre Corp Aggregate Taiwan performance Siam Commercial Bank CH. Karnchang Aggregate Thailand performance Add Price 338 Current Price 380 BBG Ticker Analyst Name ICICIBC IN Seshadri K Sen, CFA Country India Rating1 Add Date OW 14-Nov-14 ACES IJ Indonesia UW 14-Nov-14 795 745 TNB MK Ajay Mirchandani PCHEM MK Samuel Lee, CFA Malaysia Malaysia OW UW 14-Nov-14 14-Nov-14 13.52 5.45 14.56 5.13 GLO PM Princy Singh Philippines UW 14-Nov-14 1690 1740 SSG SP GENS SP Princy Singh Daisy Lu Singapore OW Singapore UW 14-Nov-14 14-Nov-14 0.64 1.05 0.74 1.08 2330 TT 1326 TT Gokul Hariharan Samuel Lee, CFA Taiwan Taiwan OW UW 14-Nov-14 135.00 14-Nov-14 68.50 143.50 69.60 SCB TB CK TB Anne Jirajariyavech, CFA Felicia Tandiyono Thailand Thailand OW 14-Nov-14 186.00 183.00 Princy Singh Asia Pacific ex JP Asia Pacific ex JP Asia Pacific ex JP 1 - Rating and price targets reflect J.P. Morgan's fundamental long-term views. 2 – Spread over MSCI country indices except for Shanghai listed A-Shares which are spread over SHASHR. 3 - Spread over MSCI country index incorporates the impact of currency movements Source: Bloomberg, J.P. Morgan. Priced at Jan 29, 2015 (prices and price-related data based on current day's close) Price Abs. Perf Spread Over Price Target End Since Add MSCI Country Target1 Date Date (%) Index (%)2 440 9/30/15 12.4 7.9 68.3 68.7 520 12/31/15 -6.3 -10.7 28.1 27.6 21.00 2/29/16 7.7 8.9 4.00 12/31/15 -5.9 -4.7 33.4 39.4 1570.00 6/30/15 3.0 -2.6 -1.6 3.7 0.78 12/31/15 14.8 12.5 1.00 12/31/15 2.9 0.5 5.4 3.6 160.00 12/31/15 6.3 1.9 52.00 12/31/15 1.6 -2.8 33.6 34.2 228.00 12/31/15 -1.6 0.1 -28.8 5.7 2.3 3.3 -29.3 5.7 2.4 3.4 AFL – Sector team stocks All returns shown in US$ terms, and reflect performance since date added to the AFL. All aggregates include cumulative returns since inception of the AFL on September 2, 2013. Aggregate US$ return spread uses the MSCI AC Asia Pacific ex JP Index as the benchmark. Company Name Great Wall Motor Company Limited Daihatsu Motor (7262) Aggregate Autos performance PT Ace Hardware Indonesia, Tbk Aggregate Consumer performance Lite-On Technology Corporation Aggregate Emerging Technology performance Bank of China - H AMMB Holdings Aggregate Financials performance Beijing Capital International Airport Daelim Industrial Aggregate Infrastructure performance China Coal Energy - H Aggregate Basic Materials performance Oil and Natural Gas Corporation Aggregate Oil and Gas performance TAL Education Group Wowprime Aggregate SMID-Caps performance Samsung Electronics ASUSTek Computer Aggregate Technology performance Bharti Infratel Ltd. Maxis Berhad Aggregate Telecom performance Air China – H Hanjin Shipping Co Ltd Aggregate Transportation performance Quality Houses Aggregate Real Estate performance Shanghai Electric Group Company Limited Aggregate Utilities & Power Equipment performance Average Sector OW (US$) Average Sector UW (US$) Aggregate Sector Performance Add Current Price Price 36.8 44.0 1609 1584 Abs. Perf Since Add Date (%) 19.6 -2.9 28.5 -9.5 -2.3 -0.3 20.7 13.0 -10.6 48.6 25.3 Sprea d Over MSCI Sector Index (%)2 19.5 -3.1 28.8 -12.4 -2.2 -11.1 21.7 7.4 -16.2 48.8 24.4 53000 12/31/15 -22.0 -22.8 53.0 4.00 12/31/15 -13.8 -18.1 300.00 3/31/16 -10.8 -47.6 38.00 12/31/15 -2.7 246.00 12/31/15 -0.2 42.6 1500000 12/31/15 14.5 275.00 12/31/15 1.5 12.4 330.00 12/31/15 24.6 5.10 12/31/15 -5.1 14.4 8.30 12/31/15 29.6 3800 12/31/15 -2.5 -3.3 4.00 12/31/15 -3.7 52.6 -14.4 -18.3 -6.1 -47.8 0.6 -2.9 42.7 8.0 -5.0 12.7 21.5 -8.2 14.4 21.3 -10.9 -2.9 -10.3 12.7 4.1 12.3 4.6 6.3 4.5 1.5 2.9 6.3 4.5 1.6 3.0 Price Target Price End Target1 Date 50.0 6/30/15 1270 12/31/15 BBG Ticker 2333 HK 7262 JT Analyst Name Nick Lai Akira Kishimoto MSCI Sector Indices Rating1 Autos OW Autos UW Add Date 14-Nov-14 14-Nov-14 ACES IJ Princy Singh Consumer UW 14-Nov-14 795 745 520 12/31/15 2301 TT William Chen Emerging Technology UW 14-Nov-14 38.10 39.00 38.00 6/30/15 3988 HK Katherine Lei Financials AMM MK Harsh Wardhan Modi Financials OW UW 14-Nov-14 14-Nov-14 3.85 6.52 4.35 6.30 4.30 12/31/15 6.00 12/31/15 694 HK Infrastructure and Industrials Infrastructure and Industrials OW 14-Nov-14 6.05 7.58 13.10 12/31/15 UW 14-Nov-14 71200 55300 Metals & Mining UW 14-Nov-14 4.92 4.24 ONGC IN Scott L Darling Oil and Gas UW 14-Nov-14 393.25 351.90 XRS US 2727 TT SMID-Caps SMID-Caps OW UW 14-Nov-14 12-Jan-15 32.06 290.50 31.18 287.00 005930 KS JJ Park 2357 TT Gokul Hariharan Technology Technology OW UW 14-Nov-14 1194000 1360000 14-Nov-14 321.00 334.50 BHIN IN Viju K George MAXIS MK Princy Singh Telecommunications Telecommunications OW UW 14-Nov-14 14-Nov-14 298.95 6.92 373.60 7.10 753 HK Corrine Png 117930 KS Corrine Png Transportation Transportation OW UW 14-Nov-14 14-Nov-14 5.47 6020 7.09 5840 Karen Li, CFA 000210 KS Sokje Lee 1898 HK Daniel Kang Leon Chik, CFA Andre Chang, CFA QH TB Anne Jirajariyavech, Real Estate CFA UW 14-Nov-14 4.10 3.94 2727 HK Boris Kan UW 14-Nov-14 4.65 4.84 Utilities & Power Equipment 2.80 6/30/15 1 - Rating and price targets reflect J.P. Morgan's fundamental long-term views. 2 – Spread over MSCI sector indices except for Shanghai listed A-Shares which are spread over SHASHR. Source: Bloomberg, J.P. Morgan. Priced at Jan 28, 2015 (prices and price-related data based on previous day's close) J.P Morgan’s Asia Analyst Focus List (AFL) is a selection of high-conviction stocks collaboratively chosen by each Country and Sector research team across Asia-Pacific. The AFL includes Overweight- and Underweight-rated stocks, Overweight having superior outperformance prospects in a team’s universe over the horizon of rating (6-12 months), and Underweight stocks having among the poorer relative performance prospects over the horizon of rating (6-12 months). The aim is to have one Overweight and one Underweight idea from each Research team in the AFL. Analysts can add or delete recommendations at any time and changes will be published, with the analyst’s rationale, on J.P. Morgan Markets. Please check J.P. Morgan Markets https://www.jpmorganmarkets.com for the most up-to- date AFL at any time, or contact your J.P. Morgan representative. The Analyst Focus List is not a model portfolio. Please refer to specific company research for the fundamental investment thesis for each stock included in this list as well as the analysts’ complete views. If a stock is placed under research restriction, J.P. Morgan may remove the stock from the AFL pursuant to applicable law and/or J.P. Morgan policy without any further notice. Important disclosures, including price charts for all companies under coverage for at least one year, are available through the search function on J.P. Morgan's website https://jpmm.com/research/disclosures. Total returns exclude commissions. Past results are not indicative of future performance. Additional information available upon request. Japanese stocks included in the Asia AFL are chosen according to the Asia AFL methodology above, independent of the Japanese Analyst Focus List (Japan AFL). Japan stocks are not included at the Country Team level, but may appear in Sector Team selections. To view the Japan AFL and its methodology, click here: Japan Analyst Focus List (Japan AFL) Asia Pacific Equity Research 30 January 2015 Samsung Electronics Watch GS6 and System LSI: Expect the stock to break-through its historical high Despite macro headwinds, all the divisions (except CE) fared better than our expectations, and notably smartphone performance surprised on the upside on the back of ASP hike thanks to increased sales of high-end products and efficient expense management. SEC boosted its year-end dividend to W19,500/share which implies its shareholder return reaches to W5.4 trillion including share buyback and interim dividend. GS6 and System LSI are two key points to watch: We expect GS6 sellthrough to be much better than market expectations given lack of new products from other handset vendors and full model changes at H/W in the last two years. In addition, SEC will significantly increase its internal AP and modem solutions, which we think will help a turnaround in System LSI business. Of note, System LSI will be the single largest OP improvement in 2015. Refer to Figure 7 & 8 on page 14 for details. Sensitivity analysis to GS6 shipments: Our base case (50 million units) suggests that GS6 will account for 55% of IM OP and 24% of total OP in 2015. If SEC could ship 60 million units, we estimate this would add W3 trillion OP and generate additional profit in relevant components. In this scenario, we think IM division could see Y/Y earnings growth vis-à-vis our current forecast of a 16% decline in IM division OP in 2015. Ongoing market share gain in memory operation: With Line 17 ramps along with tech migration, we expect SEC to meaningfully outgrow overall DRAM industry again. As a first mover in 3D NAND (V-NAND), SEC should gain share in NAND market as well. Hence, memory division should continue to generate sustainable earnings and support earnings growth even in worst case scenario for smartphone business. Overweight 005930.KS, 005930 KS Price: W1,360,000 ▲ Price Target: W1,700,000 Previous: W1,500,000 South Korea Technology - Semiconductors JJ Park AC (822) 758-5717 [email protected] Bloomberg JPMA PARK <GO> J.P. Morgan Securities (Far East) Ltd, Seoul Branch Jay Kwon (82-2) 758-5725 [email protected] J.P. Morgan Securities (Far East) Ltd, Seoul Branch Varun Rajwanshi (91-22) 6157-3277 [email protected] J.P. Morgan India Private Limited Price Performance 1,450,000 1,350,000 W 1,250,000 1,150,000 1,050,000 Jan-14 Apr-14 Jul-14 Oct-14 Jan-15 005930.KS share price (W) KOSPI (rebased) Abs Rel YTD 2.5% 0.7% 1m 2.3% 1.1% 3m 20.4% 20.9% 12m 6.2% 5.7% Street-high earnings estimates and PT: With meaningful upward revisions to our earnings estimates, we raise our Dec.-15 PT to W1.7 million from previous W1.5 million. We believe GS6 and a turnaround in System LSI will be key drivers for the share price. Bloomberg 005930 KS, Reuters 005930.KS (YE Dec, W bn) FY13 FY14 FY15E FY16E FY13 FY14 FY15E FY16E Date of Price 29 Jan 15 Sales 228,693 206,206 224,589 239,907 Sales growth 13.7% (9.8%) 8.9% 6.8% 52-Week range W$1,495,000-1,078,000 Operating Profit 36,785 25,027 28,351 30,631 OP growth 26.6% (32.0%) 13.3% 8.0% Market Cap W200,327BN EBITDA 53,230 43,156 47,936 51,738 NP growth 28.6% NM 7.1% 8.5% Market Cap US$184,728MN Net profit 29,821 23,054 24,696 26,799 Quarterly EPS (W) 1Q 2Q 3Q 4Q Share Out. (Com) 147MN EPS 202,453 156,515 169,274 183,996 EPS (14) 50,813 41,932 28,055 35,716 Free float 72.5% BPS (W) 1,018,443 1,126,312 1,284,856 1,444,795 EPS (15) E 33,389 44,581 47,369 43,995 Avg daily val W335.0B P/E (x) 6.7 8.7 8.0 7.4 EPS (16) E 38,727 46,551 51,560 47,158 Avg daily val (US$) 308.9MM P/BV (x) 1.3 1.2 1.1 0.9 Price Target 1,700,000 Avg daily vol. 0.3MM shares ROE (%) 22.0 14.6 14.0 13.5 Consensus PT 1,521,934 Dividend yield (%) 1.8 Net Debt -43,335 -52,818 -66,120 -67,001 Difference (%) 11.7 Exchange Rate 1,084.45 Price Target End Date 31-Dec-15 Source: Company data, Bloomberg, J.P. Morgan estimates. See page 24 for analyst certification and important disclosures, including non-US analyst disclosures. J.P. Morgan does and seeks to do business with companies covered in its research reports. As a result, investors should be aware that the firm may have a conflict of interest that could affect the objectivity of this report. Investors should consider this report as only a single factor in making their investment decision. www.jpmorganmarkets.com Asia Pacific Equity Research 29 January 2015 Overweight China Everbright International 0257.HK, 257 HK Price: HK$11.46 Water M&A is the key catalyst in 2015 Price Target: HK$13.00 China Everbright Int'l is likely looking for water acquisition targets, in our view, after its water subsidiary announced a share placement last week. We see potential 10% upside to CEI’s earnings if Everbright Water geared up its balance sheet for M&A. Water acquisitions will likely be the key catalyst for CEI in 2015 as we believe awards of new waste-to-energy projects will slow this year after a record year in 2014. Maintain OW ahead of results announcement and potential acquisitions. Water M&A likely after CEW’s placement: China Everbright Water (CEWL SP, not covered) has said it plans to raise US$85MM from issuing 4.8% of new shares in a private placement at SGD0.94 per share. After the placement, CEW’s net gearing will decline to 8% from 20% and CEI’s shareholding in CEW will decline to 74% from 78%, on our estimates. The strong balance sheet will allow CEW to add >1.5MM tons (or 40%) of new sewage capacity, on our estimates, resulting in potential 10% EPS upside for CEI. See our scenario analysis on page 4. 2015 will likely be a slower WTE project win year: Typically, local governments do not award many new waste-to-energy projects in the last year of a Five Year Plan because it’s too late for them to meet the year-end target. In 2010, for example, CEI only won one WTE project. We believe 2015 will be a similar case. (YTD, CEI has won a 600-ton WTE project in Sichuan). We assume CEI will add ~3,000 tons of new WTE capacity this year, vs a record ~12,000 tons in 2014. China Utilities Elaine Wu AC (852) 2800-8575 [email protected] Bloomberg JPMA EWU <GO> Boris Kan (852) 2800-8573 [email protected] J.P. Morgan Securities (Asia Pacific) Limited Price Performance 12.5 11.5 HK$ 10.5 9.5 8.5 Jan-14 Apr-14 Jul-14 Oct-14 Jan-15 0257.HK share price (HK$) HSCEI (rebased) Abs Rel YTD -0.9% 1.4% 1m 2.0% -1.5% 3m 5.9% -7.5% 12m 16.1% -6.4% FY14 results to be inline: We expect CEI to report inline results on 31 March. Consensus is estimating 2014 EPS of 41 HK cents, which implies a 25% yoy growth. At the results announcement, we will look for management’s guidance on capex and capacity growth. Maintain OW. CEI is transforming into a diverse environmental play with a listed subsidiary in water operations. Future spinoffs of other assets may be possible when other segments scale up, in our view. China Everbright International (Reuters: 0257.HK, Bloomberg: 257 HK) HK$ in mn, year-end Dec FY12A FY13A FY14E FY15E Revenue (HK$ mn) 3,410 5,320 7,180 9,830 Net Profit (HK$ mn) 881 1,325 1,874 2,561 EPS (HK$) 0.23 0.33 0.42 0.57 DPS (HK$) 0.06 0.09 0.12 0.16 Revenue growth (%) (2.2%) 56.0% 35.0% 36.9% EPS growth (%) 15.7% 40.1% 28.2% 36.6% ROCE 8.9% 9.2% 9.8% 11.6% ROE 12.3% 12.2% 13.3% 16.4% P/E (x) 49.3 35.2 27.4 20.1 P/BV (x) 5.2 3.5 3.5 3.1 EV/EBITDA (x) 23.2 15.5 12.3 9.8 Dividend Yield 0.6% 0.8% 1.0% 1.4% FY16E 11,066 3,100 0.69 0.19 12.6% 21.1% 12.0% 17.5% 16.6 2.7 8.8 1.7% Company Data Shares O/S (mn) Market Cap (HK$ mn) Market Cap ($ mn) Price (HK$) Date Of Price Free Float(%) 3M - Avg daily vol (mn) 3M - Avg daily val (HK$ mn) 3M - Avg daily val ($ mn) HSCEI Exchange Rate Price Target End Date 4,484 51,383 6,628 11.46 28 Jan 15 50.0% 7.86 89.28 11.5 1,2030.38 7.75 30-Jun-15 Source: Company data, Bloomberg, J.P. Morgan estimates. See page 10 for analyst certification and important disclosures, including non-US analyst disclosures. J.P. Morgan does and seeks to do business with companies covered in its research reports. As a result, investors should be aware that the firm may have a conflict of interest that could affect the objectivity of this report. Investors should consider this report as only a single factor in making their investment decision. www.jpmorganmarkets.com Asia Pacific Equity Research 29 January 2015 Indonesia 101 EM 101 Equity Investors' Guide to ASEAN's Largest Economy Head of ASEAN Strategy & Indonesian Research Banda Aceh Aditya Srinath, CFA Aceh Medan KALIMANTAN North Sumatera Riau Pekanbaru Padang West Sumatera SUMATERA Riau Islands Tanjungpinang North Sulawesi Manado Gorontalo East Kalimantan Pontianak West Kalimantan Jambi Tanjung Selor North Kalimantan Bangka Jambi Belitung Islands Pangkalpinang Palembang Bengkulu Bengkulu South Sumatera DKI Jakarta Lampung Jakarta Bandar Lampung Serang Banten Central Kalimantan West Palu Sulawesi Central Sulawesi Mamuju Banjarmasin South Sulawesi South Kalimantan Central Java Ujungpandang Bloomberg JPMA SRINATH <GO> Sofifi Samarinda Palangkaraya (62-21) 5291-8573 [email protected] North Maluku Gorontalo Manokwari MALUKU Maluku Kendari Southeast Sulawesi Ambon West Papua PT J.P. Morgan Securities Indonesia PAPUA Jayapura Papua SULAWESI Semarang Surabaya JAVA Bali Mataram Denpasar Bandung East Nusa Tenggara West Nusa Tenggara Kupang BALI & NUSA TENGGARA Yogyakarta D.I. Yogyakarta (62-21) 5291-8575 [email protected] PT J.P. Morgan Securities Indonesia Emerging Markets Equity Strategy AC (852) 2800-8599 [email protected] Bloomberg JPMA MOWAT <GO> J.P. Morgan Securities (Asia Pacific) Limited Rajiv Batra AC (91-22) 6157-3568 [email protected] Legend ISLAND NAMES Province names Province capital cities West Regions Central Regions East Regions Indra Cahya Adrian Mowat West Java East Java AC Bloomberg JPMA BATRA <GO> J.P. Morgan India Private Limited Kevyn H Kadakia (91-22) 6157-3250 [email protected] : High equity returns: 16% 10-year USD CAGR (20% Rp) High economic growth: 6%oya 10 year average GDP growth Jokowi (President) / Jusuf Kalla (VP): 2014 to 2019 term Fourth most populous country in the world: 249 million Third-largest democracy: 190 million voters Jakarta is the world’s second-largest conurbation after Tokyo – c.27 million Sixteenth-largest economy (GDP US$900billion) – member of G20 GDP has now grown by over 4%oya for 50 consecutive quarters since 1QFY02 Rapid growth in working age population; 16% or 30million by 2030. Resource-rich (crude oil, gas, coal, tin, nickel, copper, gold and bauxite) Second highest level of biodiversity (Conservation International) The largest Muslim population, 300 distinctive ethnic groups, official language is Bahasa Indonesia but has 742 different languages and dialects Source: CIA World Fact Book, UNICEF, OECD, Conservation International, J.P. Morgan J.P. Morgan India Private Limited Sudarshan Ravi (91-22) 6157-3276 [email protected] J.P. Morgan India Private Limited Indonesia Economist Sin Beng Ong (65) 6882-1623 [email protected] JPMorgan Chase Bank, N.A., Singapore Branch FY15e population (million) 145.14 55.27 18.72 15.34 FY13 GDP/capita (IDR ‘000) 30,762 36,133 21,043 38,750 Islands Java Sumatera Sulawesi Kalimantan Bali and Nusa 14.11 17,965 Tenggara Papua 4.02 7,644 Maluku 2.85 36,927 Source: Central Bureau of Statistics See page 53 for analyst certification and important disclosures, including non-US analyst disclosures. J.P. Morgan does and seeks to do business with companies covered in its research reports. As a result, investors should be aware that the firm may have a conflict of interest that could affect the objectivity of this report. Investors should consider this report as only a single factor in making their investment decision. www.jpmorganmarkets.com Asia Pacific Equity Research 29 January 2015 Initiation Overweight Taiwan Paiho Limited 9938.TW, 9938 TT Price: NT$49.70 Hidden champion of sports-leisure growth; initiate at OW with PT of NT$65 Price Target: NT$65.00 We initiate coverage on Taiwan Paiho (Paiho) with an OW rating and a Dec15 PT of NT$65, implying 31% potential upside. Paiho is the largest touchfastener ODM manufacturer in the world, and also a leading producer of shoelaces/webbings, supplying all the major sportswear brands and their OEM/ODM producers. Trading at 13x 2015E P/E with a 20% EPS CAGR in 2014-16E, and a 3-4% dividend yield, the stock looks undervalued vs. other Taiwan sportswear stocks (17x-23x P/E). Paiho is also a beneficiary of US dollar strength, lower petrochemical prices, and the potential of Vietnam entering TPP. The stock has risen over 20% in a month (vs. Taiex +3%) on management’s positive guidance and sportswear peers’ re-rating, so there is risk of a pullback during the seasonally weak 1Q15; we recommend buying on any weakness. Discounted valuation vs peers should be reversed. Our Dec-15 PT of NT$65 is based on 17x 2015E P/E, slightly above the high end of its five-year trading range but at the low end of other major Taiwan sportswear stocks’ range. Paiho’s growth is in line with many peers’, while profitability (gross margin of 34%-35% and OP margin of 17%-19% in 2014-16E) is the highest. We believe its valuation discount to peers is due to its smaller market cap and failure in new businesses. But as bigger peers’ valuations have become stretched and Paiho has re-focused on its core businesses, we believe Paiho will re-rate. Stable growth from global sportswear demand with upside from new products. We forecast Paiho’s sales to grow by 15%/14% in 2015/2016, due to the solid 2015 sales outlook of major global sportswear brands such as Nike (+11%), Addidas (+6%), and UnderArmour (+28%). Yet Paiho may surprise the market if its new products – one-piece and four-way stretchable materials for shoes – outpace our forecast of only 3% of total sales in 2015E. Taiwan Consumer, Cyclical and Property Andre Chang, CFA AC (886-2) 2725-9872 [email protected] J.P. Morgan Securities (Taiwan) Limited Alvin Kwock (852) 2800-8533 [email protected] J.P. Morgan Securities (Asia Pacific) Limited Leon Chik, CFA (852) 2800-8590 [email protected] J.P. Morgan Securities (Asia Pacific) Limited Price Performance 50 45 NT$ 40 35 30 Feb-14 May-14 Aug-14 Nov-14 9938.TW share price (NT$) TSE (rebased) Abs Rel YTD 16.1% 13.9% 1m 20.0% 17.6% 3m 19.9% 11.5% 12m 58.8% 43.7% Sustainable, strong profitability in a seemingly mature sector. Even though many people view the sports accessory market as mature and competitive, Paiho has continued to invest 2.5% of its revenue in R&D p.a. to develop new products with better profitability (e.g. molded hooks instead of touch-fasteners). It has also cut back on 3C sales with less than a 20% gross margin so it can refocus on the more profitable core products. We forecast its gross margin to expand from 30.8% in 2013 to 33.7%/34.3%/35.2% in 2014/15/16. Taiwan Paiho Limited (Reuters: 9938.TW, Bloomberg: 9938 TT) NT$ in mn, year-end Dec FY12A FY13A FY14E Revenue (NT$ mn) 6,981 8,107 9,106 Net Profit (NT$ mn) 454 705 945 EPS (NT$) 1.58 2.37 3.17 DPS (NT$) 1.00 1.50 1.59 Revenue growth (%) (14.4%) 16.1% 12.3% EPS growth (%) (20.6%) 49.7% 34.0% ROCE 5.8% 8.1% 10.3% ROE 6.8% 10.2% 12.1% P/E (x) 31.4 21.0 15.7 P/BV (x) 2.3 2.1 1.8 EV/EBITDA (x) 4.1 6.2 5.6 Dividend Yield 2.0% 3.0% 3.2% FY15E 10,470 1,131 3.80 1.90 15.0% 19.7% 11.2% 12.9% 13.1 1.6 5.3 3.8% FY16E 11,884 1,350 4.53 2.26 13.5% 19.3% 12.5% 14.2% 11.0 1.5 4.4 4.6% Company Data Shares O/S (mn) Market Cap (NT$ mn) Market Cap ($ mn) Price (NT$) Date Of Price Free Float(%) 3M - Avg daily vol (mn) 3M - Avg daily val (NT$ mn) 3M - Avg daily val ($ mn) TSE Exchange Rate Price Target End Date 298 14,811 473 49.70 28 Jan 15 2.83 124.20 4.0 9510.92 31.29 31-Dec-15 Source: Company data, Bloomberg, J.P. Morgan estimates. See page 25 for analyst certification and important disclosures, including non-US analyst disclosures. J.P. Morgan does and seeks to do business with companies covered in its research reports. As a result, investors should be aware that the firm may have a conflict of interest that could affect the objectivity of this report. Investors should consider this report as only a single factor in making their investment decision. www.jpmorganmarkets.com Asia Pacific Equity Research 29 January 2015 Overweight TSC Auto ID Technology 3611.TW, 3611 TT Price: NT$257.50 Geared for market share gain; raise PT to NT$370 ▲ Price Target: NT$370.00 Previous: NT$340.00 TSC is the No.6 barcode printer maker globally, competing with Zebra and Sato. We expect the upcoming market reshuffle to benefit Taiwan plays (as we have seen before). We expect TSC to deliver 20% Y/Y earnings growth in 2015-16 on market share gain and better product mix. TSC is now trading at 14x 1-year forward PER, with ROE of 33-34% and dividend yield of 4%+. Our new PT of NT$370 implies 40% potential upside. Huge market reshuffle: Honeywell Scanning & Mobility (HSM) will close its acquisition of Datamax-O'Neil this quarter. After the acquisition, Honeywell will become second largest player in the global barcode printer market with around 11% market share, next only to Zebra (32%) (Fig 2). There was another big industry structure change in 2014 after Zebra’s acquisition of Motorola Solutions. Competition between Zebra and Honeywell could be worth watching, as they are now the top two in the ADC (automated data capture) market with comprehensive data input and output solutions (Table 2). We expect SATO and Toshiba TEC to face more pressure than smaller peers, given highly overlapping markets and lack of end-to-end products. We see upside to Taiwanese players: Barcode printing has been a highly fragmented market. It is easier for late-comers to penetrate into the existing supply chain if there is any change. Therefore, HMS’s two acquisitions are likely to add 10% addressable market to TSC/Godex. Notably, TSC market share grew to ~5% in 2014 from ~3% in 2011, when Sato acquired Taiwanbased Argox to expand its mid- to low-end product lines. In addition, an increasing outsourcing portion from tier one plays such as Toshiba TEC could also add upside. Taiwan Technology - Hardware William Chen AC (886-2) 2725-9871 [email protected] Bloomberg JPMA WCHEN <GO> J.P. Morgan Securities (Taiwan) Limited James Wang AC (886-2) 2725-9875 [email protected] J.P. Morgan Securities (Taiwan) Limited Alvin Kwock (852) 2800-8533 [email protected] J.P. Morgan Securities (Asia Pacific) Limited Price Performance 300 NT$ 260 220 180 Feb-14 May-14 Aug-14 Nov-14 3611.TW share price (NT$) TSE (rebased) Abs Rel YTD -0.2% -1.8% 1m 1.0% -0.5% 3m 19.5% 13.6% 12m 8.0% -6.1% Revising up earnings forecast and PT to NT$370: We revised up 2015/16 earnings by 4/8% respectively to factor in market share gain and better operating leverage. We expect TSC to report strong 4Q14 results with robust top-line momentum (up 28% Y/Y and beat JPMe by 13%) and decent margin (partially thanks to favorable forex trend). We believe 1Q15 sales will retain double digit Y/Y growth thanks to TSC’s push into new markets (SE Asia, SE China, India etc). Bloomberg 3611 TT, Reuters 3611.TW (Year-end Dec, NT$ mn) Sales Operating Profit EBITDA Pretax Profit Adj. Net Profit (New TW GAAP) New TW GAAP EPS (NT$) Net Debt / Equity Y/E BPS (NT$) FY13 FY14E FY15E FY16E 2,104 2,441 2,831 3,173 New TW GAAP P/E 549 637 762 888 P/BV (x) 583 671 796 921 ROE(%) 586 645 766 896 Cash Div (NT$) 446 491 585 690 Quarterly EPS (NT$) 12.94 14.25 16.97 20.02 EPS (13) (49.5%) (43.6%) (50.2%) (56.4%) EPS (14) E 40.34 46.20 52.91 60.71 EPS (15) E FY13 FY14E FY15E FY16E Target Price (NT$) 19.7 18.1 15.2 12.9 Price Target End Date 6.4 5.6 4.9 4.2 Share Outstanding 35.7 32.9 34.3 35.2 Free float 6.4 9.3 10.3 12.2 Avg daily volume 1Q 2Q 3Q 4Q Avg daily val (USD) 3.37 3.46 3.42 2.80 Dividend Yield (2014) 3.29 3.56 3.60 3.80 QFII Holding (%) 3.55 4.34 4.59 4.50 Market Cap(USD) 370 30-Jun-15 34mn 25.0% 0.11mn 0.9mn 3.6% 281mn Source: Company data, Bloomberg, J. P. Morgan estimates. Note: In Net Debt/Equity, NM means company has net cash See page 9 for analyst certification and important disclosures, including non-US analyst disclosures. J.P. Morgan does and seeks to do business with companies covered in its research reports. As a result, investors should be aware that the firm may have a conflict of interest that could affect the objectivity of this report. Investors should consider this report as only a single factor in making their investment decision. www.jpmorganmarkets.com Asia Pacific Equity Research 30 January 2015 ▼ Neutral Pidilite Industries Previous: Overweight Growth remains slow, and crude fall benefit priced in; downgrade to Neutral Price: Rs575.90 PIDI.NS, PIDI IN ▲ Price Target: Rs550.00 Previous: Rs440.00 PIDI’s 3Q EPS of Rs2.4 (+28% Y/Y) was below estimates primarily due to lowerthan-expected revenues. Volume growth of 8% Y/Y in 3Q was the lowest in recent history, pointing to a sluggish demand environment. Comments from other building product companies corroborate this view. Margin tailwinds exist, though, given the sharp fall in crude price. However, we think the extent of the benefit from this will be lower than what the market seems to be pricing in (the stock has risen 60% in the past six months vs. the Sensex’s +14%). We factor in the benefit of lower RM prices and raise our earnings estimates by 14-16% for FY16/17. While we see PIDI as a high-quality company with monopolistic market share in its consumer business, valuations at 38x FY16E P/E look demanding but the scope for earnings disappointment looks limited. Downgrade to Neutral with a new Mar-16 PT of Rs550. Demand recovery likely to take some time: PIDI’s volume growth disappointed at 8% Y/Y in the Dec-Q (revenue growth was 12% Y/Y). This is not at odds with the experience of other building product companies, which have also pointed to weak demand trends in 3Q and a cautious outlook in the near term. We think an improved macro sentiment is yet to translate into increased spending and a demand recovery. We model revenue growth of 1517% in FY16/17 (9M FY15: 15%) factoring in some improvement in consumer demand and pick-up in industrial activity from 2H FY16 onwards. Any meaningful price cuts on the back of RM deflation, however, pose a risk to our revenue growth forecasts. Margin expansion to follow with a lag: Over 50% of PIDI’s RMs are crude oil derivatives, but price declines in these RMs (due to the fall in crude prices) come with a lag and do not mirror the crude oil price fall given their respective demand-supply dynamics. PIDI’s RM basket has seen a much lower correction than has crude. Its key RM VAM has fallen by 25% from the peak last year and the price outlook is stable. We expect the benefit of favorable input costs to flow through in FY16/17 (350-400bp GM expansion). The 3Q gross margin fell 70bp Y/Y on high-cost VAM inventory which will last until February. India Building Materials Gunjan Prithyani AC (91-22) 6157-3593 [email protected] Bloomberg JPMA PRITHYANI <GO> J.P. Morgan India Private Limited Saurabh Kumar (91-22) 6157-3590 [email protected] J.P. Morgan India Private Limited Leon Chik, CFA (852) 2800-8590 [email protected] J.P. Morgan Securities (Asia Pacific) Limited Price Performance 550 Rs 450 350 250 Jan-14 Apr-14 Jul-14 Oct-14 Jan-15 PIDI.NS share price (Rs) NIFTY (rebased) Abs YTD 4.9% 1m 10.6% 3m 39.4% Rel -3.2% 2.0% 28.7% 12m 101.9 % 55.6% Valuations: PIDI trades at 38x FY16E P/E, 2SD above the mean of the last three years, despite growth moderation in the last two years. While valuations have moved up across the entire building product space, PIDI’s looks expensive. Pidilite Industries (Reuters: PIDI.NS, Bloomberg: PIDI IN) Rs in mn, year-end Mar FY13A FY14A FY15E Revenue (Rs mn) 36,579 42,606 49,007 Revenue growth (%) 17.6% 16.5% 15.0% EBITDA (Rs mn) 5,933 6,715 8,322 EBITDA Margin 16.2% 15.8% 17.0% Net Profit (Rs mn) 4,223 4,563 5,519 EPS (Rs) 8.24 8.90 10.77 DPS (Rs) 2.60 2.70 3.77 P/E(x) 69.9 64.7 53.5 EV/EBITDA (x) 33.6 29.5 23.6 Source: Company data, Bloomberg, J.P. Morgan estimates. FY16E 56,382 15.0% 11,554 20.5% 7,804 15.22 5.33 37.8 16.8 FY17E 65,639 16.4% 13,805 21.0% 9,320 18.18 6.36 31.7 13.8 Company Data Shares O/S (mn) Market Cap (Rs mn) Market Cap ($ mn) Price (Rs) Date Of Price 3M - Avg daily vol (mn) 3M - Avg daily val (Rs mn) 3M - Avg daily val ($ mn) NIFTY Exchange Rate Price Target End Date 508 292,355 4,761 575.90 29 Jan 15 0.53 263.58 4.3 8952.35 61.40 31-Mar-16 See page 9 for analyst certification and important disclosures, including non-US analyst disclosures. J.P. Morgan does and seeks to do business with companies covered in its research reports. As a result, investors should be aware that the firm may have a conflict of interest that could affect the objectivity of this report. Investors should consider this report as only a single factor in making their investment decision. www.jpmorganmarkets.com Asia Pacific Equity Research 29 January 2015 Underweight Adani Power ADAN.BO, ADANI IN Price: Rs51.60 Not out of the woods yet: Maintain UW ▼ Price Target: Rs40.00 Previous: Rs46.00 Adani Power reported a December quarter net loss of Rs4.3bn in its maiden quarter of operations at rated capacity of 9.24GW, at a reasonably high PLF of 79%. This was after the company accounted for Rs5.7bn of compensatory tariffs (CT) across its projects during the quarter. Aggregate CT of Rs36.5bn has been booked in the P&L so far and is a growing receivable in the balance sheet with no cash receipt. CT is ~70% of company's current net worth. In our calculations, FY16 operating cash flow will prove insufficient to cover interest and debt repayment liability unless fresh CT bookings are backed by cash receipts, a partial liquidation of past CT happens and/or the debt repayment schedule is pushed back. Hearings on the CT matter in APTEL for the Mundra project are currently suspended, creating uncertainty around the timeline for resolution of the legal hurdle. The stock has underperformed Sensex by 23% over the last six months. We maintain our UW with a Mar-16 PT of Rs40 (Rs46 earlier). Talking numbers. We arrive at EBITDA of Rs67.5bn in FY16, +12% YoY (including CT), after assuming a 10% YoY increase in net generation and 11% lower fuel cost/kWh and factoring in a sale of the transmission business to the parent by end-FY15. After factoring in interest cost of Rs49bn (down 9% YoY) and assuming EBITDA equals cash, the company would be left with ~Rs19bn to meet debt repayment liabilities on gross debt of ~Rs440bn (as of Mar-15). This is insufficient if one assumes a debt repayment tenure of 12 years (implying Rs37bn in repayments/year). We estimate an out-of-consensus net loss of Rs8.2bn in FY16 (consensus +Rs0.4bn), an improvement over FY15 (loss estimate of Rs20.2bn), but a reduction in the interest burden is a precondition to generating meaningful positive RoE. Breakdown of aggregate CT of Rs36.5bn. (a) Rs25bn pertaining to Mundra, the Supreme Court is to judge whether the matter can be pursued under the “change of law” and force majeure clauses; meanwhile, hearings in APTEL are suspended; (b) Rs5.4bn pertaining to two units of Tiroda (1320MW) affected by the non-availability of coal from the Lohara block; matter against Maharashtra SEB in APTEL; and (c) Rs4.5bn CT due to a domestic coal shortage pursuant to MERC/RERC orders. Upside risks. Even lower landed coal cost, INR appreciation, lower interest cost sensitivities to risks discussed inside the report. Adani Power (Reuters: ADAN.BO, Bloomberg: ADANI IN) Rs in mn, year-end Mar FY13A FY14A FY15E Revenue (Rs mn) 67,794 149,383 199,282 Revenue growth (%) 65.8% 120.4% 33.4% Adjusted Profit (Rs mn) (21,542) (18,617) (20,156) Adjusted profit growth (%) 2230.8% (13.6%) 8.3% Adjusted EPS (Rs) (9.42) (7.07) (7.02) BV per share (Rs) 17.94 22.78 16.39 ROE (41.7%) (34.4%) (35.8%) Adjusted P/E NM NM NM P/BV (x) 2.9 2.3 3.1 EV/EBITDA (x) 50.9 13.9 9.4 Source: Company data, Bloomberg, J.P. Morgan estimates. FY16E 204,085 2.4% (8,169) (59.5%) (2.84) 13.54 (19.0%) NM 3.8 7.9 FY17E 205,674 0.8% 691 (108.5%) 0.24 13.78 1.8% 214.6 3.7 6.9 India Electric Utilities Sumit Kishore AC (91-22) 6157-3581 [email protected] Bloomberg JPMA KISHORE <GO> J.P. Morgan India Private Limited Deepika Mundra (91-22) 6157-3582 [email protected] J.P. Morgan India Private Limited Boris Kan (852) 2800-8573 [email protected] J.P. Morgan Securities (Asia Pacific) Limited Price Performance 70 60 Rs 50 40 30 Jan-14 Apr-14 Jul-14 Oct-14 Jan-15 ADAN.BO share price (Rs) BSE30 (rebased) Abs Rel YTD 16.7% 8.8% 1m 19.9% 11.6% Company Data Shares O/S (mn) Market Cap (Rs mn) Market Cap ($ mn) Price (Rs) Date Of Price Free Float(%) 3M - Avg daily vol (mn) 3M - Avg daily val (Rs mn) 3M - Avg daily val ($ mn) BSE30 Exchange Rate Price Target End Date 3m 12.1% 2.6% 12m 55.9% 12.1% 2,872 148,191 2,413 51.60 29 Jan 15 30.0% 4.83 221.76 3.6 2,9559.18 61.40 31-Mar-16 See page 9 for analyst certification and important disclosures, including non-US analyst disclosures. J.P. Morgan does and seeks to do business with companies covered in its research reports. As a result, investors should be aware that the firm may have a conflict of interest that could affect the objectivity of this report. Investors should consider this report as only a single factor in making their investment decision. www.jpmorganmarkets.com Asia Pacific Equity Research 29 January 2015 Underweight AU Optronics 2409.TW, 2409 TT Price: NT$18.20 Confirmation of another capacity expansion plan; Reiterate UW Price Target: NT$13.0 As we previewed on January 23, 2015, AUO rendered solid 4Q14 GP/OP capturing consensus estimates, thanks to the strong TV panel pricing trend and FX impact. Nevertheless, excluding the F/X factor, gross profit would have been down Q/Q due to weak NB/tablet panel prices and lower UTR. NP was also weaker than expected (first negative surprise since 1Q14) due to higher tax expense associated with subsidiary investments. 1Q15 guidance appears mixed. Contrary to LGD, AUO raised 2015/2016 capex meaningfully (more than doubled) and plans to expand capacity at its Gen 8 fabs. We believe OPM already peaked out in 4Q14; revenue/EBITDA will decline in 2015. Reiterate UW. 1Q15 guidance is mixed: AUO guided for large panel ASP to stay flat due to product mix but expects shipment to decline by 5-15% Q/Q, this decline appears larger than expected. On the other hand, S&M panel shipment will decline by 5-10% Q/Q, which is slightly better than expected. Although the market is generally positive about the “balanced” supply/demand in 2015, the launch of three Gen 8 fabs from China in 2Q15 will make it difficult to raise panel prices like 2014, in our view. New capacity at Gen 8: Following the Gen 6 expansion, AUO announced to raise Gen 8 capacity by 25K-30K/month at Gen 8 fabs in Houli, Taiwan. Full-ramp is scheduled to be completed by 2Q16. AUO’s total capacity will grow by 5% by 2016. Annual capex will rise substantially from NT$17bn in 2014 to NT$40bn in 2015 and 2016 each. The capacity expansion might add NT$6-7bn depreciation expense annually starting from 2016, by our calculations. Maintain UW: We lower our earnings estimates to reflect the slightly weaker than expected 1Q15 shipment guidance, and our revised forecasts still point to a Y/Y decline in revenue/EBITDA. OPM peaked in 4Q14, by our estimate. We maintain our Dec-15 price target at NT$13, based on 0.6x 2015E P/BV (one standard deviation below mid-cycle P/B). We recommend investors sell into strength ahead of 2Q15. Taiwan Technology - Semiconductors Narci Chang AC (886-2) 2725-9899 [email protected] Bloomberg JPMA NCHANG <GO> J.P. Morgan Securities (Taiwan) Limited Price Performance 20 16 NT$ 12 8 Feb-14 May-14 Aug-14 Nov-14 2409.TW share price (NT$) TSE (rebased) Abs YTD 12.3% 1m 10.3% 3m 37.9% Rel 10.1% 7.9% 29.5% 12m 106.8 % 91.7% Bloomberg 2409 TT, Reuters 2409.TW (Year-end Dec, NT$ bn) Sales Operating Profit EBITDA Net profit EPS BPS (NT$) P/E (x) P/BV (x) ROE (%) Net Debt FY13 FY14E FY15E FY16E 416.4 408.2 405.3 351.6 Sales growth 8.3 22.2 25.8 12.5 OP growth 71.1 78.4 75.8 55.0 NP growth 4.2 17.6 20.5 9.4 Quarterly EPS (NT$) 0.4 1.8 2.1 1.0 EPS (13) 17.1 18.8 20.1 20.3 EPS (14) E 40.7 9.9 8.6 18.6 EPS (15) E 1.1 1.0 0.9 0.9 Difference (%) 2.7 10.2 10.9 4.8 Price Target 108.3 60.7 24.4 23.8 Consensus PT Price Target End Date FY13 10.0% (121.9%) (107.7%) 1Q -0.4 0.0 0.4 -27.4 13 18 31-Dec-15 FY14E (2.0%) 167.3% 321.7% 2Q 0.4 0.4 0.6 FY15E (0.7%) 16.5% 16.2% 3Q 0.3 0.8 0.6 FY16E (13.3%) (51.7%) (54.1%) 4Q 0.1 0.6 0.5 Date of Price 52-Week range Market Cap Market Cap Share Out. (Com) Free float Avg daily val Avg daily val (US$) Avg daily vol. Dividend yield (%) Exchange Rate 28 Jan 15 NT$19.15-8.71 NT$175,161MM US$5,604MM 9,624MM 85.0% NT$1.4B 45.8MM 89.9MM shares 0.0 31.26 Source: Company data, Bloomberg, J.P. Morgan estimates. See page 12 for analyst certification and important disclosures, including non-US analyst disclosures. J.P. Morgan does and seeks to do business with companies covered in its research reports. As a result, investors should be aware that the firm may have a conflict of interest that could affect the objectivity of this report. Investors should consider this report as only a single factor in making their investment decision. www.jpmorganmarkets.com Asia Pacific Equity Research 29 January 2015 Overweight CapitaRetail China Trust CRCT.SI, CRCT SP Price: S$1.73 Another quarter of sterling tenant sales growth ▲ Price Target: S$1.80 Previous: S$1.75 CRCT’s FY14 results in-line, driven by Grand Canyon. Tenant sales surpassed national average, on top of strong rent reversion. Aside from continued rental growth and acquisitions, the stock is proxy to RMB appreciation. Maintain OW with a higher PT (+3%) as we roll-over estimates. Results in-line. CapitaRetail China Trust posted a 12.7% YoY rise (+5.5% QoQ) in 4Q14 DPU to 2.48 S cts, bringing full-year DPU to 9.82 S cts (+8.9% YoY) and within our estimated 10.18 S cts. Full-year contribution from CapitaMall Grand Canyon underpinned FY14 NPI increase of 26% to RMB 643m, with a lower +9% on same-store basis. Tenant sales rose across all trade sectors, with 4Q14 YoY growth of 21% exceeding the preceding quarter’s +16%, which translates to fullyear increase of 16% (vs. +9% in FY13). Rent reversion for the quarter continued to be strong at +20.6%, led by CapitaMall Wangjing (+35.3%) and CapitaMall Saihan (+16.7%). Occupancy fell 1.7%pts QoQ to 95.9%, due to tenant mixing at CapitaMall Wuhu (-13.5%pts to 73.9%) and closure of Zhongshan Avenue leading to poorer accessibility to CapitaMall Minzhongleyuan (13.0%pts to 73.9%). We see further downside pressures at Minzhongleyuan, but it comprises only 5% of our full-year projections. Ample debt headroom of RMB 1.1b for acquisitions based on our estimates, assuming optimal gearing of 35% (from current 28.5%). Aside from a rising pool of third-party vendors who have generally lowered their asking prices, we expect CRCT to tap its sponsor pipeline. Valuation, key risks. CRCT is one of our top REIT picks, given its strong DPU growth and P/B of 1.06x (vs. 1.32x mean). Key risks: weakness in China economy. DPU estimates -3% on larger share base. CapitaRetail China Trust (Reuters: CRCT.SI, Bloomberg: CRCT SP) S$ in mn, year-end Dec FY13A FY14A FY15E Revenue (S$ mn) 160 203 214 Net property income (S$ mn) 103 132 146 Distributable Profit (S$ mn) 70 81 88 EPU (S$) 0.08 0.08 0.10 DPU (S$) 0.09 0.10 0.11 BVPU (S$) 1.48 1.63 1.62 Revenue growth (%) 4.9% 27.0% 5.2% DPU growth (%) (5.5%) 8.9% 8.1% P/E (x) 22.5 20.7 17.4 P/BV (x) 1.2 1.1 1.1 Dividend Yield 5.2% 5.7% 6.2% Gearing 32.6% 28.5% 28.7% RNAV/Share 1.72 FY16E 221 151 93 0.10 0.11 1.61 3.4% 4.3% 16.6 1.1 6.4% 29.0% - FY17E 226 155 96 0.11 0.11 1.61 2.4% 2.8% 16.2 1.1 6.6% 29.3% - Singapore REITs Brandon Lee AC (65) 6882-7073 [email protected] J.P. Morgan Securities Singapore Private Limited Cusson Leung (852) 2800-8526 [email protected] J.P. Morgan Securities (Asia Pacific) Limited Terence M Khi (65) 6882-1518 [email protected] J.P. Morgan Securities Singapore Private Limited Price Performance 1.6 S$ 1.4 1.2 Jan-14 Apr-14 Jul-14 Oct-14 Jan-15 CRCT.SI share price (S$) FTSTI (rebased) Abs Rel YTD 6.2% 4.8% 1m 7.8% 5.8% Company Data Shares O/S (mn) Market Cap (S$ mn) Market Cap ($ mn) Price (S$) Date Of Price Free Float(%) 3M - Avg daily vol (mn) 3M - Avg daily val (S$ mn) 3M - Avg daily val ($ mn) FTSTI Exchange Rate Price Target End Date 3m 7.1% 0.6% 12m 33.2% 21.6% 828 1,429 1,056 1.73 28 Jan 15 0.87 1.40 1.0 3419.15 1.35 31-Dec-15 Source: Company data, Bloomberg, J.P. Morgan estimates. See page 7 for analyst certification and important disclosures, including non-US analyst disclosures. J.P. Morgan does and seeks to do business with companies covered in its research reports. As a result, investors should be aware that the firm may have a conflict of interest that could affect the objectivity of this report. Investors should consider this report as only a single factor in making their investment decision. www.jpmorganmarkets.com Asia Pacific Equity Research 30 January 2015 Dr. Reddy's Laboratories Limited Price Target: Rs3,600.00 Dr Reddy’s (DRRD) reported results well ahead of our and Street expectations primarily driven by growth in the US despite the high base of last year and currency impact on Russia/CIS growth. Outlook on Russia and the observations in the API facility were the key focus areas on the call. On the proprietary filing, DRRD expects two filings in the next few months. We remain OW with a Mar-16 PT of Rs3600 with upside from monetization of its R&D investment in proprietary filing over the next two years. 3QFY15 results overview: 3QFY15 revenue at Rs38.4bn (+9% YoY) was higher than consensus at Rs36.3bn, with positive growth in the US (+4% YoY and 17% QoQ aided by new launches/market share momentum) offsetting the decline in Russia/CIS (-10% YoY). EBITDA for the quarter at Rs9.8bn (25.5% margin) was well ahead of consensus due to favorable impact of EM currency movement on SG&A. PAT at Rs5.7bn was impacted by a higher tax rate but aided by FX gain (Rs604Mn). US growth better than expected but focus on observations in API facility. While we had expected US revenue to recover QoQ (highest ever sales at $271Mn vs. $235Mn in 2Q), the 17% QoQ growth was driven by strong launch performance and forward buying during the holiday season. Shipments of the recently acquired Halbitrol ($60Mn revenue pa) started recently and should contribute to revenue going forward. However, the delay in approvals due to Form 483s at the Srikakulam API facility could be a near-term overhang given key filings (Nexium, Diovan) from the facility. DRRD has provided a comprehensive response on the observations to the agency in December and will be providing updates. The company is also working on an alternate plan (i.e., site switch, which took some time). Russia – Uncertainty due to currency. Management highlighted 27% growth in local currency in Russia primarily driven by volumes aided by forward buying given economic uncertainty. While DRRD did point to price adjustments on some products, we could see these increases being reflected in the current quarter (depending on currency movement). Currently, hedges are RUB945Mn (@1.50 for FY15). We believe sustainability of underlying volume growth would be key, given the volatile currency and expect flat growth in Russia in FY15 (vs. -1% for 9MFY15). Management reiterated its focus on emerging markets. Source: Company data, Bloomberg, J.P. Morgan estimates. REDY.BO, DRRD IN Price: Rs3,363.30 Strong results despite concerns on Russia; progress on Form 483s at API facility key for approvals Dr. Reddy's Laboratories Limited (Reuters: REDY.BO, Bloomberg: DRRD IN) Rs in mn, year-end Mar FY13A FY14A FY15E FY16E Revenue (Rs mn) 116,266 132,170 147,915 165,250 Net Profit (Rs mn) 16,777 21,515 23,718 26,842 EPS (Rs) 98.44 126.04 138.95 157.25 Core EPS (Rs) 74.56 96.76 99.51 123.81 DPS (Rs) 14.95 17.94 19.78 22.38 Revenue growth (%) 20.1% 13.7% 11.9% 11.7% EPS growth (%) 17.2% 28.0% 10.2% 13.2% ROCE 15.9% 16.8% 15.6% 16.7% ROE 19.5% 20.2% 16.9% 17.4% Core P/E (x) 45.1 34.8 33.8 27.2 EV/EBITDA (x) 17.8 14.6 13.0 11.0 Dividend Yield 0.4% 0.5% 0.6% 0.7% Overweight FY17E 187,782 32,871 192.57 170.15 27.41 13.6% 22.5% 18.6% 19.8% 19.8 8.7 0.8% India Pharmaceuticals & Healthcare Services Neha Manpuria AC (91-22) 6157-3589 [email protected] Bloomberg JPMA MANPURIA <GO> J.P. Morgan India Private Limited Pinakin Parekh, CFA (91-22) 6157-3588 [email protected] J.P. Morgan India Private Limited Sean Wu (852) 2800-8538 [email protected] J.P. Morgan Securities (Asia Pacific) Limited Price Performance 3,800 3,400 Rs 3,000 2,600 2,200 Jan-14 Apr-14 Jul-14 Oct-14 Jan-15 REDY.BO share price (Rs) BSE30 (rebased) Abs Rel YTD 4.8% -3.1% 1m 7.1% -1.2% Company Data Shares O/S (mn) Market Cap (Rs mn) Market Cap ($ mn) Price (Rs) Date Of Price Free Float(%) 3M - Avg daily vol (mn) 3M - Avg daily val (Rs mn) 3M - Avg daily val ($ mn) BSE30 Exchange Rate Price Target End Date Price Target (Rs) 3m 10.4% 0.9% 12m 26.7% -17.1% 170 572,360 9,321 3,363.30 29 Jan 15 65.4% 0.36 1,171.72 19.1 2,9681.77 61.40 31-Mar-16 3,600.00 See page 9 for analyst certification and important disclosures, including non-US analyst disclosures. J.P. Morgan does and seeks to do business with companies covered in its research reports. As a result, investors should be aware that the firm may have a conflict of interest that could affect the objectivity of this report. Investors should consider this report as only a single factor in making their investment decision. www.jpmorganmarkets.com Asia Pacific Equity Research 30 January 2015 Overweight Hyundai Steel Company 004020.KS, 004020 KS Price: W65,300 4Q14 results - Beat, margins continue to expand on merger benefits, construction sector picking up ▲ Price Target: W85,000 Previous: W80,000 Hyundai Steel’s (HSC) 4Q14 results beat our and Street estimates, ending FY14 with a strong sequential lift to its highest OP margins since 2008.At this point of the cycle, we view HSC as strategically well positioned, with zero exposure to falling raw material costs and captive domestic customers. With capex peaking, we expect to see positive FCF and meaningful deleveraging. We reiterate our OW rating. Strong 4Q14 OP, underlying NP impressive. Hyundai Steel reported 4Q14 OP of W486B, beating our and Street estimates (JPMe W417B). ASP remained stable (-1% q/q) while shipments seasonally rose by 8% q/q. Mix improvement to flat steel, lower RM costs and merger integration benefits led to an unexpected surge in OPM to 11.4% in 4Q14 (9.4% in 3Q14, 6.9% in 4Q13), posting three consecutive quarters of margin improvement. An FX loss of W107B (parent basis) and still high interest expense dragged the bottom line NP to W217B, still above Street expectations (W207B). Excluding the FX loss, we estimate an impressive underlying NP of W293B. Positive FCF enabled net gearing to decline further to 82% from 85% in 3Q14 (parent level). 2015 guidance: +2% volume, improving product mix. HSC guided FY15 shipment target of 19.7MT (+1.5%), with flat steel at 12.8MT (+1.2%) and long steel 6.9MT (+1.8%). At the briefing, management was upbeat on construction demand (+3.4%) based on increased orders and government stimulus, and expects its long steel sales guidance to be met mostly from domestic sales. Auto demand is expected to rise 1.8% while shipbuilding should be flat. Meanwhile, the company plans to shut down two of its plants in Pohang and Incheon, due to lack of feasibility. HSC plans to compensate the lost capacity (340KT) by increasing production in other plants. Meanwhile, the company is spending a total of W974B to add 1mt specialty steel capacity (bar 600kt, wire rod 400kt) and 500kt CRC capacity, targeting for commercial production in 2016. We view this volume growth as value-added product backed by captive demand. Given the underlying beat, we raise EPS forecasts by 15%/16% for 2015/16. Maintain OW, lift Dec-15 PT to W85,000. On the back of our upgraded forecasts, we raise our PT to W85,000 (was W80,000) based on 0.7x P/B. We expect HSC to deliver strong OP on the back of: 1) cost synergies post its acquisition of Hyundai Hysco’s CRC business, and 2) an increase in high valueadded product shipment from its recent acquisition of Dongbu Special Steel. 3) low raw material costs will likely continue to act as a tailwind. Stay OW rated. Hyundai Steel Company (Reuters: 004020.KS, Bloomberg: 004020 KS) FY12A FY13A FY14E FY15E Revenue (W bn) 14,893 13,533 16,762 15,654 Operating Profit (W bn) 889 763 1,491 1,465 Net Profit (W bn) 796 692 765 950 EPS (W) 9,335 5,937 6,562 8,147 BVPS (W) 115,232 113,168 119,230 126,876 P/E (x) 7.0 11.0 10.0 8.0 P/BV (x) 0.6 0.6 0.5 0.5 EV/EBITDA (x) 10.6 13.4 7.3 7.1 ROE 8.4% 6.0% 5.6% 6.6% FY16E 16,372 1,589 1,035 8,880 135,256 7.4 0.5 6.6 6.8% South Korea Asia Metals and Mining Daniel Kang AC (852) 2800 8570 [email protected] Bloomberg JPMA KANG <GO> J.P. Morgan Securities (Asia Pacific) Limited Sangmyeong Kim (82-2) 758 5710 [email protected] J.P. Morgan Securities (Far East) Ltd, Seoul Branch Waiyin Karen Li, CFA (852) 2800-8561 [email protected] J.P. Morgan Securities (Asia Pacific) Limited Price Performance 85,000 80,000 W 75,000 70,000 65,000 60,000 Jan-14 Apr-14 Jul-14 Oct-14 Jan-15 004020.KS share price (W) KOSPI (rebased) Company Data Price (W) Date Of Price Market Cap (W bn) Shares O/S (mn) 52-week Range (W) KOSPI Price Target (W) Price Target End Date 65,300 29 Jan 15 7,611 117 81,200-61,100 1951.02 85,000 31-Dec-15 Source: Company data, Bloomberg, J.P. Morgan estimates. See page 9 for analyst certification and important disclosures, including non-US analyst disclosures. J.P. Morgan does and seeks to do business with companies covered in its research reports. As a result, investors should be aware that the firm may have a conflict of interest that could affect the objectivity of this report. Investors should consider this report as only a single factor in making their investment decision. www.jpmorganmarkets.com Asia Pacific Equity Research 29 January 2015 Neutral I.T Ltd. 0999.HK, 999 HK Price: HK$2.02 3Q15 Update - Weak Sales Offset by Better than Expected Gross Margins ▼ Price Target: HK$2.50 Previous: HK$2.70 IT reported a mixed 3Q15 update. SSSG was weaker than expected. However, we increase our FY15 forecasts by ~5% due to higher than expected gross margin expansion (~340bps in 3Q15 v JPMf ~14bps contraction). We remain cautious on IT and see limited catalysts in the short term. Weaker than expected 3Q15 sales. 3Q15 SSSG for HK was -4.5% (v JPMf 2H15 +0.4%). SSSG for Mainland China was -0.2% (v JPMf 2H15 +3.4%). SSSG for Japan was +13.5% (v JPMf 2H15 +14.1%). The company noted prodemocracy demonstrations negatively impacted SSSG in HK, while the company continues to be negatively impacted by weakening spending momentum. Better than expected gross margins in 3Q15. Group gross margins expanded ~340bps in 3Q15 (v JPMf 2H15 ~14bps contraction). The driver of the beat was better than expected gross margin expansion in Mainland China (~670bps v JPMf 2H15 ~50bps expansion) and Japan (~910bps v JPMf 2H15 ~100bps contraction). The company attributed the gross margin uplift to reduction in price discounting campaigns. Higher inventory turnover days a negative leading indicator. The company disclosed that inventory turnover days at Nov-14 trended above that at Nov-13 due to lower than expected sales. We worry this may negatively impact sales/gross margins going forward as the company will likely need to reduce inventory in 4Q15. Retain Neutral. We change our earnings forecasts by +5%/-3%/-2% for FY15/FY16/FY17 following this release. We continue to see limited share price catalysts for I.T in the short term for the following reasons: (1) limited sales growth catalysts near-term; (2) likelihood of greater difficulty generating gross margin expansion, despite the better than expected gross margin expansion in 3Q15; and (3) ongoing operating cost pressure, particularly in HK. I.T Ltd. (Reuters: 0999.HK, Bloomberg: 999 HK) HK$ in mn, year-end Feb FY13A FY14A Revenue (HK$ mn) 6,543 6,747 Net Profit (HK$ mn) 384 280 Diluted EPS (HK$) 0.30 0.22 Recurring EPS (HK$) 0.31 0.23 DPS (HK$) 0.03 0.10 Revenue growth (%) 14.0% 3.1% Net Profit growth (%) (18.6%) (27.1%) Recurring profit growth (18.6%) (27.1%) EPS growth (%) (18.8%) (26.6%) ROE 15.9% 10.5% ROA 9.1% 5.4% P/E (x) 6.7 9.1 P/BV (x) 1.0 0.9 EV/EBITDA (x) 4.8 4.4 Dividend Yield 1.5% 5.0% FY15E 7,008 304 0.24 0.25 0.10 3.9% 8.7% 8.7% 8.9% 10.6% 5.2% 8.3 0.8 3.4 5.0% FY16E 7,554 357 0.28 0.29 0.12 7.8% 17.4% 17.4% 17.4% 11.7% 5.9% 7.1 0.8 3.3 5.9% FY17E 8,226 417 0.33 0.34 0.14 8.9% 16.8% 16.8% 16.8% 12.7% 6.6% 6.1 0.7 2.8 6.9% Hong Kong Consumer Shen Li, CFA AC (852) 2800 8523 [email protected] Bloomberg JPMA SHLI <GO> Ebru Sener Kurumlu (852) 2800-8521 [email protected] George Hsu (852) 2800-8559 [email protected] Dylan Chu (852) 2800-8537 [email protected] J.P. Morgan Securities (Asia Pacific) Limited Price Performance 2.6 HK$ 2.2 1.8 Jan-14 Apr-14 Jul-14 Oct-14 Jan-15 0999.HK share price (HK$) HSI (rebased) Abs Rel YTD -9.8% -14.0% 1m -9.0% -15.5% Company Data Shares O/S (mn) Market Cap (HK$ mn) Market Cap ($ mn) Price (HK$) Date Of Price Free Float(%) 3M - Avg daily vol (mn) 3M - Avg daily val (HK$ mn) 3M - Avg daily val ($ mn) HSI Exchange Rate Price Target End Date Price Target (HK$) 3m -18.5% -24.2% 12m 1.0% -11.3% 1,221 2,466 318 2.02 29 Jan 15 0.57 1.32 0.2 24,595.85 7.75 28-Feb-16 2.50 Source: Company data, Bloomberg, J.P. Morgan estimates. See page 7 for analyst certification and important disclosures, including non-US analyst disclosures. J.P. Morgan does and seeks to do business with companies covered in its research reports. As a result, investors should be aware that the firm may have a conflict of interest that could affect the objectivity of this report. Investors should consider this report as only a single factor in making their investment decision. www.jpmorganmarkets.com Asia Pacific Equity Research 29 January 2015 Overweight LG Display 034220.KS, 034220 KS Price: W36,050 Sizable FCF along with prudent capex should translate into higher shareholder returns Price Target: W45,000 LGD reported robust 4Q OP of W626 billion (OPM: 8%), which is the highest level since 2Q10 and very strong revenue of W8.3 trillion, well above our and consensus numbers. This was attributable to strong mobile display business, favorable FX and robust large-size panel prices. The company announced a dividend payment of W500/share (1.4% dividend yield), the first time since 2011. Optimistic guidance for 1Q15: Despite seasonal pullback in demand, management delivered optimistic 1Q15 guidance, pointing to stable large-size panel prices and well above normal seasonality. Also, ongoing size migration in TV could provide upside risk to overall LCD TV area growth, which is in line with our view. Meaningful increase in FCF along with prudent capex: LGD ended up spending capex of W3.0 trillion, which is lower than its previous plan in 2014 and guided to spend less than W3 trillion this year. Most capex will be allocated to new technology (i.e., OLED). Hence, we expect its FCF to significantly increase throughout our forecasting periods. Given its favorable shareholder return policy, we cautiously expect LGD to continue to increase dividend payments. Ongoing product mix improvement: We think LGD deserves a premium over its peers given its value-added products such as 55” and above TVs (UHD), OLED, IPS monitor, and No. 1 position to all Apple products. We also expect LGD to start producing p-OLED for Apple Watch from 1Q15, which will contribute to top-line and earnings improvement. Nevertheless, LGD has significantly underperformed its peers YTD. 25% upside potential: With upward revisions to our earnings estimates for FY15 and FY16, we maintain our high-end consensus earnings estimates and PT. Given announcement of a dividend payment and strong FCF outlook, we think the stock should gradually move up. Bloomberg 034220 KS, Reuters 034220.KS (YE Dec, W bn) FY13 FY14 Sales 27,033 26,456 Operating Profit 1,163 1,357 EBITDA 4,998 4,850 Net profit 419 917 EPS 1,171 2,564 BPS (W) 30,176 32,426 P/E (x) 30.8 14.1 P/BV (x) 1.2 1.1 ROE (%) 4.0 8.2 Net Debt 1,579 1,817 FY15E 29,385 2,052 5,549 1,495 4,178 36,104 8.6 1.0 12.2 -71 FY16E 31,254 Sales growth 2,266 OP growth 5,626 NP growth 1,668 Quarterly EPS (W) 4,661 EPS (14) 40,265 EPS (15) E 7.7 EPS (16) E 0.9 Price Target 12.2 Consensus PT -1,450 Difference (%) Price Target End Date Source: Company data, Bloomberg, J.P. Morgan estimates. South Korea Technology - Semiconductors JJ Park AC (822) 758-5717 [email protected] Bloomberg JPMA PARK <GO> J.P. Morgan Securities (Far East) Ltd, Seoul Branch Jay Kwon (82-2) 758-5725 [email protected] J.P. Morgan Securities (Far East) Ltd, Seoul Branch Narci Chang (886-2) 2725-9899 [email protected] J.P. Morgan Securities (Taiwan) Limited Varun Rajwanshi (91-22) 6157-3277 [email protected] J.P. Morgan India Private Limited Price Performance 38,000 34,000 W 30,000 26,000 22,000 Jan-14 Apr-14 Jul-14 Oct-14 Jan-15 034220.KS share price (W) KOSPI (rebased) Abs Rel YTD 11.8% 10.0% 1m 6.2% 4.5% FY13 FY14 FY15E FY16E Date of Price NM NM 11.1% 6.4% 52-Week range 27.5% 16.7% 51.2% 10.4% Market Cap 77.3% 119.0% 63.0% 11.6% Market Cap 1Q 2Q 3Q 4Q Share Out. (Com) -229 716 990 1,088 Free float 797 912 1,315 1,153 Avg daily val 757 1,068 1,436 1,400 Avg daily val (US$) 45,000 Avg daily vol. 42,117 Dividend yield (%) 6.8 Exchange Rate 31-Dec-15 3m 11.8% 9.9% 12m 42.5% 40.2% 28 Jan 15 W$37,150-22,850 W12,899BN US$11,947MN 358MN 56.0% W33.6B 31.1MM 1.0MM shares 1.4 1,079.75 See page 16 for analyst certification and important disclosures, including non-US analyst disclosures. J.P. Morgan does and seeks to do business with companies covered in its research reports. As a result, investors should be aware that the firm may have a conflict of interest that could affect the objectivity of this report. Investors should consider this report as only a single factor in making their investment decision. www.jpmorganmarkets.com Asia Pacific Equity Research 30 January 2015 Overweight MakeMyTrip Ltd. MMYT, MMYT US Price: $26.88 Muted quarter due to one-off miss in H&P; structural growth story intact; stay OW ▼ Price Target: $35.00 Previous: $37.00 MakeMyTrip (MMYT) reported a muted quarter with USD revenue growth of 22.9% Y/Y primarily due to lower-than-estimated Hotels & Packages (H&P) revenues. Management suggests that the weakness in H&P transaction growth is primarily because of cancellations forced by financial issues faced by SpiceJet and floods in Kashmir. These are one-time disruptions, which are unlikely to sustain in the coming quarters, as per MMYT. We expect H&P business to sustain its strong growth. Air Ticketing business continues to be strong - MMYT increased its market share considerably from 13% to 15%, impressive in our view. MMYT is making investments in its mobile platform, user interface & building larger portfolio of listed hotels to cement its leadership in both (air ticketing and H&P) segments, which is encouraging. We believe MMYT is a structural growth story backed by expected improvement in macro environment in India, favorable demographic profile, increasing internet/smartphone penetration and rising disposable income. MMYT’s leadership position places it well to gain disproportionately from online travel booking market growth. However, quarterly aberrations cannot be ruled out due to various disruptions. We stay OW on MMYT. 3QFY15 revenues of USD 35.1 million modestly missed the consensus estimate of USD36.3 million, but internals look good. The revenue (less service cost) miss is solely driven by lower-than-estimated H&P transactions growth due to the one-offs. Air Ticketing revenues came broadly in line with expectations. MMYT registered its highest-ever quarterly market share gain in Air Ticketing business in 3QFY15. The increase in capacity driven by Vistara, Air Asia and Indigo should also boost revenue growth for MMYT. H&P margins improved 100 bps Q/Q due to improved mix. Also, mgmt increased constant-currency guidance modestly to 30-31% (from 28-30% prev). All these factors suggest that there is no lasting change in MMYT’s growth profile. MMYT is making necessary investments to cement its leadership. The company is making a number of changes to its user interface (particularly on mobile) such as making mobile payment easier, providing Hindi interface, allowing it to prioritize airlines, build customized packages (to drive the shift from offshore to online). A solid mobile platform can prove instrumental in gaining market share. Also, MMYT has materially increased its domestic properties portfolio from 15,500 in Sep-14 to 20,000 properties in Dec-14. All these initiatives should help MMYT maintain its leadership in both its target markets. Loss of pricing power remains key risk. However, it is the risk for air ticketing business primarily, which constitutes a diminishing proportion of total revenues. Hotels business is unlikely to see pricing pressures given low occupancy ratio, low concentration & high operating leverage for hotel owners. India Technology, Software & IT services AC Viju K George (91-22) 6157-3597 [email protected] Bloomberg JPMA VGEORGE <GO> Amit Sharma (91-22) 6157 3598 [email protected] J.P. Morgan India Private Limited Price Performance 34 30 $ 26 22 18 Jan-14 Apr-14 Jul-14 Oct-14 Jan-15 MMYT share price ($) CCMP (rebased) Abs Rel YTD 3.4% 5.5% 1m 2.6% 6.1% 3m -4.0% -5.6% 12m 21.9% 8.7% Bloomberg MMYT US, Reuters MMYT (Year-end Mar, USD mn) Revenue Operating Profit EBITDA Net profit (Reported) EPS P/E (x) EV/EBITDA (x) Cash Equity FY13 88,165 (18,062) (14,309) (27,589) (0.74) NM 12.6 36,501 101,300 FY14 106,429 (16,600) (10,908) (20,906) (0.55) NM NM 38,012 161,585 FY15E FY16E FY13 138,719 175,545 ROE(%) -25.1 (12,758) 366 CORE ROIC(%) (5,075) 7,756 Quarterly EPS ($) 1Q (14,989) (1,300) EPS (15) E (0.10) (0.36) (0.03) EPS (16) E (0.02) NM NM Local 1M NM NM Abs. Perf.(%) 0.4% 62,066 77,937 Rel. Perf.(%) 3.9% 158,033 169,880 Target Price (31-Dec-15) FY14 FY15E FY16E -15.9 -09.4 -00.8 52-Week range - Share Out. (Com) 2Q 3Q 4Q Market Cap(US) (0.11) (0.09) (0.06) Free float (0.03) (0.00) 0.02 Avg daily val ($) 3M 12M Dividend Yield (4.0%) 21.9% Index (5.6%) 8.7% $ 35.00 36.12-19.06 42MN US$1,125MN 60.6% 6.72MN 4637.99 Source: Company data, Bloomberg, J.P. Morgan estimates. See page 9 for analyst certification and important disclosures, including non-US analyst disclosures. J.P. Morgan does and seeks to do business with companies covered in its research reports. As a result, investors should be aware that the firm may have a conflict of interest that could affect the objectivity of this report. Investors should consider this report as only a www.jpmorganmarkets.com single factor in making their investment decision. Asia Pacific Equity Research 30 January 2015 Clients should contact representatives and execute transactions through a J.P. Morgan subsidiary or affiliate in their home jurisdiction unless governing law permits otherwise. Underweight NTT Docomo (9437) 3Q expenses present 5% downside to FY15E EBITDA We remain UW on NTT Docomo given 1) its core network quality issues, 2) slowing industry revenue growth, 3) loss of quality share continuing to hit margins at the CNE level (28.9% of voice revenue vs. 19.7% in 3Q13), and 4) margin dilutive impact of fiber wholesale. We reduce our 2015/16 EBITDA and net income numbers by 8%/16% despite growing top line on account of higher communication and network charges and potential marketing expenses off the new bundled plans. Our numbers imply that continued revisions will weigh on the stock with 16% downside to FY15 earnings and 5% downside to EBITDA. 3Q operating weakness continues. The top line was in line with our estimate of Street expectations (using 1/2Q actuals plus 3Q Street forecasts) but EBITDA missed by 2% on higher CNE charges, SG&A and cost of equipment. Communication Network charges continued to rise higher from 27.1% of voice sales in 2Q14 to 28.9% in 3Q14 (see Figure 1). The beat came from operating income, which rose on account of lower depreciation, which the company attributed to ‘a scrutinization of the write off of network equipment’. 9M operating income fell by 14.7% yoy and came in at ¥587bn, compared to the Nikkei’s estimate of ¥560bn and our estimate of street expectations at ¥558bn. 93%/91% of FY14 guidance/ consensus operating income and 91%/90% of FY14 guidance/ consensus net income have already been achieved in 9M14 (see Table 1). 2015 view. We expect higher top-line growth to be clogged by growing CNE charges as a percentage of voice revenue and potential promotional expenses related to the new bundles. Our revised numbers illustrate 16% downside for FY15 earnings and 5% downside for EBITDA. We expect EBITDA margin to drop to 30%/29% for FY14/FY15 from 34% in 2013. Remain UW. We stay negative on the stock owing to: (1) The impact of fiber wholesale that is expected to be margin dilutive. DoCoMo will compete on a variable cost basis vs. KDDI operating on a fixed cost basis, putting DCM at a cost disadvantage, in our view. (2) Consistent market share loss due to a lack of 3/4G network quality leadership. (3) The highest valuation in the space, despite negative sales/EBITDA/net profit revisions. NTT Docomo (Reuters: 9437.T, Bloomberg: 9437 JT) 2012/3 2013/3 Sales (¥ mn) 4,240,003 4,470,122 Operating Profit (¥ mn) 874,460 837,180 Pretax Profit (¥ mn) 876,958 841,658 Net Profit (¥ mn) 463,912 495,633 EPS (¥) 111.9 119.5 P/E (x) 17.7 16.5 P/BV (x) 1.6 1.5 EV/EBITDA (x) 5.4 5.5 Source: Company data, Bloomberg, J.P. Morgan estimates. 2014/3 4,461,203 819,199 833,049 464,729 112.1 17.6 1.5 5.4 2015/3 E 4,446,785 641,479 647,061 389,442 98.5 20.1 1.4 6.3 2016/3 E 4,520,681 620,850 625,779 376,354 95.2 20.8 1.4 6.3 9437.T, 9437 JT Price: ¥1,977 Price Target: ¥1,650 Japan Wireless Services James R. Sullivan, CFA AC (65) 6882-2374 [email protected] Bloomberg JPMA SULLIVAN <GO> J.P. Morgan Securities Singapore Private Limited Jesper J Koll (81-3) 6736-8600 [email protected] JPMorgan Securities Japan Co., Ltd. Namita Mitla (91-22) 6157-3301 [email protected] J.P. Morgan India Private Limited Price Performance 2,000 ¥ 1,800 1,600 1,400 Jan-14 Apr-14 Jul-14 Oct-14 Jan-15 9437.T share price (¥) TOPIX (rebased) Abs Rel YTD 11.8% 11.4% 1m 11.0% 11.8% Company Data Price (¥) Date Of Price Market Cap (¥ bn) Shares O/S (mn) 52-week Range (¥) TOPIX DPS (¥) Dividend Yield ROE Price Target (¥) Price Target End Date 3m 11.1% -0.1% 12m 19.7% 7.2% 1,977 29 Jan 15 8,629.61 4,365 2,020-1,515 1,413.58 54.18 2.7% 7.0% 1,650 31-Dec-15 See page 10 for analyst certification and important disclosures, including non-US analyst disclosures. J.P. Morgan does and seeks to do business with companies covered in its research reports. As a result, investors should be aware that the firm may have a conflict of interest that could affect the objectivity of this report. Investors should consider this report as only a single factor in making their investment decision. www.jpmorganmarkets.com Asia Pacific Equity Research 29 January 2015 Neutral POSCO 005490.KS, 005490 KS Price: W273,500 FY14 results - Miss, FY15 OP guidance at risk of downgrade ▼ Price Target: W300,000 Previous: W330,000 POSCO FY14 results disappointed. Hit by additional tax payments, FX and equity losses, the FY14 NP more than halved. 4Q14 OP surprised us by sequentially falling during the traditional strong 4Q season. At an annualized W3.0T, we believe POSCO’s FY15 OP target of W4.0T will likely be cut. Given likely Street downgrades and weak steel markets, we see further downside pressure on POSCO shares in the near term. FY14 NP miss, OP disappoints. POSCO announced preliminary FY14 reported NP of W626B (consensus W1.38T, JPM W1.32T), -55% y/y. This implied a 4Q14 loss of W193B. Full result details will be released next week on February 5, but we believe the bottom line was hit by: a) an additional tax payment following government investigation (Yonhap), b) losses from equity investments, and c) foreign exchange losses on USD loans. FY14 OP of W3.2T (Street W3.36T), +7.3% y/y, on Sales of W65.1T (guidance W65.5T), +5.2%, suggests OPM held broadly flat at 4.9% (4.8% 2013). The implied 4Q OP of W765B (consensus W922B, JPM W902B) was disappointing given that 4Q is seasonally a stronger quarter than 3Q. Pleasingly, final DPS were maintained at W6k/share. FY15 OP guidance at risk. We suspect strong Chinese steel exports in 4Q14 both into Korea (4Q14 +3% q/q) and overall (4Q14 +17% q/q) primarily into the Asian region, negatively impacted POSCO’s OP margins (4.6% in 4Q14 versus 5.4% 3Q14). Of greater concern, POSCO’s 4Q14 OP implies an annualized OP of W3.1T and with 1Q15 cash spreads contracting, lower oil prices that should reduce Myanmar’s gas contributions, we believe POSCO will cut its current FY15 OP guidance of W4.0T. Its mid-term 2016 target of W5.0T will also be at risk. Following the weaker-than-expected result, we trim EPS by 9% and 8% in 2015E and 2016E and expect Street downgrades to follow. Shares to face near-term downside pressure. POSCO shares have already corrected sharply in recent months but given the disappointing FY14 results, we expect its shares to remain under downside pressure in the near term. Given our earnings cuts and ahead of its results briefing next week (5 Feb 2015), we cut our PT to W300,000 (was W330,000). POSCO (Reuters: 005490.KS, Bloomberg: 005490 KS) FY12A FY13A Revenue (W bn) 63,604 61,865 Operating Profit (W bn) 3,653 2,996 Net Profit (W bn) 2,462 1,376 EPS (W) 28,239 15,787 BVPS (W) 452,523 482,251 P/E (x) 9.7 17.3 P/BV (x) 0.6 0.6 EV/EBITDA (x) 8.7 ROE 6.1% 3.4% FY14E 65,098 3,213 626 7,181 482,112 38.1 0.6 7.1 1.5% FY15E 65,491 3,381 1,735 19,894 494,685 13.7 0.6 6.6 4.1% FY16E 67,031 3,651 2,014 23,105 510,469 11.8 0.5 6.0 4.6% South Korea Asia Metals and Mining Daniel Kang AC (852) 2800 8570 [email protected] Bloomberg JPMA KANG <GO> J.P. Morgan Securities (Asia Pacific) Limited Sangmyeong Kim (82-2) 758 5710 [email protected] J.P. Morgan Securities (Far East) Ltd, Seoul Branch Waiyin Karen Li, CFA (852) 2800-8561 [email protected] J.P. Morgan Securities (Asia Pacific) Limited Price Performance 380,000 340,000 W 300,000 260,000 Jan-14 Apr-14 Jul-14 Oct-14 Jan-15 005490.KS share price (W) KOSPI (rebased) Company Data Price (W) Date Of Price Market Cap (W bn) Shares O/S (mn) 52-week Range (W) KOSPI Price Target (W) Price Target End Date 273,500 29 Jan 15 23,846 87 363,500263,000 1951.02 300,000 31-Dec-15 Source: Company data, Bloomberg, J.P. Morgan estimates. See page 8 for analyst certification and important disclosures, including non-US analyst disclosures. J.P. Morgan does and seeks to do business with companies covered in its research reports. As a result, investors should be aware that the firm may have a conflict of interest that could affect the objectivity of this report. Investors should consider this report as only a single factor in making their investment decision. www.jpmorganmarkets.com Asia Pacific Equity Research 30 January 2015 Neutral PTT Exploration & Production PTTE.BK, PTTEP TB Price: Bt113.00 Cost reduction - a challenge Price Target: Bt100.00 PTTEP's management update post FY14 earnings did little to re-assure us that the company is able to lower cost partly owing to high cost fields from legacy deals. Impairment risk on Mozambique looks limited for now, but there was no visibility on FID timing. We think PTTEP looks unlikely to reach its 600kb/d production target by 2020 and will do its best to sustain the current dividend level. While the shares seems to price in low oil prices and the balance sheet remains unconstrained, we see further downside risks should oil prices fall below US$40/bl and remain Neutral. Limited potential for cost and capex reduction due to legacy deals. DD&A costs for Montara still remain high at US$65-70/bbl despite impairment. Given full-year operations for Zawtika and recently bought Hess assets, DD&A is likely to remain elevated in 2015-16. Management is cautious on benefits from cost-reduction drive and has not guided for potential savings yet. Scope for capex reduction for 2015 remains limited as most of the capex is likely to be spent to maintain production profile and the flexible portion of the 5-year capex budget of US$24bn, provisioned for development projects, is rather back-loaded in 2017-19. Given 1P reserve life of only c6 years and declining output, management may be compelled to invest in development projects and acquire producing assets, despite potentially lower hurdle rates. Mozambique assets not impaired yet. Management noted that Mozambique assets (cUS$2.5bn on book) impairment triggers would mainly be oil price outlook and change in production profile. The FID is expected in late-2015 or early-2016 with two 5MMTPA trains in 2020-21. Montara and Mariana Oil Sand projects may be subjected to further impairment depending on oil price outlook and change in production profile respectively. As PTTEP already held interest in Hess Thai assets bought in Apr-14, management sees limited scope for impairment. Maintain Neutral with Dec-15 PT of Bt100/sh, based on our DCF valuation. Downside risks are value-destructive M&As and potential impairment for Mozambique assets. Key upside risks include a surge in oil prices and better-than-expected production output. PTT Exploration & Production (Reuters: PTTE.BK, Bloomberg: PTTEP TB) Bt in mn, year-end Dec FY12A FY13A FY14A FY15E Revenue (Bt mn) 212,681 225,163 247,929 187,944 Net Profit (Bt mn) 57,316 55,967 21,490 28,112 EPS (Bt) 14.44 14.10 5.41 7.08 DPS (Bt) 5.70 6.00 4.50 3.00 Revenue growth (%) 25.3% 5.9% 10.1% (24.2%) EPS growth (%) 7.1% (2.4%) (61.6%) 30.8% ROCE 16.6% 12.6% 10.1% 5.2% ROE 24.1% 16.7% 13.8% 6.7% P/E (x) 7.8 8.0 20.9 16.0 P/BV (x) 1.4 1.2 1.1 1.0 EV/EBITDA (x) 3.3 3.2 2.7 3.8 Dividend Yield 5.0% 5.3% 4.0% 2.7% FY16E 181,542 27,092 6.82 3.00 (3.4%) (3.6%) 4.9% 6.2% 16.6 1.0 4.1 2.7% Thailand Exploration & Production Scott L Darling AC (852) 2800 8578 [email protected] Bloomberg JPMA DARLING <GO> J.P. Morgan Securities (Asia Pacific) Limited Sumedh Samant (66-2) 684 2682 [email protected] JPMorgan Securities (Thailand) Limited Anne Jirajariyavech, CFA (66-2) 684-2684 [email protected] JPMorgan Securities (Thailand) Limited Price Performance 200 180 Bt 160 140 120 100 Jan-14 Apr-14 Jul-14 Oct-14 Jan-15 PTTE.BK share price (Bt) SET (rebased) Abs Rel YTD 5.6% -1.4% 1m -1.7% -7.6% Company Data Shares O/S (mn) Market Cap (Bt mn) Market Cap ($ mn) Price (Bt) Date Of Price Free Float(%) 3M - Avg daily vol (mn) 3M - Avg daily val (Bt mn) 3M - Avg daily val ($ mn) SET Exchange Rate Price Target End Date 3m -21.3% -22.8% 12m -28.0% -52.8% 3,970 448,608 13,774 113.00 29 Jan 15 8.52 1,043.26 32.0 1586.40 32.57 31-Dec-15 Source: Company data, Bloomberg, J.P. Morgan estimates. See page 7 for analyst certification and important disclosures, including non-US analyst disclosures. J.P. Morgan does and seeks to do business with companies covered in its research reports. As a result, investors should be aware that the firm may have a conflict of interest that could affect the objectivity of this report. Investors should consider this report as only a single factor in making their investment decision. www.jpmorganmarkets.com Asia Pacific Equity Research 30 January 2015 Overweight SK Telecom 017670.KS, 017670 KS Price: W284,000 2015 catalysts: Significant earnings growth, soft dividend hike, share buyback, SK Planet Price Target: W340,000 SKT posted in-line 4Q results. Management provided upbeat ARPU growth guidance of 4-5% and indicated potential dividend upside. We believe SKT is well positioned to post robust earnings growth (+21% OP growth) in 2015. We also expect dividend per share to rise from W9,400 in 2014 to W10,000 in 2015, equivalent the superior 2015E dividend yield of 3.5% among Korea telcos. We maintain our OW rating and SoTP-based PT of W340,000, with slight downward earnings adjustments offset by FCF increases after 2016E. South Korea Wireless Services Stanley Yang AC (82-2) 758-5712 [email protected] Bloomberg JPMA YANG <GO> J.P. Morgan Securities (Far East) Ltd, Seoul Branch Sally Yoo 4Q in line. SKT’s consolidated OP of W490B was in line with our expectation. We note tighter-than-expected marketing costs control (-1.9% q/q) relative to competitors in 4Q. (82-2) 758-5383 [email protected] Significant earnings growth momentum in 2015. With our earnings forecasts fine-tuned, we forecast 21% OP growth in 2015 based on 3% ARPU growth and the decline of the marketing costs to sales ratio from 26% in 2014 to 24% in 2015. James R. Sullivan, CFA Potential dividend hike and share buyback. Management commented that it will consider potential dividend upside and share buybacks. The possibility of these two shareholder-friendly strategies is high, in our view. We expect dividend per share to rise from W9,400 to W10,000 in 2015. The dividend to be paid from SK Hynix will likely transfer to SKT shareholders, in our view. Price Performance SK Planet remains a “call option value,” maintain OW. We continue to be positive on the stock thanks to enhancing earnings visibility in the future and dividend upside. The value-enhancing strategy of 100%owned subsidiary SK Planet remains a potential share price catalyst, in our view. SK Telecom (Reuters: 017670.KS, Bloomberg: 017670 KS) Year-end Dec FY13A FY14E Revenue (W bn) 16,602 17,164 Operating Pofit (W bn) 2,017 1,825 Net Profit (W bn) 1,610 1,799 EPS (W) 22,690 25,365 Revenue Growth 2.9% 3.4% Operating profit growth 16.6% (9.5%) EPS growth 41.7% 11.8% ROE 8.8% 7.7% P/E (x) 12.5 11.2 P/BV (x) 1.6 1.5 EV/EBITDA (x) 5.7 5.8 DPS (W) 9,400 9,400 Dividend Yield 3.3% 3.3% Source: Company data, Bloomberg, J.P. Morgan estimates. FY15E 17,615 2,208 2,105 29,669 2.6% 21.0% 17.0% 9.0% 9.6 1.4 5.2 10,000 3.5% FY16E 17,993 2,352 2,231 31,451 2.1% 6.5% 6.0% 8.9% 9.0 1.3 5.0 10,500 3.7% J.P. Morgan Securities (Far East) Ltd, Seoul Branch (65) 6882-2374 [email protected] J.P. Morgan Securities Singapore Private Limited 300,000 260,000 W 220,000 180,000 Jan-14 Apr-14 Jul-14 Oct-14 Jan-15 017670.KS share price (W) KOSPI (rebased) Abs Rel YTD 6.0% 4.2% 1m 4.4% 3.2% Company Data 52-week Range (W) Market Cap (W bn) Market Cap ($ mn) Shares O/S (mn) Fiscal Year End Price (W) Date Of Price Free Float(%) 3M - Avg daily vol (th) 3M - Avg daily val (W bn) 3M - Avg daily val ($ mn) KOSPI Exchange Rate (W/$) Price Target (W) Price Target End Date 3m 5.4% 5.9% 12m 31.2% 30.7% 303,000192,000 22,932 21,146 81 Dec 284,000 29 Jan 15 55.3% 142.0 39.4 36.3 1,951 1,084 340,000 30-Dec-15 See page 9 for analyst certification and important disclosures, including non-US analyst disclosures. J.P. Morgan does and seeks to do business with companies covered in its research reports. As a result, investors should be aware that the firm may have a conflict of interest that could affect the objectivity of this report. Investors should consider this report as only a single factor in making their investment decision. www.jpmorganmarkets.com Asia Pacific Equity Research Advanced Info Services (ADVANC TB) 2015 Outlook: Higher Capex and tepid growth. Time to shift the debate from regulation to data economics 29 January 2015 Underweight Price: Bt251.00 29 Jan 2015 Price Target: Bt198.00 PT End Date: 30 Jun 2015 AIS management hosted an “AIS Vision 2015” event this afternoon, where they provided an overview of the business plan for 2015. Capex guidance of minimum THB40B v/s consensus estimates of THB30B does not come as a surprise to us. While lack of more spectrum has some role to play, rapidly rising data usage (over 200% YoY) is the key driver. Revenue growth expectations for the industry seem tepid, with management expecting 3%-4% in 2015. Spectrum auctions in July this year now seem a consensus view, so any potential delays could lead to negative surprises. Going forward, we see data economics to set the tone for earnings and stock price, especially post the spectrum auction event. Current rates of data usage growth point to further increase in capex intensity, which will also have implications for network opex. We remain cautious and maintain our UW rating on AIS. Time to shift the debate from regulatory environment to data economics: Investor focus over the last 12-18 months has been centered around the regulatory environment and timing of spectrum auctions. Consensus seems to be baking in a July-15 auction scenario. We believe post auctions, the debate will move to economics of data. Data usage in Thailand is rising rapidly, as 3G network is rolled out and smart-phone adoption increases. However, data revenue growth is significantly lagging usage growth (~200% to 400% y/y as noted by AIS), implying compression in data unit pricing. This is likely to drive capex higher and rising competitive intensity (potentially led by True Corp) could keep data pricing under check. CAPEX guidance of >Bt 40bn for 2015, is already significantly higher than current consensus estimates of Bt 30bn. AIS has laid out this capex to expand wireless network, fixed broadband service and digital services. Growth outlook for 2015 looks tepid: AIS expects wireless industry revenues to grow ~3-4%, device sales to increase by 10% and fixed broadband revenues to rise 15% in 2015. Street is looking at a recovery in service revenues for the industry in 2015, post a tepid 2014. A 3%-4% growth scenario indicted continued tepid industry growth environment, though it is in-line with current consensus estimates, which bake in 4% revenue growth in 2015 Seeking transformation into a digital services provider, but monetisation strategy not clear yet: AIS is looking to shift away from being a pure-play wireless provider to become an integrated provider of mobile, fixed broadband and digital content. AIS views itself as “an enabler of the development of content” for various industries, for instance in streaming music (20mn songs downloaded per year), browsing books (>2million e-book views per month), news content (20mn newscast delivered per year), and financial transactions (>400 subscribers every month uses their mobile payment services). AIS believe its strong foundation in engineering and relationships with regulators, and content service providers should help enable the transformation. While the desire to shift away from being a 'dumb pipe' is well articulated, management are yet to detail a monetization strategy. Spectrum Auctions in mid 2015? AIS played a video of the NBTC Chairman stating NBTC’s main plan in 2015 was to launch auction for 900mHZ and 1800Mhz spectrum auction to support 4G roll out. While timing of spectrum auctions being scheduled towards the middle of 2015 is now a consensus view, we believe there are other regulatory issues that need resolution particularly the base pricing of the auctions and nature of network deals between operators and CAT and TOT. Maintain UW. We maintain our Underweight rating with a PT of THB198 based on 14x Jun 2016E P/E. Asia Pacific Equity Research 29 January 2015 Asian Paints Limited (APNT IN) Q3FY15 First cut : Earnings disappoint on sales miss Neutral Price: Rs910.25 28 Jan 2015 Price Target: Rs710.00 PT End Date: 30 Sep 2015 Asian Paints Q3FY15 operating performance was below our and street expectations. Company registered Net Sales, EBITDA and PAT growth of 6%, 9% and 12% respectively for Q3FY15. Single digit volume growth for the decorative segment was a key negative. Gross margin expansion was healthy at ~300bp y/y. Sales growth moderated to 6% y/y led by low single digit volume growth in the decorative segment due to sluggish demand trends. Growth was also affected by the early festival season this year. The automotive coatings JV witnessed good growth in general industrial and auto refinish segment, though auto OEM segment saw subdued demand. Gross margin gains surprise; subdued sales growth leads to lower EBITDA margin expansion. Benefits of lower RM inflation have started to reflect in improved gross margin performance (+290bp y/y) as overall COGS rose just 1% y/y. However, negative operating leverage restricted EBITDA margin expansion to 40bp y/y. Staff costs and other expenses rose 18% and 16% y/y respectively in Q3. For standalone operations, gross margin and EBITDA margin expanded 340bp and 110bp y/y. This implies that profitability of international and industrial business suffered during the quarter. Home improvement business registered operating loss of Rs52mn in Q3 vs near breakeven in Q2. Management noted that ramp up of home improvement business has been slower than expected. Table 1: Summary of 3QFY15 Results: Consolidated Rs millions Net Sales Other operating income Total revenue COGS Gross Profit Gross Margin Employee cost Other expenses EBITDA EBITDA Margin Other income Depreciation Interest PBT Total tax PAT Minority Interest Net Profit % of sales COGS Employee Cost Other Expenses Source: Company reports. Q3 FY14 34,126 393 34,519 20,379 14,140 41.0% 1,969 6,798 5,373 15.6% 301 633 100 4,941 1,540 3,401 107 3,294 Q2 FY15 35,868 462 36,330 20,469 15,861 43.7% 2,335 8,163 5,362 14.8% 480 669 70 5,103 1,541 3,563 90 3,473 Q3 FY15 36,028 498 36,526 20,517 16,009 43.8% 2,319 7,855 5,835 16.0% 321 673 98 5,384 1,667 3,717 35 3,682 59.0% 5.7% 19.7% 56.3% 6.4% 22.5% 56.2% 6.3% 21.5% YoY 6% 27% 6% 1% 13% QoQ 0% 8% 1% 0% 1% 18% 16% 9% -1% -4% 9% 7% 6% -2% 9% 8% 9% -67% 12% -33% 1% 40% 6% 8% 4% -61% 6% Asia Pacific Equity Research Bank Negara Indonesia Persero (BBNI IJ) Solid beat across the board; accumulate while the Street worries about management changes 30 January 2015 Overweight Price: Rp6,150 29 Jan 2015 Price Target: Rp6,700 PT End Date: 31 Dec 2015 BNI (BBNI IJ) reported 4Q14 net profit of Rp3.2tn, up 26% q/q, 26% y/y and 21%/24% above our and Street estimates respectively. This led to FY14 net profit of Rp10.8tn, up 19% y/y. Exact numbers will be known tomorrow after detailed financials are out. The primary reason for the beat was 1) lower credit costs (49bp vs. 172bp avg. in 9M14), 2) higher non-interest income (+46% q/q), and 3) slightly lower effective tax rate (19.2% vs. 20.3% in 9M14). This was partly offset by seasonally higher operating costs (+30% q/q) and non-operating loss. Lower credit costs came in as a positive surprise, as management had previously guided for lack of seasonality in asset quality in 4Q. Over the last four years, NPLs have improved q/q in 4Q due to a combination of write-off and seasonal improvement in cash flows, and 4Q14 was no exception with NPL improving 24bp q/q to 1.96%. We expect non-II and credit cost-led positive earnings revisions by the Street post today’s result. We reiterate BNI as one of our top picks in the sector (the other being Rakyat). Net interest income came in at Rp6.0tn, up 6% q/q and in line with our estimate. Loan yields improved 70bp y/y to 10.9%, partly offset by an 80bp y/y increase in deposit costs to 3.2%. LDR increased by 264bp y/y to 88.4%, leading to 9bp of margin expansion. Non-interest income came in at Rp3.4tn, up 46% q/q and 26% above JPMe, per our calculations. This was primarily driven by an increase in recurring fees (+18% q/q) viz. account maintenance, credit card, trade finance and also higher insurance premiums (+28% q/q). FX gains increased 61% q/q as the bank held a long USD position (in overseas branches). We expect non-II to remain resilient in the near term, as: 1) 10YR government bond yields are down 82bp in the last three weeks, which should lead to MTM gains; and (2) FX hedging has been made mandatory starting this year, which should lead to higher treasury crossselling which would be reflected in the fee income. Operating costs stood at Rp4.9tn, up 30% q/q and 11% above JPMe, per our calculations. Costs are seasonally higher in 4Q (~38% on avg in past four years) with avg. 4Q CIR of 59%, but thereafter sequentially improve in 1Q (~27% on avg.). Hence we are not worried by the spike and expect costs to normalize in 1Q15. We also note that despite seasonally higher costs, PPOP was up 7% q/q and 4% above our estimates. Asset quality improved during the quarter. NPL ratio declined 24bp q/q to 1.96% and special mention loans declined by a sharp 100bp q/q to 2.62%. These came in as a positive surprise, as management had previously guided for a lack of seasonality in asset quality in 4Q. Asset quality improvement was across the board with small and consumer bad loans improving by 18bp and 32bp respectively after rising in 3Q. Despite significantly lower provisions during the quarter, coverage ratio improved 591bp q/q to 130% which, combined with trends in special mention loans, gives us more comfort on write-offs / recoveries going forward. Change in management: This is the last full year under the current management. There will be a substantial change in management (only 4 out of 10 directors can be reappointed) at the next AGM (17th March). Hence, the investment case will evolve based on the incoming management’s strategy. Details of the management changes are as below: Asia Pacific Equity Research Bank of China (BOCHK) (2388 HK) Considering the sale of NCB? 29 January 2015 Overweight Price: HK$26.90 28 Jan 2015 Price Target: HK$30.00 PT End Date: 31 Dec 2015 Reuters reported this afternoon that BOCHK is considering selling Nanyang Commercial Bank (NCB) at US$6bn while China Cinda Asset Management (1359 HK) is the potential buyer. There is no official comment from BOCHK yet but we think the share price is likely to react positively if the deal potentially takes place at the reported valuation. Incentive for divestment? The report has attributed the potential divestment to the overlapping of onshore Mainland businesses between BOC and NCB (China) although we think both the scale and client base are very much different. Meanwhile, we believe deteriorating asset quality condition (NPL ratio of 1.6% in 1H14 vs. 0.6% in 2H13 at NCB (China)) and an uncertain outlook could also be likely factors if management considering any potential strategic moves, despite the fact that NCB accounts for a small proportion of the group (NCB (China) only accounts for 6.3% of group total loans). Implied valuation is attractive. US$6bn (as mentioned in the news report) would imply 1.4x P/BV based on 1H14 equity of HK$33.4bn at NCB, which is attractive in our view given ROE at NCB in the past 4-5 years is only 8-10%. Such valuation could also result in one-time divestment gains of around HK$13bn, or 54% of our current FY14E earnings. Capital accretive & ROE dilutive. NCB portfolio comprises 21% of RWA at BOCHK as of 1H14 and thus the divestment, if it happens, could help to improve the capital position; based on our estimates, CET1 ratio will increase to 16.4% from 11.8% if taking into account the potential divestment gains aforementioned. On the other hand, earnings contribution from NCB is 11-13% of annual profits at BOCHK and thus proforma ROE could be lowered by 1.5ppt post divestments. Sentiment should be in favor of the divestment. From a business perspective, the potential divestment of NCB, if it happens, should not have a detrimental impact on BOCHK’s cross-border businesses but might help to reduce asset quality concerns/uncertainties, not to mention the reported valuation is very attractive. Therefore, the share price could react positively if there is further progress regarding the potential deal in the near future. Our preferred pick among HK banks remains Hang Seng Bank. Asia Pacific Equity Research Bursa Malaysia Bhd (BURSA MK) Good 4Q, but limited upside 30 January 2015 Neutral Price: M$8.22 29 Jan 2015 Price Target: M$8.50 PT End Date: 31 Dec 2015 Bursa (Bursa MK) reported net income of M$53.1mn in 4Q14, flat q/q, up 57% y/y and 15% above JPM and Street estimates. This brought FY14 net income to M$198mn, up 15% y/y. The beat was across the board and was primarily driven by: 1) Higher-than-expected derivatives revenue (7% above JPMe), 2) Higher listing and market data fees (+16% q/q and +10% q/q, respectively), 3) Lower-than-expected operating costs (3% below JPMe), and 4) Lower effective tax rate (21.4% vs. 25.8% in the previous quarter). The exchange declared 18 sen/share of final dividends, bringing full-year DPS to 58 sen, implying a payout ratio of 145% and FY14 dividend yield of 6.6%. We expect the stock to react positively in the near term on the back of this result. However, the stock is currently trading at implied ADT of M$2.1bn, 3% below our FY15 ADT assumption of M$2.2bn, limiting meaningful upside. Maintain Neutral. Securities ADT came in at M$2.0bn, down 13% q/q, 14% y/y and 8% below our estimate. However, securities clearing revenue came in at M$58.5mn, down 8% q/q and only 3% below JPMe; indicating higher-than-expected securities clearing fees of 3.72bps, per our calculation. Derivatives average daily volume came in at 54,537 contracts, up 1% q/q, up 31% y/y and 6% above our estimates. Consequently, derivatives revenue came in at M$19.0mn, up 3% q/q and 7% above JPMe. F&O volumes were mainly driven by higher FCPO volume and improved FKLI volumes with Dec-14 OI being 196,413 contracts. FY2014 DDAV increased 16% y/y to 50,654 contracts, mainly driven by higher FCPO volumes (+27% y/y) due to uncertainty of CPO prices. Other operating income was M$51.0mn, up 10% q/q and 6% above JPMe. Sequential improvement in income can be attributed to higher listing fees (+16% q/q), market data fees (+10% q/q) and trading revenue from BSAS (+35% q/q). Increase in listing and issuer services fees was due to higher perusal and processing fees earned from higher number of corporate exercises and a higher number of new structured warrant listings. Higher trading revenue from BSAS was due to increase in ADV (M$9.9bn vs. M$7.2bn in 3Q14) as a result of increase in sukuk issuance that trade through BSAS trading platform. Operating costs came in at M$59.1mn, up 7% q/q, but down 10% y/y and 3% below JPMe. While costs are seasonally higher in 4Q due to staff costs (+12% q/q in 4Q), there was good cost management observed for other expenses. We note that operating costs increased only 1% y/y to M$232mn, driven by lower depreciation and amortization expenses (down 28% y/y) since implementation of a more cost efficient new trading system (BTS2) at end of 2013. Consequently, operating margins improved by 224bps y/y to 54%. Final dividends of 18 sen/share was declared, bringing full-year DPS to 58 sen, implying a payout ratio of 145% and FY14 dividend yield of 6.7%. Bursa is now one of the highest dividend-yielding stocks amongst FBMKLCI constituents. The entitlement and payment dates for the final dividend are 3 April 2015 and 16 April 2015, respectively. Initiatives taken and products launched in 2014: To increase the retail participation, the exchange launched an online portal called Bursa Marketplace and held 9 investor conferences and 5 educational programs. It widened its derivative products offerings with the launch of US$-denominated FPOL, the enhanced FMG5, MyETF MSCI Malaysia Islamic Dividend and 3rd Government Guaranteed DINB ETBS. However, we think that it will take some time before such products start making meaningful contribution to revenues. Moreover, we think that to counter increasing regional competition, exchange will have to address its structural problem of lower velocity vis-à-vis its peers (32% vs. 50% at SGX and 70% at HKEx). Asia Pacific Equity Research Genting Singapore (GENS SP) Implication from MBS 4Q result 29 January 2015 Underweight Price: S$1.06 28 Jan 2015 Price Target: S$1.00 PT End Date: 31 Dec 2015 Thoughts on MBS 4Q14 result: Las Vegas Sands (LVS US, OW, covered by Joseph Greff) reported 4Q14 results this morning. Marina Bay Sands (MBS) reported adjusted EBITDA of US428mn (excluding oneoff), up 22% qoq mainly due to favorable win rate (3.58% vs. 3Q 2.64% vs. normal 2.85%). Adjusted for luck and one-off items, EBITDA would have been USD371mn, up 1% qoq and right in-line with JPMe USD371mn. Key operating matrix: 1) Favorable VIP luck factor and robust and stable mass performance: VIP rolling volume totaled USD10.0bn, up 10% qoq from a low base in 3Q but still well below the volume level before 2Q, down 27% yoy. Mass segment has held up well post the strong improvement last quarter, with revenue up 0.7% qoq or 5.4% yoy, benefiting from regional premium mass. Slot revenue was down by 2.1% qoq or 2.1% yoy. 2) Accounts receivable balance: 4Q14 gross A/R increased by 2% qoq to USD1,001mn (vs 3Q14: USD984mn) and A/R reserved was at 40% (vs. 41.9% for 3Q and 37.2% for FY13). A/R turnover days increased to 185 days from 173 days in 3Q. We do not see signs of credit collection improvement for the Singapore market. 3) Margins: EBITDA margin improved to 54.9% from 47.8% in 3Q, mainly due to a favorable luck this quarter. Luck and bad debt adj. EBITDA margin increased slightly to 48% (3Q: 47%). Conference call highlights. 1) Strong mass performance benefiting from regional premium mass. Regional premium mass initiatives have been successfully attracting customers from Indonesia, Malaysia, etc. and supported mass revenue growth. Mass revenue has delivered continued growth since MBS opening, and we believe management will continue to focus on developing high-margin and stable mass and nongaming business to remain competitive and increase profits. 2) 90mn one-off boosted 4Q EBITDA. The reported record high 4Q total EBITDA of USD518.5mn is boosted by USD90mn property tax refund received during the quarter. Adjusting for this one-off and luck factor, the 4Q result is in-line. 3) Japan: Management remains focused on potential development opportunities in Japan. We do not expect Japan gaming legalization to materialize near term. Impact to GENS – slightly negative. As MBS continues to deliver robust mass performance, we expect competition for regional premium mass customers as well as local Singaporean customers to be more intense between the two Singapore operators, which is unfavorable for GENS. The credit situation for the Singapore VIP market still sees no signs of recovery, due to the softer economy growth in China and some South East Asian countries in 4Q. We currently expect GENS 4Q EBITDA to be SGD328mn, factoring in 2% qoq VIP rolling volume growth, normal luck factor, and a 1% qoq decline in mass and slot revenue. Asia Pacific Equity Research 30 January 2015 Overweight HDFC (Housing Development Finance Corporation) (HDFC IN) Price: Rs1,315.55 29 Jan 2015 Price Target: Rs1,400.00 PT End Date: 30 Sep 2015 3Q15: strong retail loan growth; spreads improve HDFC reported in-line PAT of Rs14.25bn, up 12% y/y. Key highlights of the results 1) AUM growth of 16% y/y was mainly driven by retail loans, 2) Spreads improved- led by non-retail loans, 3) Asset quality remained stable, 4) Fee growth remained muted due to lower growth in non-retail loans. Table 1: 3Q15 result table P&L (Rs m) NII Non interest income Opex Op. profit Inv profit PBT Tax PAT 3Q14 18,383 782 1,684 17,481 346 17,577 4,800 12,777 2Q15 19,827 1,114 1,803 19,138 1,027 19,815 6,240 13,575 3Q15 21,193 629 1,853 19,969 1,126 20,645 6,390 14,255 YoY 15% -20% 10% 14% 225% 17% 33% 12% QoQ 7% -44% 3% 4% 10% 4% 2% 5% Key Parameters Spreads Borrowings Term Loans Bonds Deposits Loans (on-book) Retail Wholesale AUM Retail AUM 2.25% 1,770 246 973 551 1,923 1,309 614 2,085 1,471 2.29% 1,953 245 1,094 614 2,123 1,453 670 2,331 1,661 2.31% 2,008 224 1,133 650 2,200 1,522 678 2,411 1,733 0.06% 13% -9% 16% 18% 14% 16% 10% 16% 18% 0.02% 3% -9% 4% 6% 4% 5% 1% 3% 4% Fee growth was muted due to lower non retail loan growth Investment profits contributed 8% to the overall PAT v/s 3% in 3Q14 Spreads improved due to higher spread in non retail loans Lower rates led to substituting bank loans with bonds Deposit growth was strong despite cut in retail deposit rates in 3Q15 Management is witnessing early signs of recovery in non retail loans Source: J.P. Morgan estimates, Company data. AUM growth of 16% was mainly driven by retail loans (+18% y/y). Retail now constitutes 72% of total loans vs 70.8% in 3Q14. Mumbai region witnessed some traction in loan book in the December month after remaining subdued in the previous quarters. There are some early signs of pick-up in demand of nonretail loans - continued momentum should drive stronger revenue growth in FY16E. Spreads. Overall spreads improved to 2.31% vs. 2.25% in 3Q14 - mainly driven by improvement in spreads from non-retail loans, up 21bp y/y. Funding costs were soft and should continue to fall, driven by: 1) recent deposit rate cut in 3Q15, 2) possible base rate cuts in 1HCY15, 3) further substitution of bank loans with bonds. The translation to spreads, however, will be muted by falling lending yields and a compression of the back book-front book differentials. The main tailwind for spreads is an improved share of wholesale lending, likely from 1QFY16E. Asset quality remained stable with Gross NPLs at 0.69%. There was a slight uptick in credit costs due to higher GPs in the quarter. HDFC's PCR continues to be very comfortable at 100% and total provisions are now 0.9% of loans. Non interest income growth was subdued: a) Muted growth in wholesale loans compressed fees b) Investment profits grew 10% q/q and was 8% of overall PAT - given the strong markets - this can expand further in the coming quarters. Asia Pacific Equity Research 29 January 2015 Neutral Hotel Shilla 008770.KS, 008770 KS Price: W103,500 Weak headline disguises strong details Price Target: W94,000 Hotel Shilla reported weaker-than-expected 4Q14 headline results (big miss on both OP and NP), mainly due to 1) larger-than-expected losses from hotels and its overseas new DFS at Singapore Changi International Airport, and 2) an effective tax rate increase on a consolidated basis, mostly due to losses from its Singapore subsidiary. However, the weak headline disguises the strong details, in our view. Its core business, domestic DFS, had better-than-expected margins, with Incheon International Airport (IIA) DFS finally starting to make a meaningful margin improvement. IIA DFS sales finally have reached a level at which the company can enjoy operating leverage from fixed rent. DFS sales were in line with our estimate, but better-than-expected OPM from IIA poses upside risks to our earnings estimates. We are reviewing our estimates. Solid domestic DFS results with record-high OPM: Domestic DFS sales growth was largely in line with our estimate, and both city and airport sales were strong, growing by 39%y/y and 13%y/y respectively. Operating leverage from IIA DFS could push the domestic DFS margin higher than our expectation, while city DFS OPM continues to expand from the economies of scale. Outlook for Changi International Airport: We estimate Changi’s operating loss at W30bn in 4Q14, and expect this to be smaller in 1Q15, as half of the floor space currently under construction is slated to become operational in February 2015. We expect Changi to make about W500bn in sales and a W5bn operating loss in 2015. Since its rent is linked to sales, its profitability should improve in 2H15, once the operation stabilizes. Hotel business likely to continue to be loss-making, but to a lesser extent than in 2014. Although occupancy ratio at the company’s Seoul hotel was higher in 4Q14 than in 3Q14, the operating loss was larger due to the lower-than-expected earnings contribution from the Jeju hotel, as 4Q14 is the low season for Jeju. We expect continued operating losses from the company’s hotels, unless we see a meaningful improvement in the occupancy rate of the Seoul hotel. HOTEL SHILLA CO LTD (Reuters: 008770.KS, Bloomberg: 008770 KS) Year-end Dec FY13A FY14E FY15E Revenue (W bn) 2,297 2,896 4,000 Net Profit (W bn) 11 95 185 EPS (W) 269 2,423 4,712 DPS (W) 300 300 300 Revenue growth 3.5% 26.1% 38.1% Net Profit growth (89.3%) 782.1% 94.2% EPS growth (89.5%) 802.2% 94.4% ROE 1.5% 13.3% 22.0% P/E (x) 385.4 42.7 22.0 P/BV (x) 5.9 5.3 4.3 EV/EBITDA (x) 20.4 17.4 10.7 Dividend Yield 0.3% 0.3% 0.3% Source: Company data, Bloomberg, J.P. Morgan estimates. FY16E 4,504 211 5,381 300 12.6% 14.2% 14.2% 20.6% 19.2 3.5 9.0 0.3% South Korea Specialty Retailing Youna Kim AC (82-2) 758-5715 [email protected] Bloomberg JPMA YKIM <GO> J.P. Morgan Securities (Far East) Ltd, Seoul Branch Sally Yoo (82-2) 758-5383 [email protected] J.P. Morgan Securities (Far East) Ltd, Seoul Branch Ebru Sener Kurumlu (852) 2800-8521 [email protected] J.P. Morgan Securities (Asia Pacific) Limited Price Performance 130,000 W 110,000 90,000 70,000 Jan-14 Apr-14 Jul-14 Oct-14 Jan-15 008770.KS share price (W) KOSPI (rebased) Abs Rel YTD 13.2% 11.4% 1m 13.2% 12.0% Company Data 52-week Range (W) Market Cap (W bn) Market Cap ($ mn) Shares O/S (mn) Fiscal Year End Price (W) Date Of Price Free Float(%) 3M - Avg daily vol (th) 3M - Avg daily val (W bn) 3M - Avg daily val ($ mn) KOSPI Exchange Rate Price Target End Date Price Target (W) 3m -4.2% -3.7% 12m 32.7% 32.2% 135,500-77,300 3,996 3,685 39 Dec 103,500 29 Jan 15 82.4% 395.6 38.1 35.1 1,951.0 1,084.4 30-Dec-15 94,000 See page 7 for analyst certification and important disclosures, including non-US analyst disclosures. J.P. Morgan does and seeks to do business with companies covered in its research reports. As a result, investors should be aware that the firm may have a conflict of interest that could affect the objectivity of this report. Investors should consider this report as only a single factor in making their investment decision. www.jpmorganmarkets.com Asia Pacific Equity Research 30 January 2015 Overweight IDFC (IDFC IN) Price: Rs170.60 29 Jan 2015 Price Target: Rs190.00 PT End Date: 30 Sep 2015 3Q15: NPLs stable; loan book contracts; loan spreads stable IDFC reported PAT of Rs4.23bn (down 15% y/y, 4% < JPMe). Key takeaways: (1) Asset quality remained stable, though provisioning continues to go up. (2) The loan book continues to contract, in line with our expectations. (3) The impact of the bank transition was visible with elevated opex and an expansion in treasury assets. This compressed spreads, though loan spreads remained stable. We expect more details after the conference call tomorrow (10.35am, +91 22 39381071). Table 1: 3Q15 results table Rs in millions, Year-end March NII Loans Treasury Non-interest income Miscellaneous income Op. income Opex PPOP Provisions and losses PBT Tax PAT Key Parameters Spreads (12-month-rolling) Cost/income Loans (Rs in millions) GNPA NNPA 3Q14 6,640 6,100 540 1,870 10 8,520 1,290 7,230 370 6,860 1,860 5,000 2Q15 6,490 5,590 900 4,490 40 11,020 1,970 9,050 2,810 6,240 2,010 4,230 3Q15 6,620 5,670 950 3,170 40 9,830 1,980 7,850 1,530 6,320 2,090 4,230 YoY 0% -7% 76% 70% 300% 15% 53% 9% 314% -8% 12% -15% QoQ 2% 1% 6% -29% 0% -11% 1% -13% -46% 1% 4% 0% 2.30 15.1% 535,650 0.60% 0.50% 2.10 17.9% 530,380 0.60% 0.40% 2.00 20.1% 520,060 0.70% 0.50% -0.30 5.0% -3% 0.1% 0.0% -0.10 2.3% -2% 0.1% 0.1% Source: J.P. Morgan, Company data. Asset quality. Asset quality (stock) remained stable, with gross NPLs at 0.7% and gross restructured loans at 6.1%. PCR continues to rise with incremental provisioning, though credit costs declined to 1.4% vs. 2% in the previous quarter. We expect provisioning to continue in the run up to the bank transition, as management would like to start the bank off with a clean slate. Loan book. Loan book declined 2% q/q for two broad reasons: (1) continued weakness in demand, given the tardy progress in infra projects; and (2) the book size will need to be optimized in the run up to the bank transition (expected in Oct-15) to deal with the reserve requirements on the NBFC backbook. Non interest income and opex. (1) Gains from the principal book remained subdued despite strong markets - this tends to be lumpy, and we don’t read much into a single quarter. (2) Asset management reported strong numbers - the Indian MF industry is seeing strong flows, and IDFC is benefiting from that. (3) IB revenues were down 46% q/q - while the operating environment is strong, revenues tend to be lumpy. (4) Strong treasury income on the back of the bond market rally - this could continue, given the expansion of the book and the continued rally in yields. (5) Soft loan-related fees, a victim of weak loan origination. Asia Pacific Equity Research KLCC Property Holdings (KLCCSS MK) Analyst briefing takeaways: Retail sales outperform peers; Potential office oversupply should not be a concern 29 January 2015 Neutral Price: M$6.80 23 Jan 2015 Price Target: M$6.20 PT End Date: 30 Jun 2015 KLCC held a post-FY14 results briefing. The main takeaways were: 1) Tenant sales at Suria KLCC rose more than 5%Y/Y, the strongest among the main malls, allowing KLCC to achieve rental reversions of 12%Y/Y despite the more cautious consumer environment. 2) While we see a risk of oversupply in the office segment over the next two years, with industry checks revealing an incoming supply to the Klang Valley of about 15% of existing stock, we feel the risk to KLCC is mitigated by its long-term contracts with tenants, and asset branding to international standards. We believe KLCC is well-priced at an FY15E/16E net yield of 5.0%/5.2%, slightly below the sector average, and lacking DPU growth (FY15E/16E: 4.8%/4.4%). Within the REIT space, we prefer exposure to Sunway REIT (OW) for its 17%Y/Y DPU step-up in FY16E, and our top pick is IGB REIT (OW) for exposure to organic growth. Brief recap of FY14 results: FY14 net DPU of 31.7 sen broadly in-line, coming in 4% below our full-year forecast for 33.0 sen and 1% above consensus, after including M$33MM in one-off finance and tax expenses. The results were strong in the first full year following the restructuring into a stapled security in May-2013, with FY14 operating profit up 5%Y/Y versus our forecast for 3%Y/Y growth. Key drivers were 1) 21%Y/Y growth in hotel revenues on the reopening of the ballroom at the Mandarin Oriental post-refurbishment works, and 2) 5%Y/Y growth in retail revenues on the back of a 12%Y/Y rise in rental rates in 2013. Retail robust. Tenant sales at Suria KLCC rose more than 5%Y/Y, the strongest among the main malls, allowing KLCC to continue to achieve rental reversions of 12%Y/Y despite the more cautious consumer environment. This supports our view that pockets of more defensive spending could remain at the larger, integrated assets that can draw in higher footfall and in our view will outperform their smaller and standalone peers. In the recent results, the larger, integrated assets like Mid Valley Mall (IGB REIT) and Sunway Pyramid Mall (Sunway REIT) recorded retail sales of about 4%-5% versus flattish growth at Pavilion Mall (Pavilion REIT) and for the CMMT portfolio. Office as usual, occupancy risk low. Revenue contribution was stable, but PBT affected by a one-off cost relating to the refinancing of existing debt at lower rates, bringing average cost of debt from 4.7% to 4.5%. While we see a risk of oversupply in the segment over the next two years, with industry checks revealing an incoming supply to the Klang Valley of about 15% of existing stock, we feel the risk for KLCC is mitigated by its long-term contracts with tenants, and asset branding to international standards. The office segment contributed 44% to group revenue and 49% to group PBT, with three of its four assets on single-tenant, 15 year triple net leases to Petronas, pushing occupancy risk from external tenants back to its parent, while Menara ExxonMobil (8% of group NLA and 6.5% of revenue), which houses the regional headquarters of Exxon Mobil Corp, is on a single long-term lease that expires in Feb-2017. Hotel boosted by F&B. The reopening of the ballroom at the Mandarin Oriental resulted in a 23%Y/Y rise in F&B revenue, which contributes about 40% of segment revenues. Refurbishment works have now moved to the meeting rooms and hotel facilities and are expected to take about three months to complete during the current low season. Asia Pacific Equity Research 29 January 2015 Overweight Korea Aerospace Industries 047810.KS, 047810 KS Price: W43,650 4Q14 results in-line - differentiated earnings growth continues with high visibility Price Target: W50,000 4Q14 revenue/OP in-line, 2014 guidance fully met: KAI’s revenue/OP came in at W696B/W47B, in line with our expectations. Revenue was flat y/y, challenged by high 4Q13 base which was driven by faster-than-expected KUH revenue recognition. 4Q14 NP came in at W33B, better than our expectation, due to FX gains from USD receivables. The company ended 2014 with W2.3T revenue and W161B OP, fully achieving its annual guidance. Further strong growth guided for 2015: For 2015, management guided W3T revenue (+30% y-y) and W231 OP (+43% y-y, 7.7% OPM), in line with our forecasts. Given the historical track record, we are confident that KAI will continue to deliver its revenue guidance with high earnings visibility. The company plans to spend W268B on R&D and capex in 2015 (vs. W117B in 2014). The sharp increase in investment is mainly due to roll-over of previous year’s investment plans, as some of the major orders have been delayed to 2015. Delayed major orders will be met in 2015: KAI received W2.4T worth of new orders in 2014 (target W7.7T), due mainly to the delayed KFX (estimated W5T) and LAH/LCH development (estimated W600B) orders. However, management expressed strong confidence in receiving these orders this year, and suggested a W10T order target for 2015 (Defense W7.0T, Export W1.1T, Civil W1.9T). We expect KAI to receive the long-waited KFX order in 3Q15 and LCH/LAH order in 1H15. Maintain OW and RIV-based Jun-15 PT of W50,000: The stock trades at 29x 2015E EPS vs. 16x for global peers. We believe the premium is due to its 1) higher growth, 2) unique monopoly position, 3) strong replacement cycle in Korea, and 4) rising M/S within the global industry. These positive drivers remain intact, in our view, and we expect KAI to offer 35% EPS CAGR over the next three years vs. low-teen growth for global peers. In the near term, we expect: 1) stronger earnings visibility within the Korea machinery sector, and 2) new orders to support the share price. Key risks are volatility in new orders (-); cost overruns on existing projects (-); R&D cost increase (-); successful aircraft exports to the US (+) and new business opportunities (+). Korea Aerospace Industries (Reuters: 047810.KS, Bloomberg: 047810 KS) Year-end Dec FY12A FY13A FY14E FY15E Revenue (W bn) 1,535 2,016 2,305 3,108 Operating Profit (W bn) 126 125 163 231 Net Profit (W bn) 74 90 103 149 EPS (W) 761 924 1,056 1,527 Revenue growth 19.3% 31.4% 14.3% 34.9% EPS growth (5.0%) 21.4% 14.3% 44.5% ROE 8.6% 9.7% 10.3% 13.4% P/E (x) 57.3 47.2 41.3 28.6 P/BV (x) 4.8 4.4 4.1 3.6 EV/EBITDA (x) 24.2 23.2 19.7 14.4 EBIT Growth 20.3% (1.0%) 30.5% 42.3% ROA 4.1% 4.7% 4.8% 5.9% Dividend Yield 0.4% 0.4% 0.5% 0.5% Source: Company data, Bloomberg, J.P. Morgan estimates. FY16E 3,583 276 186 1,913 15.3% 25.3% 14.8% 22.8 3.2 12.1 19.2% 6.3% 0.5% South Korea Aerospace Wan Sun Park AC (82-2) 758-5722 [email protected] Bloomberg JPMA WPARK <GO> Scott YH Seo AC (82-2) 758 5759 [email protected] Bloomberg JPMA SEO <GO> Sangmyeong Kim (82-2) 758 5710 [email protected] J.P. Morgan Securities (Far East) Ltd, Seoul Branch Price Performance 44,000 40,000 W 36,000 32,000 28,000 Jan-14 Apr-14 Jul-14 Oct-14 Jan-15 047810.KS share price (W) KOSPI (rebased) Abs Rel YTD 9.7% 7.9% 1m 11.2% 10.0% Company Data 52-week Range (W) Market Cap (W bn) Market Cap ($ mn) Shares O/S (mn) Fiscal Year End Price (W) Date Of Price Free Float(%) 3M - Avg daily vol (mn) 3M - Avg daily val (W bn) 3M - Avg daily val ($ mn) KOSPI Exchange Rate Price Target End Date Price Target (W) 3m 5.9% 6.4% 12m 36.4% 35.9% 44,900-28,600 4,255 3,923 97 Dec 43,650 29 Jan 15 37.2% 0.28 11.26 10.4 1951.02 1,084.45 30-Jun-15 50,000 See page 7 for analyst certification and important disclosures, including non-US analyst disclosures. J.P. Morgan does and seeks to do business with companies covered in its research reports. As a result, investors should be aware that the firm may have a conflict of interest that could affect the objectivity of this report. Investors should consider this report as only a single factor in making their investment decision. www.jpmorganmarkets.com Asia Pacific Equity Research 29 January 2015 Overweight LG Electronics (066570 KS) Price: W62,600 29 Jan 2015 Price Target: W85,000 PT End Date: 31 Dec 2015 Relative weak 4Q results and muted 1Q15 guidance LGE reported relatively weak 4Q14 results mainly due to emerging currency depreciation, weak domestic smartphone market, and intensifying price competition in the TV business. Its NP turned to negative territory due to the loss (W164 billion) from discontinued operation (PDP). On the other hand, its MC (Mobile Communication) division managed to post a profit in three consecutive quarters despite shipment decline (-7% Q/Q) and depressed domestic smartphone market in 4Q14. Lackluster 1Q15 outlook: Management delivered a relatively cautious outlook (mid-single digit % top-line growth but OP decline on Y/Y) for 1Q15 pointing to EM currency weakness, which negatively impacts HE (TV) business that accounted for almost 50% of total OP in 1Q14. For MC, management guided both sales and OP will improve on Y/Y basis and expects profitability to meaningfully improve in 2Q15 along with new product launch. All about EM currencies: During an analyst meeting, management blamed EM currency weakness many times for most operations and its key products (especially, TV and Appliance) continue to see headwinds given that LGE has relatively high exposure to EM (i.e. Russia, Brazil etc.). Hence, we see limited visibility for its earnings outlook in 2015 and sustainability of the smartphone business is still a question mark. On the other hand, current share price is close to the bottom from a valuation standpoint given that the stock is trading at 0.8x FY15E book. Lack of near-term catalyst: We will review our estimates once we have more detail data. Meanwhile, we do not expect any near-term catalysts that could drive the stock higher given the lack of earnings visibility and new product launch in the smartphone business to be slated for 2Q15 at the earliest. Hence, we recommend investors wait for a better entry point. Table 1: LG Electronics – 4Q14 earnings review W in bn, YE-Dec. Revenue HE MC HA AE Innotek Others OP HE MC HA AE Innotek Others PBT NP Shipment (mn) Smartphone LCD TV 4Q13 14,556 5,431 3,592 2,839 720 1,174 802 214 153 (43) 83 7 30 (16) 20 (63) 3Q14 14,713 4,507 4,247 2,912 926 1,230 892 465 134 167 52 (3) 103 12 271 203 4Q14 15,272 5,427 3,783 2,880 781 1,455 946 275 2 67 85 4 61 56 57 (206) JPMe 15,312 5,715 3,714 2,913 758 1,317 895 366 115 76 88 10 73 3 360 259 Difference (%) 0% -5% 2% -1% 3% 10% 6% -25% -99% -11% -4% -63% -17% 1773% -84% n.a. Y/Y (%) 5% 0% 5% 1% 9% 24% 18% 28% -99% n.a. 2% -51% 101% n.a. 187% n.a. Q/Q (%) 4% 20% -11% -1% -16% 18% 6% -41% -99% -60% 64% n.a. -40% 384% -79% n.a. 13.2 8.6 16.8 7.1 15.6 9.0 16.0 9.0 -3% 0% 18% 5% -7% 27% Source: Company data, J.P. Morgan estimates. *Note: J.P. Morgan estimate is as of Oct-30-2014 published forecast Asia Pacific Equity Research 29 January 2015 Overweight Naver 035420.KS, 035420 KS Price: W736,000 LINE's robust monetization intact but disappointing MAU growth Price Target: W900,000 Naver reported weaker-than-expected 4Q results, with OP coming in 15% below our expectation. LINE’s gross revenue posted robust growth of 17% q/q and 80% y/y, in line with our expectation while LINE's net revenue growth came in softer than expected. LINE added 11mn MAU (total 181mn) in 4Q (vs. our expectation of +21mn MAU net addition). Overall, LINE’s monetization trend remained robust despite disappointing MAU growth momentum in 4Q. Management does not provide any detailed guidance/strategy for 2015 LINE. We are keeping our estimates pending further review. 4Q OP +27% y/y, sequentially below market expectations. Naver reported +17%y/y top-line growth in 4Q. We believe labor and marketing costs were well controlled in 4Q but OP missed 10%/15% of Street/JPM’s forecast, consolidated OP margin edged down to 26.1% in 4Q. LINE monetization growth momentum remains intact but lackluster MAU growth in 4Q. LINE gross revenue grew +17%q/q and +80%y/y to W384B in 4Q, in line with our expectation. Especially, strong LINE ad rev growth momentum (+43% q/q, +147% y/y) surprised on the upside, indicating that LINE is successfully positioning itself as a strong ad platform without monetizing Timeline traffic. Nevertheless, slower-thanexpected MAU growth in 4Q was a major disappointment. Lack of 2015 business guidance. Management does not provide much detailed guideline/strategy for LINE in 2015. The key points to watch for LINE include: (1) non-Japan user engagement growth trend beyond Tier 1 countries (Taiwan/Thailand/Indonesia), (2) new business development (LINE Music/Pay/etc), (3) potential investment to further drive LINE’s growth, (4) potential alliance with global Internet companies, (5) the resurgence of LINE IPO issue. We are keeping our estimates pending further review. Naver (Reuters: 035420.KS, Bloomberg: 035420 KS) Year-end Dec FY13A FY14E Revenue (W bn) 2,312 2,839 Operating Profit (W bn) 524 801 Net Profit (W bn) 326 468 Revenue growth 28.5% 22.8% Operating Profit growth 0.6% 52.8% EPS (net treasury) growth (40.2%) 43.6% ROE 19.3% 27.4% P/E (net treasury, x) 67.4 46.9 P/BV (x) 14.9 11.3 EV/EBITDA (x) 32.5 22.0 DPS (W) 813 664 Dividend Yield 0.1% 0.1% EPS (net treasury) (W) 10,927 15,690 Source: Company data, Bloomberg, J.P. Morgan estimates. FY15E 3,664 1,257 893 29.1% 57.0% 90.9% 37.4% 24.6 7.7 14.2 710 0.1% 29,948 FY16E 4,663 1,891 1,298 27.3% 50.5% 45.4% 37.3% 16.9 5.3 10.6 1,355 0.2% 43,543 South Korea Internet Stanley Yang AC (82-2) 758-5712 [email protected] Bloomberg JPMA YANG <GO> Sally Yoo (82-2) 758-5383 [email protected] J.P. Morgan Securities (Far East) Ltd, Seoul Branch Price Performance 900,000 850,000 W 800,000 750,000 700,000 650,000 Jan-14 Apr-14 Jul-14 Oct-14 Jan-15 035420.KS share price (W) KOSPI (rebased) Abs Rel YTD 3.4% 1.6% 1m 1.8% 0.6% Company Data 52-week Range (W) Market Cap (W bn) Market Cap ($ mn) Shares O/S (mn) Fiscal Year End Price (W) Date Of Price Free Float(%) 3M - Avg daily vol (th) 3M - Avg daily val (W bn) 3M - Avg daily val ($ mn) KOSPI Exchange Rate (W/$) Price Target End Date Price Target (W) 3m -5.4% -4.9% 12m 9.0% 8.5% 880,000658,000 21,946 20,237 30 Dec 736,000 29 Jan 15 71.5% 85.3 64.1 59.1 1,951 1,084 30-Jun-15 900,000 See page 8 for analyst certification and important disclosures, including non-US analyst disclosures. J.P. Morgan does and seeks to do business with companies covered in its research reports. As a result, investors should be aware that the firm may have a conflict of interest that could affect the objectivity of this report. Investors should consider this report as only a single factor in making their investment decision. www.jpmorganmarkets.com Asia Pacific Equity Research 29 January 2015 Neutral PTT Exploration & Production (PTTEP TB) Price: Bt111.00 28 Jan 2015 Price Target: Bt100.00 PT End Date: 31 Dec 2015 Higher than expected impairment; Dividend disappoints We expect PTTEP’s 4Q14 results to be taken negatively by the market with core earnings down c40%q/q, driven by high DD&A, exploration and finance costs and lower output costs. FY14 core earnings of Bt55bn are essentially in line with JPMe and consensus (Bloomberg) expectation. However, the company has disclosed an impairment loss of US$1bn for Montara and Mariana Oil Sand project, which was higher than expected with its legacy Cove Energy acquisition still not included in the impairment. PTTEP has also cut its dividend to Bt1.5/sh vs our estimate of Bt2.5/sh which implies a payout of 23% in 2H14 vs 41% in 1H14 and 41% in 2013 based on core net profit. Management will provide a business update later in the evening at 5:30PM. Table 1: PTTEP: 4Q14 earnings review Bt million (unless otherwise indicated) Production (kboe/day) Avg. Dubai ($/bbl) Petroleum sales EBITDA EBIT Profit before tax Tax, core business Core profit FX loss/gain Impairment loss Non-core tax Net profit Core EPS (Bt) Core tax rate 4Q13 300 $107 3Q14 325 $101 4Q14 347 $75 Y/Y 16% -30% Q/Q 7% -26% 4Q14E 345 $75 Y/Y 1% 0% 57,611 38,873 24,288 23,737 (14,678) 9,059 (2,095) (378) 654 7,240 2.28 62% 62,823 45,211 23,855 24,945 (8,601) 16,344 (1,060) 0 212 15,496 4.12 34% 59,082 39,632 14,124 17,244 (8,170) 9,074 (695) (32,794) 79 (24,336) 2.29 47% 3% 2% -42% -27% -44% 0% N/A N/A N/A -436% 0% -6% -12% -41% -31% -5% -44% N/A N/A N/A -257% -44% 59,152 41,239 16,714 19,099 (9,424) 9,675 (1,598) (24,998) 5,319 (11,602) 2.44 49% 0% -4% -15% -10% -13% -6% N/A N/A N/A N/A -6% Source: Company data, J.P. Morgan estimates % change is relative to 4Q14. Investment Thesis PTTEP is Thailand's second biggest upstream petroleum producer. The company is gas-focused with liquids (crude oil and condensate) accounting for less than 30% of total output. PTTEP is focused on oil and gas production in Thailand and nearby Myanmar. However, in recent years, the company has ventured into other prospective countries including Vietnam, Algeria, Canada and Australia. PTTEP’s current production capacity is ~340kBPD. With PTTEP’s upstream bias, we see now more near-term downside risks not only from lower oil prices, but a reassessment of legacy deals which are likely to drag on profitability, high-cost fields such as Montara and potential impairment risks for its stake in Mozambique post Cove Energy transaction. Valuation We have a Neutral rating on PTTEP with a Dec-15 price target of Bt100, based on our DCF valuation (WACC of 8.0%, long-term oil price of US$90/bbl). Summary value (US$MM) Proved reserves Pipeline net assets, at book 13,914 100 Asia Pacific Equity Research 29 January 2015 Neutral PTT Exploration & Production (PTTEP TB) Price: Bt111.00 28 Jan 2015 Price Target: Bt100.00 PT End Date: 31 Dec 2015 Potential net loss; impairment risks and dividend cut PTTEP is expected to report 4Q14/FY14 this evening (29 Jan), and we forecast a net loss, given lower output prices and potential impairment losses for Montara and Mariana Oil Sand projects. With PTTEP’s upstream bias, we see now more near-term downside risk not only from lower oil prices, but a re-assessment of legacy deals, which are likely to be a drag on profitability, high-cost fields such as Montara and potential impairment risks for its stake in Mozambique post the Cove Energy transaction. We maintain Neutral with Dec-15 PT of Bt100/sh (refer to our regional update). Record production in 4Q14; high DD&A continues: We forecast PTTEP 4Q14 core earnings down c40% q/q at Bt10 bn due to sharply weaker oil prices, exploration write-offs, higher DD&A due to higher sales from Montara and a higher effective tax rate. PTTEP reported record high production of c345 kboe in 4Q14, due to c315 mmscfd output from Zawtika and higher sales from Montara. However, Montara is expected to be a drag on opex and DD&A in 4Q. PTTEP may write-off c10 exploration wells worth cUS$100 mn in 4Q. PTTEP continued its 3-4 month forward hedging strategy and hedged c8mn liquids output at cUS$9095/bbl, which is likely to partially offset downside from lower ASPs. PTTEP may also report a higher effective tax rate due to THB depreciation. We expect PTTEP to cut 2H14 dividend to Bt2.5/sh from Bt3/sh in 2H13 (consensus estimates range from Bt1-3/sh). Potential US$800-900 mn impairment losses: PTTEP is likely to report severe impairment losses for high cost fields like Montara (US$1.7 bn book value) and Mariana Oil Sand (US$2bn book value) in 4Q, given a deteriorated LT oil price outlook and delayed production in the case of Mariana. We estimate overall impairment at cUS$800-900 mn. We do not rule out potential impairment for Mozambique assets and further adjustments for Montara / Mariana, should oil prices decline substantially from current levels. Table 1: PTTEP: 4Q14 earnings forecast Bt million (unless otherwise indicated) Production (kboe/day) Avg. Dubai ($/bbl) Petroleum sales EBITDA EBIT Profit before tax Tax, core business Core profit FX loss/gain Impairment loss Non-core tax Net profit Core EPS (Bt) Core tax rate 4Q13 300 $107 3Q14 325 $101 4Q14E 345 $75 Y/Y 15% -30% Q/Q 6% -26% FY13 293 $106 FY14E 322 $96 Y/Y 10% -9% 57,611 38,873 24,288 23,737 (14,678) 9,059 (2,095) (378) 654 7,240 2.28 62% 62,823 45,211 23,855 24,945 (8,601) 16,344 (1,060) 0 212 15,496 4.12 34% 59,152 41,239 16,714 19,099 (9,424) 9,675 (1,598) (24,998) 5,319 (11,602) 2.44 49% 3% 6% -31% -20% -36% 7% N/A N/A N/A -261% 7% -6% -9% -30% -23% 10% -41% N/A N/A N/A -176% -41% 220,337 158,895 108,544 105,950 (47,366) 58,584 (2,893) (378) 654 55,967 14.76 45% 243,413 173,749 91,518 91,975 (36,790) 55,185 (2,500) (23,701) 5,240 34,225 13.90 40% 10% 9% -16% -13% -22% -6% N/A N/A N/A -39% -6% Source: Company data, J.P. Morgan estimates % change is relative to 4Q14. Asia Pacific Equity Research 29 January 2015 Overweight Samsung Electro-Mechanics (009150 KS) Price: W64,400 29 Jan 2015 Price Target: W72,000 PT End Date: 31 Dec 2015 4Q Results: Good Impression from Swing to Profit, Buyback Announcement SEMCO swung to profit at the operating level in 4Q, also avoiding a red-ink result for 2014 as a whole. We continue to expect sharp profit rebound in 2015 as earnings should continue to recover in 1Q with support from the quicker-thanexpected uptake of Galaxy S6 components and the likelihood that the new plant in Vietnam will begin fully contributing from 2H. SEMCO also announced a share buyback with the results release. The buyback will encompass two million shares (2.7% of shares outstanding) and KRW127.8 billion, with execution scheduled for January 30 to April 29). 4Q results: Operating profit totaled KRW34 billion, a strong swing to the black from 3Q’s KRW69 billion loss. As we expected, SEMCO managed to avoid a loss for 2014 as a whole, recording profit of KRW1.7 billion (our forecast was profit of KRW10 billion; the Bloomberg consensus was a loss of KRW45 billion). In addition to the Korean won weakening versus the dollar, earnings benefited from new smartphones such as the Galaxy Note 4 and the iPhone 6. In terms of products, the earnings rebound was apparently driven by camera modules with optical image stabilization, high value-added flip-chip chip-scale packages, and MLCCs. BPS rose sharply: Net profit in FY2014 totaled KRW502.7 billion, bolstered by the swing to profit at the operating level and the sale of Samsung SDS shares. End-December 2014 shareholders’ equity rose to KRW4,642.8 billion as a result, a 15% increase versus end-2013. Meanwhile, we estimate that the announced buyback of two million shares will boost BPS to about KRW64,000, roughly on par with the current share price. That said, in our view the current share price does not adequately reflect SEMCO’s prospects for earnings recovery from FY2015 onward. A results briefing for analysts is scheduled for January 30, 16:00 Korea time. Figure 1: Quarterly Earnings Results and Outlook Won bn SEMCO Sales FY2014E 1Q 2Q 3Q 4Q Actual 4QE FY2015E FY2016E 1,729 1,861 1,711 1,833 1,857 7,150 7,700 8,100 ACI 398 397 411 423 429 1,635 1,770 1,880 LCR 465 465 474 479 487 1,890 1,950 2,040 OMS 488 574 504 576 584 2,150 2,370 2,520 CDS 375 416 322 340 357 1,470 1,590 1,650 15 21 -69 34 42 10 240 320 Profit Before Taxes 8 29 -82 684 - 1,040 370 320 Net Profit 2 14 -71 558 - 770 265 230 Operating Profit Source: Company data and J.P. Morgan estimates Asia Pacific Equity Research 29 January 2015 Underweight Samsung Engineering 028050.KS, 028050 KS Price: W35,350 4Q14 results: In line, but contraction continues Price Target: W31,000 Samsung Engineering (SEG)’s 4Q14 results were largely in line with our expectations, but its low-margin trends remained unchanged (OP margin at 1.0%). We see a continued contraction of its business as seen from its staff restructuring, project completion delays, and decreased 2015 revenue target. Coupled with the sluggish order environment affected by low oil prices, we hardly expect a sharp rebound in the company’s operations in the near term. We maintain our Underweight rating on the stock. In-line results, but weak bottom line. Sales came in at W2.3tn (-15% y/y) with OP of W22bn (OPM of 1.0%), which was largely in line with our estimates. Overseas GP margin fell to -2.9% (vs. 4.1% in 3Q14), mainly on the back of additional provisions from Saudi Shaybah project (W35bn). One-off impairment loss of W41bn (POSCO Plantec shares) pressured the company’s bottom line, resulting in a net loss of W8bn. Contraction continues. SEG guided its 2015 sales at W8.0tn, down 10% y/y from W8.9tn in 2014. The negative sales growth is mainly on the back of decreased orderbook (W13tn in 4Q14 vs. W16tn in 2013) and completion delays of overseas projects. Such contraction may seem disappointing in the near term, but we believe this can be a long-term positive driver, as it implies SEG’s focus has changed from growth to earnings maintenance. Conservative 2015 guidance. Among the company’s W7tn order target, SEG commented that around half of the orders are secured (including W2tn of Samsung group orders). However, we think lowered oil prices will increase uncertainties to its order achievements, as seen from the recent project delays/cancellations (i.e., Qatar, Saudi Arabia). Meanwhile, the company also targeted LNG plant orders (Texas LNG, Canada Petronas LNG), which could become a new opportunity for SEG. Maintain UW with PT of W31,000. The key priority of SEG will be the stability of its bottom line, due to the continued uncertainty of overseas operations. We reiterate our cautious view on SEG. Samsung Engineering Co. Ltd (Reuters: 028050.KS, Bloomberg: 028050 KS) Year-end Dec FY13A FY14E FY15E Revenue (W bn) 9,806 8,639 8,163 Operating Profit (W bn) (1,028) 166 241 Net Profit (W bn) (707) 79 136 EPS (W) -17,677 1,971 3,402 BVPS (W) 22,663 24,456 27,449 Revenue growth (14.3%) (11.9%) (5.5%) EPS growth (235.0%) (111.2%) 72.6% ROE (53.4%) 8.4% 13.1% P/E (x) NM 17.9 10.4 P/BV (x) 1.6 1.4 1.3 EV/EBITDA (x) NM 10.6 7.6 Dividend Yield 0.0% 0.8% 1.1% ROA (12.2%) 1.4% 2.5% FY16E 8,460 307 191 4,781 31,729 3.6% 40.6% 16.2% 7.4 1.1 5.6 1.4% 3.5% South Korea Construction Sokje Lee AC (82-2) 758-5729 [email protected] Bloomberg JPMA SOKJELEE <GO> Minsung Lee (822) 758-5728 [email protected] J.P. Morgan Securities (Far East) Ltd, Seoul Branch Price Performance 80,000 W 60,000 40,000 20,000 Jan-14 Apr-14 Jul-14 Oct-14 Jan-15 028050.KS share price (W) KOSPI (rebased) Abs Rel YTD -6.7% -8.5% 1m -7.1% -8.3% Company Data Shares O/S (mn) Market Cap (W bn) Market Cap ($ mn) Price (W) Date Of Price Free Float(%) 3M - Avg daily vol (mn) 3M - Avg daily val (W bn) 3M - Avg daily val ($ mn) KOSPI Exchange Rate Price Target End Date Price Target (W) 3m -42.1% -41.6% 12m -50.7% -51.2% 40 1,414 1,304 35,350 29 Jan 15 65.4% 0.51 20.73 19.1 1951.02 1,084.45 31-Dec-14 31,000 Source: Company, Bloomberg, J.P. Morgan estimates. NP, EPS, ROE based on owners' NP; BPS based on owners' parent equity. See page 8 for analyst certification and important disclosures, including non-US analyst disclosures. J.P. Morgan does and seeks to do business with companies covered in its research reports. As a result, investors should be aware that the firm may have a conflict of interest that could affect the objectivity of this report. Investors should consider this report as only a single factor in making their investment decision. www.jpmorganmarkets.com Asia Pacific Equity Research 29 January 2015 Neutral Samsung Heavy Industries 010140.KS, 010140 KS Price: W18,800 4Q14 results: Harsh test of its offshore bias Price Target: W26,000 Samsung Heavy Industries (SHI) reported worse-than-expected results, mainly from its offshore business. Delays in drillship delivery and low margins of its Egina and Ichthys projects resulted in a revenue decline. We believe a renewed focus on commercial ships will be the only solution, but it will take time for SHI to solve the bottleneck issues in offshore structures. We reiterate our Neutral rating with a Dec-15 PT of W26,000. Worse-than-expected results. 2014 revenue declined 13% YoY, with an 80% fall in operating profit (1.4% OP margin vs. 6.2% in 2013). Despite the major write-off in 1Q14, SHI failed to show a notable improvement in 4Q14. Management said the falling margin came from 1) a weaker sales contribution from drillships vs. rising revenue recognition of Egina & Ichthys projects, and 2) delays in drillship delivery. All started with its offshore bias. SHI has been focusing on its offshore business for years, but the key burden has been a lack of skilled engineers and designers. Offshore projects require a 2-3 times greater number of designers than commercial ships to generate the same revenue. Securing such resources within 2-3 years was tough, and shifting resources from commercial ship division was not enough. Return to commercial ships the only solution. We have been arguing that a commercial ship focus is the only solution for SHI. Furthermore, the tanker market is booming and SHI can find enough margin opportunity. A commercial ship focus would give SHI better margins than offshore structures together with proper utilization of its facilities. But it will take some time as SHI is burdened with the higher cost base from its offshore bias, and it will have to wait for shipbuilding designers to return after they complete offshore projects. Maintain Neutral with Dec-15 PT of W26,000. We maintain our Neutral rating, as we believe SHI’s slower operations as a result of offshore projects will continue in the near term. Samsung Heavy Industries (Reuters: 010140.KS, Bloomberg: 010140 KS) Year-end Dec FY13A FY14E FY15E Revenue (W bn) 14,835 14,043 14,079 Operating Profit (W bn) 914 191 568 Net Profit (W bn) 632 121 361 EPS (W) 2,737 523 1,564 BVPS (W) 25,308 25,494 26,588 Revenue growth 2.4% (5.3%) 0.3% EPS growth (20.6%) (80.9%) 199.2% ROE 11.4% 2.1% 6.0% P/E (x) 6.9 36.0 12.0 P/BV (x) 0.7 0.7 0.7 EV/EBITDA (x) 6.0 15.7 8.4 Dividend Yield 2.7% 1.6% 2.7% ROA 3.7% 0.7% 2.2% FY16E 14,529 759 551 2,384 28,503 3.2% 52.4% 8.7% 7.9 0.7 6.5 2.7% 3.3% South Korea Ship Building & Repairs Sokje Lee AC (82-2) 758-5729 [email protected] Bloomberg JPMA SOKJELEE <GO> Minsung Lee (822) 758-5728 [email protected] J.P. Morgan Securities (Far East) Ltd, Seoul Branch Price Performance 40,000 35,000 W 30,000 25,000 20,000 15,000 Jan-14 Apr-14 Jul-14 Oct-14 Jan-15 010140.KS share price (W) KOSPI (rebased) Abs Rel YTD -5.8% -7.6% 1m -6.9% -8.1% Company Data Shares O/S (mn) Market Cap (W bn) Market Cap ($ mn) Price (W) Date Of Price Free Float(%) 3M - Avg daily vol (mn) 3M - Avg daily val (W bn) 3M - Avg daily val ($ mn) KOSPI Exchange Rate Price Target End Date Price Target (W) 3m -27.0% -26.5% 12m -44.2% -44.7% 231 4,343 4,004 18,800 29 Jan 15 71.1% 1.82 40.73 37.6 1951.02 1,084.45 31-Dec-15 26,000 Source: Company data, Bloomberg, J.P. Morgan estimates. See page 8 for analyst certification and important disclosures, including non-US analyst disclosures. J.P. Morgan does and seeks to do business with companies covered in its research reports. As a result, investors should be aware that the firm may have a conflict of interest that could affect the objectivity of this report. Investors should consider this report as only a single factor in making their investment decision. www.jpmorganmarkets.com Asia Pacific Equity Research Sands China (1928 HK) Unexiciting 4Q, as expected 29 January 2015 Overweight Price: HK$39.65 28 Jan 2015 Price Target: HK$52.50 PT End Date: 31 Dec 2015 Adjusted EBITDA fell 12% qoq and 15% yoy to US$713m in 4Q. This is 1/2% below JPMe/consensus, slight miss but expected. Regarding dividend, Sands China, like its parent LVS, is now committed to increasing its regular dividend each year (absolute term, not payout, in our view), which it believes is more reliable than special dividends. Overall, there was no surprise from the result. See Table 1-3 for our detailed analysis on operating metric. The Good: (1) Mass outperformance: Group-wide mass GGR fell 9% qoq in 4Q, better than the peers’ c.11% decline (on like-for-like basis); (2) A record non-gaming: Non-gaming revenues grew 10% qoq and 6% yoy to a record US$427m, accounting for 17% of its gross revenues (vs. 13% a year ago); we estimate this high-margin business has generated c.25% of the group’s EBITDA in 4Q, nearly double the size of VIP profits; and (3) Regular DPS will keep rising. A commitment to “grow” regular dividend every year (5.0% yield for CY15E, based on last closing price) could provide more predictable cash returns to shareholders going forward, potentially reducing volatility in shares to a degree. The bad: (1) A slight miss vs. expectations, albeit somewhat expected; (2) Weaker margin (especially at Venetian): adjusted EBITDA margin edged down to 28.0% (based on gross revenues) from a record 28.7% in 3Q. Favourable mix impact (mass/non-gaming was 67% of sales, vs. 64% in 3Q) was offset by negative operating leverage and increased competition in prem mass; (3) Weak prem mass: prem mass GGR fell 18% yoy, significantly weaker than 2% decline in its base mass GGR, despite having 27% more tables. As a result, Sands’ prem mass table yield edged down further to US$15.5k/day in 4Q, 40% below its peak US$26.0k in 1Q14 (or, 12% qoq drop from US$17.6k in 3Q) (Table 1); (4) Even weaker VIP: Sands’ VIP GGR dropped 18% qoq in 4Q (vs. the industry’s -7%) and its VIP table yield fell 20% qoq to only US$24.0/day; and (5) Parisian now slated for “sometime in 2016”, vs. March 2016 for its previous fullopening guidance; we view the delay was caused from construction permit issue (now fully resolved) and is not a commitment issue. Also, the new target is in-line with JPMe (3Q16E). Other takeaways from the call: (1) Executive search. Sands China is conducting a search for its president and COO, while the CEO position will remain with Mr. Sheldon Adelson; (2) Table constraints? Management believes gaming table is not a constraint anymore (at least at this stage) given soft demand; (3) Smoking ban. The Macau government appears to be making its final decision on a smoking ban, according to management. The bottom line: Obviously unexciting – to say the least – quarter, but we think most negatives were well highlighted in advance, hence not a surprise. Going into 2015, we note two new (and arguably better) properties are opening in its neighborhood, which will likely increase competition on Cotai, which has been so far a stronghold of Sands. Sands trades at 18x 2015E P/E (based on Bloomberg’s 28-day consensus). Asia Pacific Equity Research 29 January 2015 Overweight Sesa Sterlite SESA.NS, SSLT IN Price: Rs201.45 Strong results driven by Ally and Cu Tc/Rc; Ally prod guidance sharply higher and implies upside risk to FY16 Price Target: Rs265.00 SSLT reported EBITDA (Rs61.5bn v/s Rs58.5bn consensus) and PAT (Rs15.9bn v/s Rs14.1bn consensus) beat driven by strong results at the copper smelting and aluminum segments (which saw costs decline sharply q/q). Operational news flow continues to improve as iron ore mining leases got renewed in Goa, and Karnataka (forest clearance also received), while in power the consent to operate for 1200MW was received and hence Unit 1 (commercial) is under commissioning while Unit II (captive) would be commissioned in Q1, allowing for further ramp up ally production. From here, while the commodity price environment is a headwind, the regulatory environment is improving. SSLT at the parent entity for the last two quarters has EBITDA/Interest at 1.3x/1.7x and this should only improve as iron ore, power and ally segments improve. We remain OW on SSLT. Sharp improvement in copper and ally drive EBITDA beat: Copper reported another record EBITDA at Rs5.3bn (+15% q/q) driven by higher product realizations and continued strong Tc-Rc. Ally segment reported +86% y/y higher EBITDA at Rs8bn v/s JPMe Rs5.1bn driven by lower costs, mainly coal. Zinc and oil were broadly in line, while power segment continued to suffer from evacuation and demand issues with PLF only at 41%. The TSPL 1980MW power plant saw the first unit being capitalized in the December quarter. Iron ore segment was EBITDA positive with only pig iron operating. Regulatory news flow continues to improve: Iron ore leases have been renewed in Goa and Karnataka and the receipt of forest approvals allows for 2.3MT annual mining at Karnataka to start (and thus EBITDA increase). We expect Goa mining to also start in 2HFY16 once the export tax on lower grade ores is removed. As per SSLT, at current iron ore prices, post all the duties, levies, and grade discount, ASP would be $25/t and CoP pre ban was $25/t and hence export duties need to be removed. The ramp up of the power plant at Korba should allow higher ally production. SSLT remains a key beneficiary of any potential improvement in the coal availability post the coal block auctions as the ~$100/t q/q reduction in Ally CoP shows. Materially higher Aluminum production growth forecast implies upside earnings risk for FY16: SSLT expects to exit FY16 with the 325Kt smelter at BALCO fully ramped up. More importantly, SSLT guided that 2 lines of 4 lines (1.25MT ally capacity) would be ramped up in FY16. We see material upside risk for our FY16/17 total ally prod of 1.05/1.27MT post the company’s comments today. Sesa Sterlite (Reuters: SESA.NS, Bloomberg: SSLT IN) Rs in mn, year-end Mar FY13A FY14A FY15E Net Sales (Rs mn) 757,632 661,524 728,764 Net Profit (Rs mn) 148,606 62,985 58,555 EPS (Rs) 50.12 21.24 19.75 Net Profit growth (%) 141.9% (57.6%) (7.0%) ROE 22.8% 8.8% 7.8% P/E (x) 4.0 9.5 10.2 P/BV (x) 0.9 0.8 0.8 EV/EBITDA (x) 4.7 7.8 5.8 Source: Company data, Bloomberg, J.P. Morgan estimates. FY16E 788,603 70,629 23.82 20.6% 8.8% 8.5 0.7 5.1 FY17E 875,583 90,325 30.46 27.9% 10.3% 6.6 0.7 4.1 India Metals & Mining Pinakin Parekh, CFA AC (91-22) 6157-3588 [email protected] Bloomberg JPMA PAREKH <GO> J.P. Morgan India Private Limited Dinesh S. Harchandani, CFA (91-22) 6157-3583 [email protected] J.P. Morgan India Private Limited Neha Manpuria (91-22) 6157-3589 [email protected] J.P. Morgan India Private Limited Daniel Kang (852) 2800 8570 [email protected] J.P. Morgan Securities (Asia Pacific) Limited Price Performance 320 280 Rs 240 200 160 Jan-14 Apr-14 Jul-14 Oct-14 Jan-15 SESA.NS share price (Rs) BSE30 (rebased) Abs Rel YTD -8.1% -16.0% 1m -6.4% -14.7% Company Data 52-week Range (Rs) Market Cap (Rs mn) Market Cap ($ mn) Price (Rs) Date Of Price 3M - Avg daily vol (mn) 3M - Avg daily val ($ mn) BSE30 Price Target End Date Price Target (Rs) 3m -21.1% -30.6% 12m 4.1% -39.7% 318.40-168.85 597,299 9,727 201.45 29 Jan 15 5.09 18.4 2,9559.18 31-Mar-16 265.00 See page 17 for analyst certification and important disclosures, including non-US analyst disclosures. J.P. Morgan does and seeks to do business with companies covered in its research reports. As a result, investors should be aware that the firm may have a conflict of interest that could affect the objectivity of this report. Investors should consider this report as only a single factor in making their investment decision. www.jpmorganmarkets.com Clients should contact representatives and execute transactions through a J.P. Morgan subsidiary or affiliate in their home jurisdiction unless governing law permits otherwise. Asia Pacific Equity Research Sumitomo Mitsui Trust Holdings (8309) (8309 JT) 3Q Results: Buybacks Announced, Writebacks & Fees Continue to Support 29 January 2015 Overweight Price: ¥411 29 Jan 2015 Price Target: ¥580 PT End Date: 30 Dec 2015 SMTH reported Apr-Dec net income of ¥126.5bn (vs. cons ¥125.8bn) or 84% progress on FY CoE ¥150bn, and became the second major bank to announce share buyback (¥20bn, 1% of shares or 10bp of capital, Jan to June 2015). We think this is a forward move considering their target CET1 ratio of 10% is not yet in the bag (we estimate ~8.7% fully-phased at Dec14, unch’d from Sep-14 due to buyback of pref shares on Oct 1), although the shift to A-IRB will fill most of the gap at Mar15. More importantly, the buyback reflects the bank’s willingness to improve shareholder return and shows the bank’s confidence in its business & earnings. Key supports to be aware of going into 4Q are: 1) ¥9bn Q/Q improvement as system costs from 3Q fall off, 2) FY-end seasonality for a rise in corporate real estate transactions which has been a weak area this year and 3) ¥16bn cushion in credit costs with ¥21bn writeback YTD vs. ¥5bn CoE. The business is not immune to macro headwinds of low yields & sluggish demand, but the bank has been able to defend its NIM relatively well (-1bp Q/Q) due to a fall in deposit yield, and ultimately impact from NIM decline is offset by fees from IT sales which is still going strong at +10% Y/Y driven by wrap funds & insurance. Fee income was in line with expectations overall, but details were mixed. About 60% of domestic fees are from IT & insurance sales, and this is also the portion that continues to grow fast at +12% Y/Y, or 78% of progress to FY plans. On the other hand, the factors behind a soft real estate brokerage in 1H continued to be present in 3Q, with some corporates seeming to delay sale of property on expectation of real estate price rise & improving earnings. Although real estate fees are up +¥0.5bn 3Q/3Q, plans were a more aggressive +¥5.7bn Y/Y, so some upside from IT & insurance sales will offset this. Another offsetting strength is market gains with the bank taking ¥29bn bond gains in 3Q, having now taken profit on almost half their UST portfolio YTD. Loan growth was a little disappointing in 3Q after a strong 1H, with overseas loans at +4.8% Q/Q despite 10% yen depreciation over that time. Part of this was a strong base (1H +15% with just 1/3 from FX), another part was seasonal with Japanese corporate demand tending to focus in 2Q and 4Q, but another part seems to be repayments from nonJapanese corporates. A silver lining is that NPL ratio improved sharply from 0.86% Sep-14 to 0.70% Dec-14, with Substandard and Doubtful loans decreasing by about a fifth, which ties into the ¥6bn net writeback in Oct-Dec that will be an earnings cushion into 4Q. Finally, commodity exposure was ¥270bn or just 4% of overseas portfolio (¥190bn non-Japanese / ¥80bn Japanese), most of which has ECA guarantee or sponsor support, and there was no Russia or peripheral European exposure except ¥6bn in Spain. Overall SMTH remains one of the highest quality retail & corporate portfolios around, and we expect credit costs to come in well within CoE, supporting earnings & capital into 4Q, justifying today’s buyback. Asia Pacific Equity Research 29 January 2015 Underweight Wijaya Karya (WIKA IJ) Price: Rp3,675 28 Jan 2015 Price Target: Rp2,500 PT End Date: 31 Dec 2015 Analyst meeting takeaways WIKA analyst meeting takeaways and our views: Orderbook and new contract forecasts are inline. Management’s forecast guidance on orderbook and new contracts are in line with our estimates. 52% of the new contracts this year are expected from the government. WIKA is optimistic that the signing of the government contracts will start in April FY15; and the current e-catalogue to build and design system has proved to successfully bypass the bureaucracy. Asset investments to continue. We believe that asset investment is adding pressure to WIKA’s balance sheet at a time when the balance sheet needs to cope with strong contracts growth outlook. WIKA intends to participate in equity for infrastructure assets to grow recurring income. The requirement for the investment is minimum IRR of 5% above WACC and a payback period between 7 and 10 years. So far, investment in power plant projects has been successful but tollroads investment performance has been poor. Multiple corporate actions. WIKA’s cash flow from operations will turn negative for the first time since the equity listing of its subsidiary WIKA Realty (85% owned by WIKA and 15% owned by employees’ coops) is scheduled in August 2015. Equity listing of subsidiary WIKA Gedung (99% owned by WIKA) is planned in FY16. Equity rights issuance for WIKA is planned in FY17 pending government approval. Reiterate UW, PT Rp2,500. We are concerned about the heightened competition landscape in Indonesia E&C. We note the higher participation of foreign E&Cs in the tendering for infrastructure projects. Weak energy prices might provide temporary support for profitability; however, there is an increased execution risk for oil and gas contracts. We prefer pure E&C, i.e. STEC in Thailand, within ASEAN. Table 1: WIKA's management guidance versus JPM estimates Company guidance 30.6 54.5 16.4 0.77 FY15E (Rp trn) New contract Orderbook ex. JV Revenue ex. JV Net income JPM estimates 30 55 16.5 0.68 Source: J.P. Morgan estimates, Company data. Figure 1: ASEAN E&C P/Orderbook multiples convergence 0.9 0.8 0.7 0.6 0.5 0.4 0.3 0.2 0.1 FY08 FY09 FY10 WIKA Source: J.P. Morgan estimates. FY11 FY12 CK FY13 STEC FY14E FY15E difference 2% -1% -1% 12% Emerging Markets Equity Research 29 January 2015 Emerging Markets Strategy Dashboards Emerging Markets Equity Strategy Team Recommendations Adrian MowatAC Pedro Martins Junior David Aserkoff Rajiv Batra Sanaya Tavaria Emerging Markets LatAm CEEMEA Emerging Markets Emerging Markets [email protected] [email protected] [email protected] [email protected] [email protected] (852) 2800 - 8599 (55-11) 4950-4121 (44-20) 7134-5887 (91-22) 6157-3568 (1-212) 622-5469 J.P. Morgan Securities (Asia Pacific) Limited Banco J.P. Morgan S.A. J.P. Morgan Securities plc J.P. Morgan India Private Limited J.P. Morgan Securities LLC Luis Oganes Global Emerging Markets [email protected] (1-212) 834-4326 J.P. Morgan Securities LLC Global Emerging Markets Research OW: China, India, Thailand, Indonesia, The Philippines, Turkey UW: Brazil, Chile, Russia, CE3, Malaysia, UAE and Qatar KEY TRADES: Divided asset class QE with Chinese characteristics (OW China) Oil slick or surge(OW India, Thailand, Turkey-UW Russia, Brazil and Malaysia) Winners needing growth (India, Indonesia, Thailand, Turkey) For full list of J.P. Morgan equity strategists please see the directory on the back page Key Changes Market performance to 28 January 2015 • Year to date: MSCI Emerging Markets 3% outperforming MSCI World by 3.7% • Year to date: MSCI EM Asia 4.4% outperforming MSCI Emerging Markets by 1.5% • Top three markets YTD in US$: India, Egypt and Philippines • Bottom three markets YTD in US$: Poland, Colombia and Peru J.P. Morgan's revisions to 2015 GDP forecasts • Negative: Developed Markets 2.3%[2.4%] J.P. Morgan's revisions to central bank policy rate forecasts • Turkey: Current 7.75%[8.25%], Last change 20 Jan 15 -50 bp [17 Jul 14 50bp] Forecast Next change Feb 15 -25bp [Feb 15 -50bp] Mar 15 7.50%, Jun 15 7.50%, Sep 15 7.50%, Dec 15 7.50% Liquidity Monitor • Top three markets by increase in ADTV (1 wk Avg. vs 3MMA): Egypt (US$0.2bn, up 100%), Malaysia (US$0.8bn, up 60%) and Philippines (US$0.3bn, up 50%) • Top three markets by increase in Daily Velocity Ratio (1 wk Avg. vs 3MMA): Egypt, Malaysia, and Indonesia Sector performance • Year to date: MSCI EM Information Technology 7.6% outperforming MSCI Emerging Markets by 4.7% • Year to date: MSCI EM Utilities -1% underperforming MSCI Emerging Markets by 4% • Top three key market sectors YTD in US$: China Information Technology, India Financials and China Telecommunication Services • Bottom three key market sectors YTD in US$: Brazil Materials, Brazil Energy and Mexico Materials Table of Contents Page # Regional Summary Market Performance Liquidity Monitor Monitoring Inflation Market Drivers Cross-section Earnings Growth Earnings Revisions Sector-Country PE Matrix Valuation Distribution Demand Classification Equities relative to Bonds Economic Momentum Policy Rates Forecast Currency Forecasts Credit Risk Emerging Market Balance Sheets Emerging Market in Perspective Emerging Capital Market Index Weightings 2 3 4 5 6 7 8,9,10 11 12 13 14 15 16 17,18 19 20 21 22 23 Please see Key Trades and Risks: Emerging Markets Equity Strategy, Mowat et al, 13 January 2015, for our latest emerging markets equity strategy. Demand classification sector performance • YTD: Global Capex 4.8%, Global Consumer 4.6%, Domestic Demand 4.1% and Global Price Takers 3.6% See page 24 for analyst certification and important disclosures, including non-US analyst disclosures. J.P. Morgan does and seeks to do business with companies covered in its research reports. As a result, investors should be aware that the firm may have a conflict of interest that could affect the objectivity of this report. Investors should consider this report as only a single factor in making their investment decision. www.jpmorganmarkets.com Asia Pacific Equity Research 29 January 2015 Philippine Strategy Flash 2014 GDP growth surprise sets tone for better 2015E growth The upward revision of 2015E GDP growth forecasts following the better-than-expected 4Q14 GDP growth print and the material monetary policy flexibility amid easing inflation and softness in oil prices reinforces the positive macro story of the Philippines; we expect this to continue supporting the strong performance of the equity market. We reiterate our OW call on the Philippines with preference for consumer, gaming, and consumer-focused property names. 2014 GDP growth surprises on the upside, paves the way for 2015E GDP growth upgrades. A recovery in gov’t spending (+9.8% oya), above 5% oya in private consumption, and a strong 8.1% oya investments growth led to the better-than-expected 6.9% oya GDP growth in 4Q14. This lifted full year growth to 6.1% oya, the second fastest growth rate in Asia (JPMe: 5.2% oya, consensus: 6.0% oya). The JPM Economics Team revised their 2015E GDP growth estimate from 5.4% oya to 6.4% oya. Please see Sin Beng Ong’s Philippines: Bumper 4Q14 GDP sets tone for positive 2015 – oil provides material policy flex, penciling in 2H15 cut for more details. Bangko Sentral ng Pilipinas (BSP), on the other hand, stated that “it will refresh its forecasts to include the impact of the strong 2014 GDP growth, oil price expectations, shifts in interest differential, and global investment sentiment.”. Table 1: Philippines Quarterly GDP Breakdown Source: J.P. Morgan Economics Research. Recovery of gov’t spending is a welcome development. In our view, the key highlight of the GDP print was the recovery of gov’t spending in 4Q14 which assuages concerns regarding the potential pull factor from the gov’t infra spending bottlenecks. The government has explicitly committed that it has already taken concrete measures to accelerate spending this year and is guiding that it will perform better over the next twelve months. We remain confident on growth over the next few quarters as consumption remains robust and the government is expected to accelerate spending ahead of the 6-month moratorium on project approvals prior to the May 2016 national elections. Asia Pacific Equity Research 30 January 2015 China City Gas Distributors News of potential gas cost cut a positive Gas cost cut in 1Q2015? As reported by Bloomberg, Chi Guojing, Secretary General at China Gas Association, China may reduce prices for incremental natural gas supplies in 1Q2015 in light of the narrowing price gap between natural gas and other competing fuels (e.g., LPG and fuel oil). This follows recent news (Bloomberg, Jan 9) where another industry expert (Bai Jun, Vice Chairman of China Natural Gas Industry Association) also expected a price cut on incremental gas supplies (Rmb0.15/m3, or 5-6%), while prices for existing gas supplies will increase by Rmb0.3/m3 (~10%) to align with incremental gas supplies. Background: The NDRC raised city gate natural gas prices in July 2013 where prices for incremental gas supplies were set at a level equal to 85% of the cost of alternative fuels in (60% fuel oil /40% LPG mix) in 2H2012. No price changes were made on incremental gas supplies since then. What if we “mark to market”? Our calculations suggest that, if we roll forward price levels of alternative fuels (based on actual imported prices into China) from Aug 2012 to Aug 2014, incremental natural gas prices will decrease by 6% (see table on next page); If prices were to be further adjusted down to crude oil price equivalents of US$50/bbl to US$90/bbl, incremental natural gas prices would decrease by 19% to 55%, respectively. Assuming (1) no price changes on existing gas supplies and (2) incremental gas supplies account for ~20% of the nation’s total gas supplies, weighted average natural gas city gate prices will be adjusted to 4-11% based on a crude oil price of US$50 – 90 / bbl. Relief to stagnant gas demand: It remains to be seen if a gas cost cut will eventually materialize. But in the event of a gas cost cut, it will be a relief to city gas distributors given the weakening gas demand growth after the gas cost hike in Aug 2014. As a reference, gas supply growth (proxy for demand) in China slowed to 9% Y/Y in Sep to Dec 2014. Operation update: We believe most listed city gas distributors only suffered a mild slowdown (vs. 1H2014 levels) after the gas cost hikes in 2H2014. Gas cost cut a positive: Share prices of listed city gas distributors have underperformed by 12-50% since July 2014 amidst gas cost hikes and falling oil prices. A potential gas cost hike will be a positive to the market, especially for operators which already suffered weak demand growth in 1H2014 (CR Gas). China city gas Boris Kan AC (852) 2800-8573 [email protected] Bloomberg JPMA KAN <GO> Elaine Wu (852) 2800-8575 [email protected] J.P. Morgan Securities (Asia Pacific) Limited Figure 1: Share price performance since Jul 2014 (%) Kunlun -36% Ch. Gas -24% CR Gas -22% BJE -19% TGC 1% Xinao 2% HSCEI 14% -40% -30% -20% -10% 0% 10% 20% Source: Bloomberg. Figure 2: 1H2014 gas sales vol growth (% Y/Y) Xinao 33% Ch. Gas 18% TGC 13% CR Gas 9% Kunlun 0% BJE 0% 0% 5% 10% 15% 20% 25% 30% 35% Source: Company data Table 1: Scenario analysis: Incremental gas prices vs. crude oil prices Aug-12 Aug-13 Aug-14 Crude @ US$ 100 / bbl Crude @ US$ 90 / bbl Crude @ US$ 80 / bbl Crude @ US$ 70 / bbl Crude @ US$ 60 / bbl Crude @ US$ 50 / bbl Fuel Oil Import Cost (60%) (US$/bl) 103.9 96.9 93.1 92.7 83.4 74.1 64.9 55.6 46.3 LPG Import Cost (40%) (US$/bl) 74.6 76.5 79.6 67.7 60.9 54.1 47.4 40.6 33.8 Crude Import Cost (US$/bl) 112.1 106.3 106.2 100.0 90.0 80.0 70.0 60.0 50.0 "Deemed" Nat Gas Price based on incl. VAT (Rmb/m3) 3.4 3.3 3.2 3.1 2.8 2.5 2.2 1.8 1.5 % chg vs. Aug 2012 levels N/A -5% -6% -10% -19% -28% -37% -46% -55% Incre gas a % of total supplies N/A 20% 20% 20% 20% 20% 20% 20% 20% Wt avg. gas cost chg % N/A -1% -1% -2% -4% -6% -7% -9% -11% Source: J.P. Morgan Oil and Gas Team. See page 3 for analyst certification and important disclosures, including non-US analyst disclosures. J.P. Morgan does and seeks to do business with companies covered in its research reports. As a result, investors should be aware that the firm may have a conflict of interest that could affect the objectivity of this report. Investors should consider this report as only a single factor in making their investment decision. www.jpmorganmarkets.com Asia Pacific Equity Research 29 January 2015 China SMID Ideas Feedback from China SMID Caps 1X1 Forum Stick with high quality names going into results season SMID-Caps AC Our discussions with over 20 SMID Caps over the past two weeks suggest that there is plenty of value in defensive SMID Caps and it’s too early to jump into cyclical ones that might miss earnings. Profit alerts of 60-80% FY14 earnings growth by Xinyi Solar and PAX Global are encouraging whereas many heavy industrial SMIDs saw disappointing sales and inventory write-downs in 2HFY14. Leon Chik, CFA Most important SMID news J.P. Morgan Securities (Asia Pacific) Limited Euro no problem. The sharp drop in the Euro has caused some concerns over exporters. What we see amongst leading SMID exporters is that they are good at hedging Euro risks through natural and financial hedges but hedges on Renminbi and commodities tend to be more complex or costly and therefore relatively unhedged. Both falling raw material and depreciating Renminbi might help boost margins of SMID exporters considerably in 1H15. Top exporter picks TTI, Johnson Electric and Shenzhou. Rajiv Batra Bloomberg JPMA CHIK <GO> J.P. Morgan Securities (Asia Pacific) Limited Liwen Yin (852) 2800-8528 [email protected] (91-22) 6157-3568 [email protected] J.P. Morgan India Private Limited China: China Small caps vs Market MSCN 60% MSCN SC 40% 20% 0% -20% Jul-12 Sep-12 Nov-12 Jan-13 Mar-13 May-13 Jul-13 Sep-13 Nov-13 Jan-14 Mar-14 May-14 Jul-14 Sep-14 Nov-14 Jan-15 Pre-earnings season jitters – warnings and alerts are coming fast and we prefer to avoid cyclical stocks because the drop in oil and metals prices could cause a leg down on inventory adjustments in 2014 before the benefits flow to 2015 P/L. (852) 2800-8590 [email protected] Source: Bloomberg Top Picks TAL Education XRS US (OW) Xinyi Solar 968 HK (OW) SMID Cap updates Techtronic Ind 669 HK (OW) TAL Education remains our AFL top pick despite the 3Q earnings miss on higher spending to develop online services. Enrollment and sales growth continue to surprise on the upside. PAX Global 327 HK (OW) CSC 3311 HK (OW) New Oriental EDU US (OW) Xinyi Solar, in our view, is a good play in a volatile solar sector with the signing of its largest EPC contract to build Rmb750m in rooftop solar panels in Anhui. Skyworth Digital 751 HK (OW) Kingboard Lam 1888 HK (OW) Kingboard Chem 148 HK (OW) Xinyi Solar 968 HK (OW) PAX Global announced a profit alert suggesting that demand for innovative electronic payment terminals remains strong despite higher domestic competition amongst the key customers for these machines. Shenzhou Int;'l 2313 HK (OW) PAX Global 327 HK (OW) Johnson Electric 179 HK (OW) China Lesso 3238 HK (OW) Nord Anglia Edu NORD US (OW) Haitian Int’l 1882 HK (OW) Texhong 2678 HK (N) China Travel 208 HK (N) Jiangnan 1366 HK (NC) Dongpeng 3386 HK (NC) Sanjing 2198 HK (NC) Idea of the week We seeing growing appreciation for Skyworth’s brand and network as the largest TV brand in China sees its share price approach a 12-month high. New refrigerator, air-con, air purifiers and third party logistics will all likely add to sales growth and operating leverage is high as network and branding are sunk costs. Other stocks mentioned See page 26 for analyst certification and important disclosures, including non-US analyst disclosures. J.P. Morgan does and seeks to do business with companies covered in its research reports. As a result, investors should be aware that the firm may have a conflict of interest that could affect the objectivity of this report. Investors should consider this report as only a single factor in making their investment decision. www.jpmorganmarkets.com Asia Pacific Equity Research 30 January 2015 China Steel Sector Mid-January CISA output falls ahead of CNY Mid-Jan CISA output down 5.1% ahead of CNY. According to CISA, daily crude steel output from large and mid-sized mills (CISA’s 92 members) fell 5.1% to 1.69Mtpd in mid-Jan, or 618Mtpa (versus 651Mpta in early Jan). This came as some mills had already sent workers off ahead of CNY amid soft demand. Assuming non-CISA mills account for c28% of total output (as in Dec), we estimate that national output may have fallen 5.1% to 857Mtpa in midJan (CISA’s Dec output of 872mt). This leaves China’s steel output in Jan at 74.8Mt (+14.2% y/y) at current run rates. Steel inventory restocking while ports’ iron ore stockpiles fall. In mid-Jan, both producer and trader stocks jumped by 8.3% to 14.8 Mt (early Jan: 13.6Mt) and by 6.2% to 10.7Mt (early Jan: 10.1Mt), respectively. Taken together, we estimate CISA mills and traders now hold 13.5 days (early Jan: 13.2 days) of steel inventories, above trend level of 14.2 days. On the raw materials side, midJan iron ore stocks at mills climbed to 22.4 days (early Jan: 21.8 days), above the historical level of 27 days. Nonetheless, stocks at Chinese ports continue to fall, now at 99.8Mt (34 days, historically 32 days), down from 100.2 Mt in early Jan. We estimate seaborne iron ore prices are 17% cheaper (late Dec: 14%) than domestic market. We note that utilization rate at domestic iron ore mines drifted lower to 53% in mid-Jan (early Jan: 54%), well below 1H14 average of c80%. Coking coal mines’ utilization rate fell to 83% (early Jan: 84%) in mid-Jan. Cash spreads keep sliding as steel prices fall. Sentiment amongst steel mills and traders improved somewhat. That said, lower steel prices pushed cash spreads for HRC and rebar lower to Rmb1,425/t (Rmb1,493/t in early Jan) and Rmb1,303/t (Rmb1,353/t in early Jan) respectively. With slow construction in 1Q and weak cash spreads, we remain cautious on the sector but see better riskreward for Maanshan. Angang Steel H Angang Steel A Baosteel Maanshan H Maanshan A China average Ticker Rating 347 HK 000898 CH 600019 CH 323 HK 600808 CH N N N OW OW Price (LC) 5.70 5.43 6.05 2.09 3.59 Daniel Kang AC (852) 2800 8570 [email protected] Bloomberg JPMA KANG <GO> Waiyin Karen Li, CFA (852) 2800-8561 [email protected] Parsley Rui Hua Ong (852) 2800-8509 [email protected] J.P. Morgan Securities (Asia Pacific) Limited Figure 1: CISA steel members’ output falls (Mt) 675 650 625 600 575 550 525 Source: Note: Figures in Million tonnes on an annualized basis Source: Mysteel, CISA, J.P. Morgan Figure 2: China steel prices soften (Rmb/t) 4500 4100 3700 3300 2900 2500 Jan-12 Jan-13 Rebar Jan-14 Jan-15 HRC Source: Bloomberg, J.P. Morgan China steel sector valuation comparison Company Steel Mar-12 Apr-12 May-12 Jun-12 Jul-12 Aug-12 Sep-12 Oct-12 Nov-12 Dec-12 Jan-13 Feb-13 Mar-13 Apr-13 May-13 Jun-13 Jul-13 Aug-13 Sep-13 Oct-13 Nov-13 Dec-13 Jan-14 Feb-14 Mar-14 Apr-14 May-14 Jun-14 Jul-14 Aug-14 Sep-14 Oct-14 Nov-14 Dec-14 Jan-15 China’s steel output from large and mid-sized mills (CISA members) fell 5.1% to 618Mtpa in mid-Jan (from 651Mtpa in early Jan) as output begins to slow ahead of Chinese New Year (CNY) and mills respond to weak demand conditions. Near term, the recent removal of boron-added steel export rebates and weak macro readings will keep domestic steel markets under pressure with cash spreads trending lower in the seasonally slower 1Q period. We recently turned more cautious on the sector, but see some support from likely macro stimulus and tighter environmental policies. Perf. YTD (%) -14% -12% -14% -10% -10% -13% P/E (x) 15E 16E 26.6 25.0 31.8 29.8 15.8 14.0 12.5 10.8 26.8 23.3 20.8 18.8 P/BV (x) 15E 16E 0.7 0.7 0.8 0.8 0.8 0.8 0.5 0.5 1.1 1.1 0.9 0.8 EV/EBITDA (x) 15E 16E 8.3 8.1 8.3 8.1 7.0 5.9 6.1 5.4 6.1 5.4 7.1 6.4 ROE (%) 15E 16E 2.6 2.7 2.6 2.7 5.4 5.9 4.3 4.8 4.3 4.8 4.6 5.0 Div Yield (%) 15E 16E 0.8 0.8 0.9 1.0 3.2 3.6 1.9 1.9 1.4 1.4 2.4 2.6 Source: Bloomberg, J.P. Morgan estimates. Note: Share prices and valuations are as of 29 January 2015 See page 8 for analyst certification and important disclosures, including non-US analyst disclosures. J.P. Morgan does and seeks to do business with companies covered in its research reports. As a result, investors should be aware that the firm may have a conflict of interest that could affect the objectivity of this report. Investors should consider this report as only a single factor in making their investment decision. www.jpmorganmarkets.com Asia Pacific Equity Research 29 January 2015 Dry Bulk Shipping Capesize earnings rose, mainly driven by higher iron ore shipping demand to China; port congestion fell The BDI fell 3% w/w as higher Capesize freight rates were more than offset by lower rates across vessel segments: Capesize earnings surged 49% w/w to $9.9K/day for the week ending Jan 23, mainly driven by increased activity in the Pacific. However, Panamax earnings fell 12% w/w to $5.2K/day. The Supramax/Handysize index fell 9% w/w. No period fixture was done last week versus two period fixture done at $12.5/day for 11-14 months in the previous week. The one-year Capesize time-charter rate fell 2% w/w to $11.5K/day (source: Clarksons). Forward curve points to higher rates from 2Q15: FFA indications for Capesize time-charter are at $8.5K/day in 2Q15 (current: $7.7K/day), $10.4K in 3Q15 and $14.4K in 4Q15. FFA for Panamax TC are at $7.4K/day for 2Q15 (current: $5.6K/day), $7.3K in 3Q15, $8.3K/day in 4Q15. FFA for Supramax TC are at $7.9K/day for 2Q15 (current: $6.9K/day), $7.9K in 3Q15, $8.8K/day in 4Q15. FFA for Handysize TC are at $6.0K/day for 1Q15 (current: $6.0K/day), $7.1K in 2Q15, $7.4K/day for CY2016 (source: Clarksons, SSY). Capesize ship chartering activity held fairly steady w/w at 39 vessels during the week but were 11% higher y/y. 82% will carry iron ore (vs 46% a week ago), 18% coal (49%) and 0% unknown (5%). Jan-Dec 2014 split: 76% iron ore (vs 69% in 2013), coal 18% (23%), others 6% (8%). Iron ore shipping demand to China rose while coal shipping demand fell: 64% of the Capesize vessels were chartered to carry cargo to China (vs 59% a week ago), 92% carrying iron ore (from 70%) and 8% coal (30%). Europe’s share of shipping demand fell to 21% (from 26%) while Rest of Asia’s share rose to 15% (from 13%) and Others’ fell to 0% (3%). In Jan-Dec 2014, the split was China 71% (vs 70% in 2013), rest of Asia 14% (16%), Europe 14% (13%), other 1% (1%). Ship chartering activity rose in the Handysize segment but fell in the other vessel segments: In the Panamax spot market, the number of ships chartered fell 20% w/w to 44 vessels with coal/grain shipping demand driving 36%/27% of the ships chartered. The number of ships chartered fell 29% w/w in the Handymax segment but rose 100% in the Handysize segment. Global ports congestion fell w/w: 155 Capesizes were at anchorage, 12% lower w/w or c.9% of the global Capesize fleet. Details: 1) Australia’s main coal/ore ports – 125 (from 133) vessels plus 191 (from 187) vessels arriving in the next 14 days. 2) Brazil – 20 (from 26) vessels at anchorage. 3) China’s major ore & coal berths – 40 (49) vessels at anchorage plus 64 (from 54) vessels arriving in the next 14 days (source: Global ports as at Jan 29). Global bulk shipping capacity rose 0.1% m/m to 756.2MM dwt as at Jan 1. This is the 30th month of a ≤1% m/m rise, resulting in a 4.8% growth in full year 2014, in line with our forecast and well below the 10% growth implied by the vessel order book at the start of this year. Scrapping removed 305 ships and 15.9MM dwt in 2014 (or c.2.1% of global capacity). The dry bulk shipping sector recovery could be delayed till late 2015 or early 2016 but we see opportunities to accumulate oversold stocks ahead of any pick-up in demand. Top picks: Mitsui OSK (0.7x P/B, 67% below historical average valuation), Pacific Basin (0.6x P/B, 49% below), Precious Shipping (1.0x P/B, 42% below). Shipping Corrine Png AC (65) 6882-1514 [email protected] Bloomberg JPMA PNG <GO> J.P. Morgan Securities Singapore Private Limited Baltic Dry Index 13,500 12,000 10,500 9,000 7,500 6,000 4,500 3,000 1,500 0 02 03 04 05 06 07 08 09 10 11 12 13 14 15 Source: Bloomberg Baltic Freight Indices – Summary Baltic Dry Baltic Handysize Baltic Supramax Baltic Panamax Baltic Capesize* Baltic Dirty Tanker Baltic Clean Tanker Index 720 380 650 685 887 917 705 W/W -2.8% -9.1% -9.2% -9.7% 43.1% -3.5% -4.7% Y/Y -43.4% -46.9% -42.0% -53.3% -50.0% -26.2% 16.5% Source: Bloomberg, as of Friday 23 Jan close. *The Baltic Exchange introduced a new Capesize Index on 6th May 2014. See page 7 for analyst certification and important disclosures, including non-US analyst disclosures. J.P. Morgan does and seeks to do business with companies covered in its research reports. As a result, investors should be aware that the firm may have a conflict of interest that could affect the objectivity of this report. Investors should consider this report as only a single factor in making their investment decision. www.jpmorganmarkets.com Asia Pacific Equity Research 30 January 2015 Macau gaming Full-smoking ban on the horizon? Our quick-and-dirty impact analysis What’s happened? Macau’s Secretary for Social Affairs and Culture (a.k.a. Health Bureau), Alexis Tam, said yesterday that government may submit a bill for full smoking ban inside casinos during 1H15, which would include VIP rooms. He also noted that the bill is unlikely to pass during this legislative year, even if it were submitted in 1H15, considering likely long debate on the bill. Of note, next legislative session runs during October 2015 to August 2016. It was just a matter of time, we (& the market) think. During his press interview in December, Mr. Tam already discussed a possibility of new and “tighter” smoking ban from March 2015; since then, we believe it has been a consensus in the market as well as the industry that full smoking ban is inevitable and just a matter of timing. How bad would it be?: In any case, full smoking ban, if enacted, would hurt gaming demand; this is also just a matter of how bad it’s going to be and how long the impact would last. It’s impossible to accurately predict the potential impact, we admit. Still, our two cents below: (1) Case study. Impact from smoking ban has varied substantially across jurisdictions, depending on cultural background, availability of alternative jurisdiction, propensity to gamble vs. smoke, etc. That said, smoking ban has generally reduced gaming revenues by c.10~20% for the first full year, if we look at the cases in the U.S. and Australia (e.g. Colorado, Illinois, Delaware, Victoria, etc). This however appears to have been followed by a gradual recovery, as the players adapt and adjust to new rule. (2) Not all gamblers are created equal. But, we argue the impact for Macau should be smaller than above, taking into account that Macau casinos are “destination casinos” and have no other alternative, not to mention the mainlanders’ high propensity to gamble. For instance, we estimate Macau’s recent smoking ban on mass segment has negatively impacted mass table revenues by less than 10%, based on our conversations with operators. (3) Our best guesstimates on potential impact. We believe potential full smoking ban could have similar ~10% impact on VIP and “reclassified” premium mass revenues. Therefore, considering these two segments collectively generated 62% of total gaming revenues in recent month (Exhibit 1), potential full-smoking ban could hurt gaming demand by 5~6%, based on our back-of-the-envelope calculation (c.60% x ~10%). Impact on operators’ profits however should be smaller, given relatively lower margin for those segments (vs. grind mass or nongaming) and a potential return of some junket VIP players (as junkets would lose its competitive edge in smoking tables). (4) Impact for six operators. If full smoking ban happens, we think potential impact should be the smallest for Sands China by big margin, as it generated only 39% of GGR (& much smaller profits) from smoking-enabled tables in December (Chart below). On the other hands, we note MPEL and MGM are most exposed to such segments. Asia Pacific Equity Research 29 January 2015 Thai banks Solid liquidity; funding cost to stay low for longer with further downside possible We forecast stable NIM for FY15 but see upside potential. The amount of excess liquidity is at a record high. This suggests very low pressure on funding costs. No cut in benchmark rates means no pressure on asset yield. This is positive for NIM outlook. Loan expansion, esp. into SME and housing, should differentiate the NIM trend for each individual bank. Among the major banks, KTB and BBL have lower LDRs implying better NIM outlook vs SCB and KBANK. However, for BBL with its corporate lending focus, NIM is not expected to move much. Banks, Real Estate & Strategy AC Anne Jirajariyavech, CFA (66-2) 684-2684 [email protected] Bloomberg JPMA JIRAJARIYAVECH <GO> JPMorgan Securities (Thailand) Limited Josh Klaczek (852) 2800-8534 [email protected] The Bank of Thailand decided to hold the policy rate steady at 2.0% at yesterday’s meeting, given the view that the domestic economy is recovering and public spending/investment will accelerate through the year. Also, the MPC cited lower oil prices bringing inflation down below its target and increasing policy flexibility. We believe monetary direction will remain in ‘easing’ mode with 1) lower oil price & inflation 2) concerns on growth 3) debt burden of low-income households. We saw funding costs at a lower level during the pre-GFC period. A few comparisons between then and now: 1) LDR (plus) is similar to then, 2) funding cost is also similar, 3) the oil price is lower, 4) US QE is ending, but EU, Japan and China are seeing monetary expansion, and 5) the absence of aggressive competition from SFI. This makes us believe there is potential upside on NIM for banks, especially for ones that expand loans in non-corporate areas. SME and housing loans are two major areas of growth we see for the year. J.P. Morgan Securities (Asia Pacific) Limited ASEAN countries' real interest rate 4 ASEAN: Real Rate 3 2 1 (1) (2) (3) ID MY PH SG TH VN Source: CEIC SCB is a leading player for housing loans. KBANK is key SME player. KTB should benefit from expanding private sector lending; it secured significant funding last year that is now ready to deploy. Valuation summary Current price BAY (Bt) 76.00 BBL KBANK KTB SCB P/PPOP 2014E P/E 2015E (x ) 12.3 11.0 193.00 6.8 6.2 230.00 7.1 6.4 23.00 184.50 6.0 7.5 5.5 6.9 TMB 3.16 8.8 TCAP 33.75 2.3 KKP 40.25 TISCO Sector 47.00 2014E (x) 27.8 Div 2015E yield P/BV 2014E ROE 2015E 2014E PPOP Growth 2015E (% ) 2014E Net profit growth 2015E 2014E (% ) 19 YT D 2015E stock 15 perf. 70% 24.1 (% ) 1.1 (x) 3.5 3.2 13.0 13.8 (% ) 14 12 9.4 8.5 3.6 1.2 1.1 12.8 12.9 11 10 9 10 -1% 11.6 10.4 1.3 2.1 1.8 19.8 18.9 14 11 14 12 0% 10.1 11.2 9.2 10.2 3.8 2.7 1.4 2.2 1.3 1.9 14.8 21.1 14.8 20.3 4 12 9 10 (6) 11 9 10 1% 1% 8.3 17.7 15.6 1.0 2.0 1.9 12.0 12.5 8 6 35 14 8% 2.4 8.4 7.9 4.4 0.8 0.8 10.4 10.3 4 (2) (45) 7 6% 4.9 5.0 12.9 10.5 6.6 0.9 0.9 7.4 8.8 4 (3) (40) 22 2% 4.0 7.2 4.1 6.7 8.9 12.3 8.5 11.1 5.0 2.4 1.5 1.8 1.3 1.7 17.4 15.8 16.3 15.8 3 10 (3) 9 0 6 4 11 11% 11% Source: Bloomberg and J.P. Morgan See page 5 for analyst certification and important disclosures, including non-US analyst disclosures. J.P. Morgan does and seeks to do business with companies covered in its research reports. As a result, investors should be aware that the firm may have a conflict of interest that could affect the objectivity of this report. Investors should consider this report as only a single factor in making their investment decision. www.jpmorganmarkets.com James R. Sullivan, CFA (65) 6882-2374 [email protected] Asia Pacific Equity Research 30 January 2015 Disclosures Analyst Certification: The research analyst(s) denoted by an “AC” on the cover of this report certifies (or, where multiple research analysts are primarily responsible for this report, the research analyst denoted by an “AC” on the cover or within the document individually certifies, with respect to each security or issuer that the research analyst covers in this research) that: (1) all of the views expressed in this report accurately reflect his or her personal views about any and all of the subject securities or issuers; and (2) no part of any of the research analyst's compensation was, is, or will be directly or indirectly related to the specific recommendations or views expressed by the research analyst(s) in this report. For all Korea-based research analysts listed on the front cover, they also certify, as per KOFIA requirements, that their analysis was made in good faith and that the views reflect their own opinion, without undue influence or intervention. Research excerpts: This note includes excerpts from previously published research. For access to the full reports, including analyst certification and important disclosures, investment thesis, valuation methodology, and risks to rating and price targets, please contact your salesperson or the covering analyst’s team or visit www.jpmorganmarkets.com. Important Disclosures • Market Maker/ Liquidity Provider: J.P. Morgan Securities plc and/or an affiliate is a market maker and/or liquidity provider in adidas Group, Volkswagen Prefs.. • Lead or Co-manager: J.P. Morgan acted as lead or co-manager in a public offering of equity and/or debt securities for Beijing Enterprises Holdings Limited, MakeMyTrip Ltd., Maanshan Iron & Steel - H, Bank Rakyat Indonesia, IDFC, Sesa Sterlite, POSCO, adidas Group, Under Armour, Inc., Volkswagen Prefs., PTT Exploration & Production within the past 12 months. • Director: An employee, executive officer or director of JPMorgan Chase & Co. and/or J.P. Morgan is a director and/or officer of Dr. Reddy's Laboratories Limited. • Beneficial Ownership (1% or more): J.P. Morgan beneficially owns 1% or more of a class of common equity securities of HDFC (Housing Development Finance Corporation). • Client: J.P. Morgan currently has, or had within the past 12 months, the following company(ies) as clients: NTT Docomo (9437), ENN Energy Holdings Limited, Towngas China Company Limited, Kunlun Energy Company Limited, China Resources Gas Group Limited, Beijing Enterprises Holdings Limited, MakeMyTrip Ltd., Hyundai Steel Company, Maanshan Iron & Steel - H, Bank Negara Indonesia Persero, Bank Rakyat Indonesia, Dr. Reddy's Laboratories Limited, Samsung Electronics, Samsung SDI, Pidilite Industries, Bursa Malaysia Bhd, Naver, SK Telecom, HDFC (Housing Development Finance Corporation), IDFC, Hotel Shilla, Sesa Sterlite, Cairn India Limited, Adani Power, Samsung Engineering, POSCO, Sumitomo Mitsui Trust Holdings (8309), Samsung Electro-Mechanics, Samsung Heavy Industries, Advanced Info Services, Shinsei Bank (8303), Bank of China (BOCHK), Hang Seng Bank, LG Electronics, Pacific Basin Shipping, Mitsui O.S.K. Lines (9104), CapitaRetail China Trust, Asian Paints Limited, Wijaya Karya, NIKE, Inc., adidas Group, Under Armour, Inc., Mazda Motor (7261), Toyota Motor (7203), Volkswagen Prefs., Siam Commercial Bank, KASIKORNBANK, Krung Thai Bank, Bangkok Bank, PTT Exploration & Production, Genting Singapore, LG Display. • Client/Investment Banking: J.P. Morgan currently has, or had within the past 12 months, the following company(ies) as investment banking clients: NTT Docomo (9437), Beijing Enterprises Holdings Limited, MakeMyTrip Ltd., Maanshan Iron & Steel - H, Bank Rakyat Indonesia, Samsung Electronics, IDFC, Sesa Sterlite, Cairn India Limited, Adani Power, POSCO, Sumitomo Mitsui Trust Holdings (8309), Bank of China (BOCHK), Hang Seng Bank, adidas Group, Under Armour, Inc., Toyota Motor (7203), Volkswagen Prefs., PTT Exploration & Production. • Client/Non-Investment Banking, Securities-Related: J.P. Morgan currently has, or had within the past 12 months, the following company(ies) as clients, and the services provided were non-investment-banking, securities-related: NTT Docomo (9437), Hyundai Steel Company, Bank Negara Indonesia Persero, Bank Rakyat Indonesia, Dr. Reddy's Laboratories Limited, Samsung Electronics, Samsung SDI, HDFC (Housing Development Finance Corporation), IDFC, Sesa Sterlite, Cairn India Limited, Adani Power, Samsung Engineering, POSCO, Sumitomo Mitsui Trust Holdings (8309), Samsung Heavy Industries, Shinsei Bank (8303), Bank of China (BOCHK), Hang Seng Bank, LG Electronics, Pacific Basin Shipping, Mitsui O.S.K. Lines (9104), NIKE, Inc., adidas Group, Under Armour, Inc., Toyota Motor (7203), Volkswagen Prefs., Siam Commercial Bank, KASIKORNBANK, Krung Thai Bank, Bangkok Bank, PTT Exploration & Production, LG Display. • Client/Non-Securities-Related: J.P. Morgan currently has, or had within the past 12 months, the following company(ies) as clients, and the services provided were non-securities-related: NTT Docomo (9437), Dr. Reddy's Laboratories Limited, Samsung Electronics, HDFC (Housing Development Finance Corporation), Sesa Sterlite, Cairn India Limited, POSCO, Sumitomo Mitsui Trust Holdings (8309), Bank of China (BOCHK), Hang Seng Bank, LG Electronics, NIKE, Inc., adidas Group, Under Armour, Inc., Toyota Motor (7203), Volkswagen Prefs., KASIKORNBANK, Krung Thai Bank, PTT Exploration & Production. • Investment Banking (past 12 months): J.P. Morgan received in the past 12 months compensation from investment banking NTT Docomo (9437), Beijing Enterprises Holdings Limited, MakeMyTrip Ltd., Maanshan Iron & Steel - H, Bank Rakyat Indonesia, Samsung Electronics, IDFC, Sesa Sterlite, Cairn India Limited, Adani Power, POSCO, Sumitomo Mitsui Trust Holdings (8309), Bank of China (BOCHK), Hang Seng Bank, adidas Group, Under Armour, Inc., Toyota Motor (7203), Volkswagen Prefs., PTT Exploration & Production. • Investment Banking (next 3 months): J.P. Morgan expects to receive, or intends to seek, compensation for investment banking services in the next three months from NTT Docomo (9437), Beijing Enterprises Holdings Limited, MakeMyTrip Ltd., Maanshan Iron & Steel - H, Bank Rakyat Indonesia, Dr. Reddy's Laboratories Limited, Samsung Electronics, IDFC, Sesa Sterlite, Cairn India Limited, Adani Power, POSCO, Sumitomo Mitsui Trust Holdings James R. Sullivan, CFA (65) 6882-2374 [email protected] Asia Pacific Equity Research 30 January 2015 (8309), Bank of China (BOCHK), Hang Seng Bank, LG Electronics, adidas Group, Under Armour, Inc., Mazda Motor (7261), Toyota Motor (7203), Volkswagen Prefs., PTT Exploration & Production. • Non-Investment Banking Compensation: J.P. Morgan has received compensation in the past 12 months for products or services other than investment banking from NTT Docomo (9437), Hyundai Steel Company, Bank Negara Indonesia Persero, Bank Rakyat Indonesia, Dr. Reddy's Laboratories Limited, Samsung Electronics, Samsung SDI, HDFC (Housing Development Finance Corporation), IDFC, Sesa Sterlite, Cairn India Limited, Adani Power, Samsung Engineering, POSCO, Sumitomo Mitsui Trust Holdings (8309), Samsung Heavy Industries, Shinsei Bank (8303), Bank of China (BOCHK), Hang Seng Bank, LG Electronics, Pacific Basin Shipping, Mitsui O.S.K. Lines (9104), NIKE, Inc., adidas Group, Under Armour, Inc., Toyota Motor (7203), Volkswagen Prefs., Siam Commercial Bank, KASIKORNBANK, Krung Thai Bank, Bangkok Bank, PTT Exploration & Production, LG Display. • • Broker: J.P. Morgan Securities plc acts as Corporate Broker to Cairn India Limited. “JPMorgan Chase Bank, N.A., Hong Kong Branch (“J.P. Morgan”) is acting as a financial adviser to Samsung Electronics Co., LTD, Samsung C&T Corporation and certain other Samsung affiliated parties in relation to their sale of a combined stake of (i) 32.35% in Samsung Techwin Co., LTD to Hanwha Corporation; and (ii) 57.62% in Samsung General Chemicals Co., Ltd to Hanwha Energy Corporation and Hanwha Chemical Corporation as announced on 26 November 2014. J.P. Morgan will be receiving fees for so acting. J.P. Morgan and/or its affiliates may perform, or may seek to perform, other financial or advisory services for any Samsung affiliated parties and may have other interests in or relationships with them, and receive fees, commissions or other compensation in such capacities. This research report and the information herein is not intended to serve as an endorsement of the proposed transaction or result in procurement, withholding or revocation of a proxy or any other action by a security holder. This report is based solely on publicly available information. No representation is made that it is accurate or complete.” • • An affiliate of JPMS owns a significant stake in HDFC Securities Limited, a privately held subsidiary of HDFC. “J.P. Morgan India Private Limited ("J.P. Morgan") is acting as the Joint Book Running Lead Manager in connection with IDFC Limited’s Qualified Institutions Placement ("QIP") offering as announced on 10 Sep 2014. J.P. Morgan will be receiving fees for so acting. J.P. Morgan may perform, or may seek to perform, other financial or advisory services for IDFC Ltd or its affiliates and may have other interests or relationships with IDFC Ltd or its affiliates, and receive fees, commissions or other compensation in such capacities. This research report and the information herein is not intended to serve as an endorsement of the possible transaction or result in procurement, withholding or revocation of a proxy or any other action by a security holder. This report is based solely on publicly available information. No representation is made that it is accurate or complete.” • J.P. Morgan Limited is acting as corporate broker and financial advisor to Vedanta Resources on its corporate reorganisation as announced on 25 February 2012. • MSCI: The MSCI sourced information is the exclusive property of MSCI. Without prior written permission of MSCI, this information and any other MSCI intellectual property may not be reproduced, redisseminated or used to create any financial products, including any indices. This information is provided on an 'as is' basis. The user assumes the entire risk of any use made of this information. MSCI, its affiliates and any third party involved in, or related to, computing or compiling the information hereby expressly disclaim all warranties of originality, accuracy, completeness, merchantability or fitness for a particular purpose with respect to any of this information. Without limiting any of the foregoing, in no event shall MSCI, any of its affiliates or any third party involved in, or related to, computing or compiling the information have any liability for any damages of any kind. MSCI and the MSCI indexes are services marks of MSCI and its affiliates. Company-Specific Disclosures: Important disclosures, including price charts and credit opinion history tables, are available for compendium reports and all J.P. Morgan–covered companies by visiting https://jpmm.com/research/disclosures, calling 1-800-477-0406, or e-mailing [email protected] with your request. J.P. Morgan’s Strategy, Technical, and Quantitative Research teams may screen companies not covered by J.P. Morgan. For important disclosures for these companies, please call 1-800-477-0406 or e-mail [email protected]. Explanation of Equity Research Ratings, Designations and Analyst(s) Coverage Universe: J.P. Morgan uses the following rating system: Overweight [Over the next six to twelve months, we expect this stock will outperform the average total return of the stocks in the analyst’s (or the analyst’s team’s) coverage universe.] Neutral [Over the next six to twelve months, we expect this stock will perform in line with the average total return of the stocks in the analyst’s (or the analyst’s team’s) coverage universe.] Underweight [Over the next six to twelve months, we expect this stock will underperform the average total return of the stocks in the analyst’s (or the analyst’s team’s) coverage universe.] Not Rated (NR): J.P. Morgan has removed the rating and, if applicable, the price target, for this stock because of either a lack of a sufficient fundamental basis or for legal, regulatory or policy reasons. The previous rating and, if applicable, the price target, no longer should be relied upon. An NR designation is not a recommendation or a rating. In our Asia (ex-Australia) and U.K. small- and mid-cap equity research, each stock’s expected total return is compared to the expected total return of a benchmark country market index, not to those analysts’ coverage universe. If it does not appear in the Important Disclosures section of this report, the certifying analyst’s coverage universe can be found on J.P. Morgan’s research website, www.jpmorganmarkets.com. James R. Sullivan, CFA (65) 6882-2374 [email protected] Asia Pacific Equity Research 30 January 2015 J.P. Morgan Equity Research Ratings Distribution, as of January 1, 2015 J.P. Morgan Global Equity Research Coverage IB clients* JPMS Equity Research Coverage IB clients* Overweight (buy) 45% 56% 45% 75% Neutral (hold) 43% 49% 48% 67% Underweight (sell) 12% 33% 7% 52% *Percentage of investment banking clients in each rating category. For purposes only of FINRA/NYSE ratings distribution rules, our Overweight rating falls into a buy rating category; our Neutral rating falls into a hold rating category; and our Underweight rating falls into a sell rating category. Please note that stocks with an NR designation are not included in the table above. Equity Valuation and Risks: For valuation methodology and risks associated with covered companies or price targets for covered companies, please see the most recent company-specific research report at http://www.jpmorganmarkets.com, contact the primary analyst or your J.P. Morgan representative, or email [email protected]. Equity Analysts' Compensation: The equity research analysts responsible for the preparation of this report receive compensation based upon various factors, including the quality and accuracy of research, client feedback, competitive factors, and overall firm revenues. Registration of non-US Analysts: Unless otherwise noted, the non-US analysts listed on the front of this report are employees of non-US affiliates of JPMS, are not registered/qualified as research analysts under NASD/NYSE rules, may not be associated persons of JPMS, and may not be subject to FINRA Rule 2711 and NYSE Rule 472 restrictions on communications with covered companies, public appearances, and trading securities held by a research analyst account. Analysts' Compensation: The research analysts responsible for the preparation of this report receive compensation based upon various factors, including the quality and accuracy of research, client feedback, competitive factors, and overall firm revenues. Other Disclosures J.P. Morgan ("JPM") is the global brand name for J.P. Morgan Securities LLC ("JPMS") and its affiliates worldwide. J.P. Morgan Cazenove is a marketing name for the U.K. investment banking businesses and EMEA cash equities and equity research businesses of JPMorgan Chase & Co. and its subsidiaries. All research reports made available to clients are simultaneously available on our client website, J.P. Morgan Markets. Not all research content is redistributed, e-mailed or made available to third-party aggregators. For all research reports available on a particular stock, please contact your sales representative. Options related research: If the information contained herein regards options related research, such information is available only to persons who have received the proper option risk disclosure documents. For a copy of the Option Clearing Corporation's Characteristics and Risks of Standardized Options, please contact your J.P. Morgan Representative or visit the OCC's website at http://www.optionsclearing.com/publications/risks/riskstoc.pdf Legal Entities Disclosures U.S.: JPMS is a member of NYSE, FINRA, SIPC and the NFA. JPMorgan Chase Bank, N.A. is a member of FDIC. U.K.: JPMorgan Chase N.A., London Branch, is authorised by the Prudential Regulation Authority and is subject to regulation by the Financial Conduct Authority and to limited regulation by the Prudential Regulation Authority. Details about the extent of our regulation by the Prudential Regulation Authority are available from J.P. Morgan on request. J.P. Morgan Securities plc (JPMS plc) is a member of the London Stock Exchange and is authorised by the Prudential Regulation Authority and regulated by the Financial Conduct Authority and the Prudential Regulation Authority. Registered in England & Wales No. 2711006. Registered Office 25 Bank Street, London, E14 5JP. South Africa: J.P. Morgan Equities South Africa Proprietary Limited is a member of the Johannesburg Securities Exchange and is regulated by the Financial Services Board. Hong Kong: J.P. Morgan Securities (Asia Pacific) Limited (CE number AAJ321) is regulated by the Hong Kong Monetary Authority and the Securities and Futures Commission in Hong Kong and/or J.P. Morgan Broking (Hong Kong) Limited (CE number AAB027) is regulated by the Securities and Futures Commission in Hong Kong. Korea: J.P. Morgan Securities (Far East) Ltd, Seoul Branch, is regulated by the Korea Financial Supervisory Service. Australia: J.P. Morgan Australia Limited (JPMAL) (ABN 52 002 888 011/AFS Licence No: 238188) is regulated by ASIC and J.P. Morgan Securities Australia Limited (JPMSAL) (ABN 61 003 245 234/AFS Licence No: 238066) is regulated by ASIC and is a Market, Clearing and Settlement Participant of ASX Limited and CHI-X. Taiwan: J.P.Morgan Securities (Taiwan) Limited is a participant of the Taiwan Stock Exchange (company-type) and regulated by the Taiwan Securities and Futures Bureau. India: J.P. Morgan India Private Limited (Corporate Identity Number - U67120MH1992FTC068724), having its registered office at J.P. Morgan Tower, Off. C.S.T. Road, Kalina, Santacruz - East, Mumbai – 400098, is a member of the National Stock Exchange of India Limited (SEBI Registration Number - INB 230675231/INF 230675231/INE 230675231) and Bombay Stock Exchange Limited (SEBI Registration Number - INB 010675237/INF 010675237) and is regulated by Securities and Exchange Board of India. Telephone: 91-22-6157 3000, Facsimile: 91-22-6157 3990 and Website: www.jpmipl.com. For non local research reports, this material is not distributed in India by J.P. Morgan India Private Limited. Thailand: This material is issued and distributed in Thailand by JPMorgan Securities (Thailand) Ltd., which is a member of the Stock Exchange of Thailand and is regulated by the Ministry of Finance and the Securities and Exchange Commission and its registered address is 3rd Floor, 20 North Sathorn Road, Silom, Bangrak, Bangkok 10500. Indonesia: PT J.P. Morgan Securities Indonesia is a member of the Indonesia Stock Exchange and is regulated by the OJK a.k.a. BAPEPAM LK. Philippines: J.P. Morgan Securities Philippines Inc. is a Trading Participant of the Philippine Stock Exchange and a member of the Securities Clearing Corporation of the Philippines and the Securities Investor Protection Fund. It is regulated by the Securities and Exchange Commission. Brazil: Banco J.P. Morgan S.A. is regulated by the Comissao de Valores Mobiliarios (CVM) and by the Central Bank of Brazil. Mexico: J.P. Morgan Casa de Bolsa, S.A. de C.V., J.P. Morgan Grupo Financiero is a member of the Mexican Stock Exchange and authorized to act as a broker dealer by the National Banking and Securities Exchange Commission. Singapore: This material is issued and distributed in Singapore by or through J.P. Morgan Securities Singapore Private Limited (JPMSS) [MCI (P) 199/03/2014 and Co. Reg. No.: 199405335R] which is a member of the Singapore Exchange Securities Trading Limited and is regulated by the Monetary Authority of Singapore (MAS) and/or JPMorgan Chase Bank, N.A., Singapore branch (JPMCB Singapore) which is regulated by the MAS. This material is provided in Singapore only to accredited investors, expert investors and institutional investors, as defined in Section 4A of the Securities and Futures Act, Cap. 289. Recipients of this document are to contact JPMSS or JPMCB Singapore in respect of any matters arising from, or in connection with, the document. Japan: JPMorgan Securities Japan Co., Ltd. is regulated by the Financial Services Agency in Japan. Malaysia: This material is issued and distributed in Malaysia by JPMorgan Securities (Malaysia) Sdn Bhd (18146-X) which is a Participating Organization of Bursa Malaysia Berhad and a holder of Capital Markets Services License issued by the Securities Commission in Malaysia. Pakistan: J. P. Morgan Pakistan Broking (Pvt.) Ltd is a member of the Karachi Stock Exchange and James R. Sullivan, CFA (65) 6882-2374 [email protected] Asia Pacific Equity Research 30 January 2015 regulated by the Securities and Exchange Commission of Pakistan. Saudi Arabia: J.P. Morgan Saudi Arabia Ltd. is authorized by the Capital Market Authority of the Kingdom of Saudi Arabia (CMA) to carry out dealing as an agent, arranging, advising and custody, with respect to securities business under licence number 35-07079 and its registered address is at 8th Floor, Al-Faisaliyah Tower, King Fahad Road, P.O. Box 51907, Riyadh 11553, Kingdom of Saudi Arabia. Dubai: JPMorgan Chase Bank, N.A., Dubai Branch is regulated by the Dubai Financial Services Authority (DFSA) and its registered address is Dubai International Financial Centre - Building 3, Level 7, PO Box 506551, Dubai, UAE. Country and Region Specific Disclosures U.K. and European Economic Area (EEA): Unless specified to the contrary, issued and approved for distribution in the U.K. and the EEA by JPMS plc. Investment research issued by JPMS plc has been prepared in accordance with JPMS plc's policies for managing conflicts of interest arising as a result of publication and distribution of investment research. Many European regulators require a firm to establish, implement and maintain such a policy. This report has been issued in the U.K. only to persons of a kind described in Article 19 (5), 38, 47 and 49 of the Financial Services and Markets Act 2000 (Financial Promotion) Order 2005 (all such persons being referred to as "relevant persons"). This document must not be acted on or relied on by persons who are not relevant persons. Any investment or investment activity to which this document relates is only available to relevant persons and will be engaged in only with relevant persons. In other EEA countries, the report has been issued to persons regarded as professional investors (or equivalent) in their home jurisdiction. Australia: This material is issued and distributed by JPMSAL in Australia to "wholesale clients" only. This material does not take into account the specific investment objectives, financial situation or particular needs of the recipient. The recipient of this material must not distribute it to any third party or outside Australia without the prior written consent of JPMSAL. For the purposes of this paragraph the term "wholesale client" has the meaning given in section 761G of the Corporations Act 2001. Germany: This material is distributed in Germany by J.P. Morgan Securities plc, Frankfurt Branch and J.P.Morgan Chase Bank, N.A., Frankfurt Branch which are regulated by the Bundesanstalt für Finanzdienstleistungsaufsicht. Hong Kong: The 1% ownership disclosure as of the previous month end satisfies the requirements under Paragraph 16.5(a) of the Hong Kong Code of Conduct for Persons Licensed by or Registered with the Securities and Futures Commission. (For research published within the first ten days of the month, the disclosure may be based on the month end data from two months prior.) J.P. Morgan Broking (Hong Kong) Limited is the liquidity provider/market maker for derivative warrants, callable bull bear contracts and stock options listed on the Stock Exchange of Hong Kong Limited. An updated list can be found on HKEx website: http://www.hkex.com.hk. Japan: There is a risk that a loss may occur due to a change in the price of the shares in the case of share trading, and that a loss may occur due to the exchange rate in the case of foreign share trading. In the case of share trading, JPMorgan Securities Japan Co., Ltd., will be receiving a brokerage fee and consumption tax (shouhizei) calculated by multiplying the executed price by the commission rate which was individually agreed between JPMorgan Securities Japan Co., Ltd., and the customer in advance. Financial Instruments Firms: JPMorgan Securities Japan Co., Ltd., Kanto Local Finance Bureau (kinsho) No. 82 Participating Association / Japan Securities Dealers Association, The Financial Futures Association of Japan, Type II Financial Instruments Firms Association and Japan Investment Advisers Association. Korea: This report may have been edited or contributed to from time to time by affiliates of J.P. Morgan Securities (Far East) Ltd, Seoul Branch. Singapore: JPMSS and/or its affiliates may have a holding in any of the securities discussed in this report; for securities where the holding is 1% or greater, the specific holding is disclosed in the Important Disclosures section above. Taiwan: This material is issued and distributed in Taiwan by J.P. Morgan Securities (Taiwan Limited). India: For private circulation only, not for sale. Pakistan: For private circulation only, not for sale. New Zealand: This material is issued and distributed by JPMSAL in New Zealand only to persons whose principal business is the investment of money or who, in the course of and for the purposes of their business, habitually invest money. JPMSAL does not issue or distribute this material to members of "the public" as determined in accordance with section 3 of the Securities Act 1978. The recipient of this material must not distribute it to any third party or outside New Zealand without the prior written consent of JPMSAL. Canada: The information contained herein is not, and under no circumstances is to be construed as, a prospectus, an advertisement, a public offering, an offer to sell securities described herein, or solicitation of an offer to buy securities described herein, in Canada or any province or territory thereof. Any offer or sale of the securities described herein in Canada will be made only under an exemption from the requirements to file a prospectus with the relevant Canadian securities regulators and only by a dealer properly registered under applicable securities laws or, alternatively, pursuant to an exemption from the dealer registration requirement in the relevant province or territory of Canada in which such offer or sale is made. The information contained herein is under no circumstances to be construed as investment advice in any province or territory of Canada and is not tailored to the needs of the recipient. To the extent that the information contained herein references securities of an issuer incorporated, formed or created under the laws of Canada or a province or territory of Canada, any trades in such securities must be conducted through a dealer registered in Canada. No securities commission or similar regulatory authority in Canada has reviewed or in any way passed judgment upon these materials, the information contained herein or the merits of the securities described herein, and any representation to the contrary is an offence. Dubai: This report has been issued to persons regarded as professional clients as defined under the DFSA rules. Brazil: Ombudsman J.P. Morgan: 0800-7700847 / [email protected]. General: Additional information is available upon request. Information has been obtained from sources believed to be reliable but JPMorgan Chase & Co. or its affiliates and/or subsidiaries (collectively J.P. Morgan) do not warrant its completeness or accuracy except with respect to any disclosures relative to JPMS and/or its affiliates and the analyst's involvement with the issuer that is the subject of the research. All pricing is as of the close of market for the securities discussed, unless otherwise stated. Opinions and estimates constitute our judgment as of the date of this material and are subject to change without notice. Past performance is not indicative of future results. This material is not intended as an offer or solicitation for the purchase or sale of any financial instrument. The opinions and recommendations herein do not take into account individual client circumstances, objectives, or needs and are not intended as recommendations of particular securities, financial instruments or strategies to particular clients. The recipient of this report must make its own independent decisions regarding any securities or financial instruments mentioned herein. JPMS distributes in the U.S. research published by non-U.S. affiliates and accepts responsibility for its contents. Periodic updates may be provided on companies/industries based on company specific developments or announcements, market conditions or any other publicly available information. Clients should contact analysts and execute transactions through a J.P. Morgan subsidiary or affiliate in their home jurisdiction unless governing law permits otherwise. "Other Disclosures" last revised November 29, 2014. Copyright 2015 JPMorgan Chase & Co. All rights reserved. This report or any portion hereof may not be reprinted, sold or redistributed without the written consent of J.P. Morgan. #$J&098$#*P
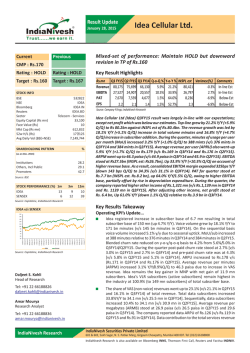
© Copyright 2026