
Torrent Pharmaceuticals
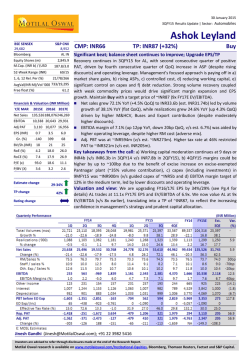
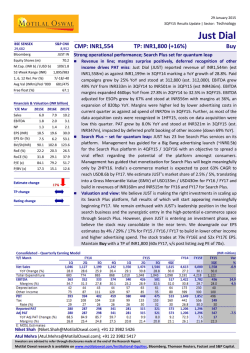
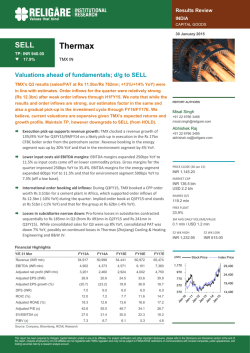
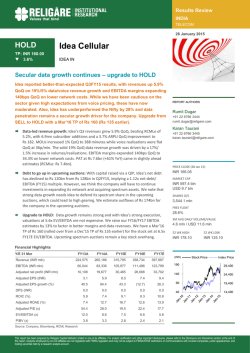
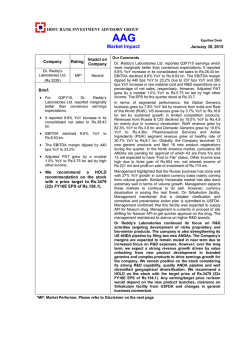
29 January 2015 3QFY15 Results Update | Sector: Healthcare Torrent Pharmaceuticals BSE SENSEX 29,682 Bloomberg S&P CNX 8,952 TRP IN Equity Shares (m) 169.2 M.Cap. (INR b) / (USD b) 192.5/3.1 52-Week Range (INR) 1,232/512 1, 6, 12 Rel.Per (%) -5/43/72 Avg Val(INR M)/Vol ‘000 Free float (%) 88/115 28.5 Financials & Valuation (INR Billion) Y/E MAR 2015E 2016E 2017E Net Sales 46.8 57.2 66.6 EBITDA 11.0 14.5 17.3 Adj PAT Adj.EPS ( ) Gr. (%) 7.0 8.6 10.8 41.3 50.9 64.0 30.2 BV/Sh.(INR) 143.5 RoE (%) 32.2 23.3 25.9 176.7 218.6 31.8 32.4 RoCE (%) 28.4 25.4 28.2 P/E (x) 27.6 22.4 17.8 P/BV (X) 7.9 6.4 5.2 Estimate change TP change Rating change CMP: INR1,138 TP: INR1,410 (+24%) Buy In-line quarter; Await further margin accretion from Elder portfolio 3Q profits at INR 1.7b (up 6% YoY) was above expectations, thanks to lower tax rate (17% vs 21% est) and higher other income (mainly fx gains). Operational numbers were 3-4% below forecast as forex fluctuation hurt EU/Latam sales (1/3rd of total). Revenues grew 15% YoY to INR 11.7b while EBITDA expanded 12% YoY to INR 2.4b, mainly as EBITDA margins were subdued at 20.5% (vs 20.7% estimate). Domestic growth robust, improved pace of new launches to fuel US growth: India business growth (ex-Elder) was at 15% (vs 11% for industry) as sequential growth in Elder portfolio was restrained due to channel filling in 2Q. Delay in product launch and currency movement hurt EU sales (down 9% YoY) while Latam business sustained healthy traction (up 19% in constant currency, 6% in INR terms). Fewer new launches in US restricted growth (up 16% YoY, 3% QoQ) but we expect interesting launches like gDetrol, gNexium, gAbilify to fuel growth momentum in coming quarters. Over FY1517E, we project TRP’s revenues to grow at 19% CAGR. Margin expansion likely from high-impact US launches, Elder brands synergy: EBITDA margins at 20.5% (down 60bp YoY) were impacted by lower US sales, partial impact of price hikes in Elder portfolio and forex fluctuation (Eu/Latam/Russia). We expect EBITDA margins to expand by 260bp over FY15-17E led by (a) synergies from Elder brand acquisition (300 MRs reduction in FY15, price hikes, cross selling), (b) high impact US launches and (c) improved MR productivity in India (by 25% in ~3 yrs). Hence, EBITDA is likely to outpace revenue growth at 25% CAGR over FY15-17E. Earnings acceleration to drive valuation upside: Despite the recent stock outperformance, we are optimistic on TRP’s prospects for further re-rating due to (a) strong earnings growth at 25% CAGR, (b) earlier than expected payback of Elder brand acquisition (within five years vs 7-8 years initially assumed), (c) reduced leverage (D/E to improve to 0.6x by FY17E v/s 1x now). Regulatory delays affecting US launches, impact of price control (India/Brazil) are key risks to our thesis. Maintain Buy rating with target price of INR 1,410 (22x FY17E EPS, in line with sector average). q Arvind Bothra ([email protected]);+91 22 3982 5584 Amey Chalke ([email protected]);+91 22 3982 5423 Investors are advised to refer through disclosures made at the end of the Research Report. Motilal Oswal research is available on www.motilaloswal.com/Institutional-Equities, Bloomberg, Thomson Reuters, Factset and S&P Capital. Torrent Pharmaceuticals 3Q Result analysis Exhibit 1: Quarterly Snapshot (Revenue mix) (INR m) Revenue split USA India Europe LatAm RoW CRAMs Total revenues 3Q FY14 2Q FY15 3Q FY15 %YoY 1,480 2,970 2,480 1,480 950 540 9,900 1,668 4,420 2,480 1,600 970 893 12,030 1,710 4,200 2,270 1,560 1,060 760 11,560 15.5 41.4 (8.5) 5.4 11.6 40.7 16.8 %QoQ Comments Fewer new launches restricted growth 2.5 Ex-Elder brands, growth was robust at 15% (5.0) (8.5) Price erosion in Seroquel, deferred shipment affected growth Growth in constant currency was robust (19%) (2.5) 9.3 (14.8) Revenues were marginally below expectations (3.9) Source: Company, MOSL Exhibit 2: Quarterly Profit and Loss statement (INR m) Total revenues Other operating income Operating income Cost of revenues Gross profit Gross margin (%) Staff cost % of Total Revenues Other expense % of Total Revenues EBITDA EBITDA margin (%) Depreciation expenses EBIT Interest cost Other (expenses)/income net PBT Income tax (benefit)/expense Effective tax rate (%) Net Profit - reported Adjusted Net Profit 3Q FY14 9,900 250 10,150 3,180 6,970 67.9 1,790 18.1 3,030 30.6 2,150 21.2 210 1,940 160 100 1,880 300 16.0 1,580 1,580 2Q FY15 12,030 140 12,170 3,810 8,360 68.3 2,240 18.6 3,390 28.2 2,730 22.4 560 2,170 540 720 2,350 370 15.7 1,980 1,980 3Q FY15 %YoY %QoQ Comments 11,560 16.8 (3.9) 120 (52.0) (14.3) 11,680 15.1 (4.0) 3,720 17.0 (2.4) 7,960 14.2 (4.8) 67.8 (6)bp (51)bp Adverse currency movement impacted gross margins 1,990 11.2 (11.2) Impact of reduction in 150 MRs (Elder synergies) 17.2 (87)bp (141)bp 3,570 17.8 5.3 30.9 28 bp 270 bp 2,400 11.6 (12.1) 20.5 (63)bp (188)bp Margins were slightly below expectations (20.7%) 540 157.1 (3.6) 1,860 (4.1) (14.3) 500 212.5 (7.4) 650 550.0 (9.7) Includes MTM forex gains 2,010 6.9 (14.5) 340 13.3 (8.1) 16.9 96 bp 117 bp Lower than expected tax rates boosted net profits 1,670 5.7 (15.7) 1,670 5.7 (15.7) Source: Company, MOSL Forex fluctuation hurt revenue momentum 3Q Revenues grew 15% YoY to INR11.7b, 3% lower than our estimates, attributed to currency fluctuation impacting Europe/Latam business. Slower pace of new product approvals restricted US ramp-up, while domestic growth was robust (up 15% YoY, ex-Elder portfolio). RoW sales reported 12% YoY to INR1.1b, aided by a favorable base. We expect revenue momentum to pick up gradually; as full impact price hikes in domestic market (Elder portfolio) gets reflected and new launches in US picks up momentum. 29 January 2015 2 Torrent Pharmaceuticals Exhibit 3: Quarterly sales (INR b) Sales (INR b) 29 27 25 15 8 8 8 9 10 10 10 12 11 12 12 4QFY13 1QFY14 2QFY14 3QFY14 4QFY14 1QFY15 2QFY15 3QFY15 15 12 3QFY13 27 2QFY13 27 1QFY13 18 YoY growth (%) 41 15 Source: Company, MOSL US (19% of sales): US business grew 16% YoY to INR1.7b, lower than our expectations due to slower ramp up in newly launched products. Traction in new launches over the last 3 quarters has lagged expectations as market share gains have been steady. Moreover, pace of ANDA approvals has also slowed, impacting growth in US. Only 1 ANDA was filed during this quarter. TRP received 2 ANDA approvals in 3QFY15 for gWellbutrin SR and gLuvox. TRP has maintained its guidance to launch 8-10 products each year. Cumulatively, Torrent has received 53 ANDA approvals and has 19 pending filings till date (another 44 under development). The company expects to file 10-12 new ANDAs annually and has visibility for 911 new launches in FY16E. With interesting launches like gNexium, gDetrol, gExforge expected over the next 3-4 quarters, we expect growth momentum in US to accelerate (adjusted for one-off sales from gCymbalta last year). Exhibit 4: US revenues (Quarterly) US base sales (USD m) One-offs (USD m) 37 21 15 17 17 17 20 19 17 28 24 25 25 3QFY13 4QFY13 1QFY14 2QFY14 3QFY14 4QFY14 1QFY15 2QFY15 3QFY15 4 2QFY13 3 1QFY13 7 Source: Company, MOSL 29 January 2015 India (28% of sales): India business registered 42% growth YoY (INR 4.2b), aided by recent addition of acquired portfolio (Elder). Excluding Elder brands, India business grew 15% for this quarter, much ahead of industry growth of 11%. We believe the full impact of price hike undertaken in Elder portfolio (in midNov’14) would reflect from next quarter, improving revenue growth as well as profitability. Growth in Elder portfolio on sequential basis was affected by channel filling in 2QFY15. Revenue contribution from the acquired business stood at ~INR800m, which will continue to see higher growth for the next few quarters. Improved traction in Elder portfolio with sharper focus as well as 183 Torrent Pharmaceuticals 20 new launches annually should help Torrent outpace industry growth over medium term. Exhibit 5: India Revenues (Quarterly) India sales (INR b) Elder sales (INR b) YoY growth (%) 49 3 3 2 3 2QFY13 3QFY13 4QFY13 1QFY14 3 15 17 3 3 3 3 3 3QFY15 3 10 2QFY15 12 1QFY15 10 4QFY14 13 41 0.8 3QFY14 15 2QFY14 13 1QFY13 0.9 13 Source: Company, MOSL Brazil (13% of sales): Brazil business grew 6% in 3Q, affected by currency depreciation as constant currency growth was higher at 19% YoY. Volume growth has been the primary driver for the company. TRP has also entered into Institutional business in Brazil and is witnessing good traction in this segment. Nebivolol continues to do well with 29% market share in branded market. Torrent expects to continue outpacing industry growth led by focus on specialty segment, improvement in MR productivity and scale-up of power brands. Europe (22% of sales): Europe business suffered from deferment of new launches, price erosion in key brand Seroquel (generic) as well as currency depreciation, registering a decline of 9% YoY. Constant currency growth was flat during the quarter. Management expects pick-up in growth in the coming quarters as it continues to be successful in tender business participation in Germany (130 molecules in the market). ROW (9% of sales): Despite sharp depreciation of Russian currency affecting growth (Russia is 3-4% of total sales), RoW business grew 12% YoY, led by Mexican operations. Rapid pace of new launches in Mexico, Malaysia and Philippines as well as expanded geographical reach would aid healthy growth in RoW business. Exhibit 6: Brazil revenues (Quarterly) Brazil (INR b) YoY growth (%) 12 8 6 5 -2 1.3 1.3 1.3 1.5 -4 1.3 1.5 1.6 1.6 1QFY14 2QFY14 3QFY14 4QFY14 1QFY15 2QFY15 3QFY15 -3 4QFY13 2QFY13 1QFY13 -7 1.2 3QFY13 1.2 1.4 28 26 26 Source: Company, MOSL 29 January 2015 4 Torrent Pharmaceuticals Margins in line, expect improving trajectory ahead 3Q EBITDA margin declined 60bp YoY to 20.5% (vs 20.7% est), mainly restricted by slower US growth and higher staff costs. Consequently, EBITDA grew slower than top line at 12% YoY to INR 2.4b (vs INR 2.5b est). We believe that full impact of price hikes taken in Elder portfolio would be seen from 4QFY15 and help in margin expansion. Over FY15-17E, we expect Torrent’s EBITDA margins to improve from 23.5% to 26% driven by (a) Improved MR productivity in domestic business (management is targeting improvement from INR 5m per person annually to INR 9.6m per person annually), (b) scale-up in US business backed by high value launches like gNexium, gAbilify, etc and (c) improved profitability in Latam business. Net profit beat led by higher other income TRP reported 6% growth in net profits at INR 1.7b, 10% ahead of our expectations, mainly due to higher other income of INR 650m (vs INR550m est) and lower effective tax rate of 17% (21% est). Other income largely comprised of forex gains arising out of hedges (mainly for European business). Operational results however were largely in line. Excluding the impact of one-off sales in 3QFY14 (Cymbalta), there was a PBT/PAT growth of 30%+ during the quarter (per management). Exhibit 7: EBITDA margins moderated with lower Cymbalta 71.8 75.2 26.1 1.0 1.1 1.2 1.5 1.1 1.3 1QFY14 2QFY14 3QFY14 2.4 2.6 2.0 1.7 3QFY15 1.0 4QFY13 17.4 17.9 3QFY13 3QFY15 46.3 35.0 2QFY13 2.4 (3.7) 105.0 1QFY13 2.7 Source: Company, MOSL 29 January 2015 112.6 14.1 2QFY15 2.2 3.5 1QFY15 1.8 4QFY14 3QFY13 2.1 3QFY14 2QFY13 2.2 2QFY14 1.6 1QFY14 1.4 4QFY13 1.6 1QFY13 3.5 YoY growth (%) 2QFY15 EBITDA margin (%) 31.0 28.6 25.3 22.4 20.5 21.4 21.2 20.3 18.8 20.2 18.4 1QFY15 EBITDA (INR b) Exhibit 8: PAT growth trends PAT (INR m) 4QFY14 sales Source: Company, MOSL 5 Torrent Pharmaceuticals Key earnings call takeaways 29 January 2015 Fund raising plans: Torrent has announced fund raising plans of upto INR 105bn, including INR 30b equity (15% of current market cap) through QIP route and upto INR 75b from debt. Management has indicated that it would utilized for future acquisition in US, In organic growth opportunities in India and debt reduction. Robust US pipeline to drive growth: US business witnessed moderated growth over high base, lack of new launches and slow ramp up in existing products. The company has plans to launch gAbilify (Mkt size: USD1.6b, under litigation, 4-5 tentative approvals), gDetrol LA(USD 590m, 2 players in market) filed), gExforge HCT(USD 160m, one player in market), gDiovan HCT(USD1.7b) and gNexium(USD 2.3b, more than 10 players in para IVs). We believe these incremental launches would drive strong growth momentum in US over FY1617E. Moderate capex requirement: Capex guidance stands at INR2-2.5b for next two years (vs INR 7b over FY13-14). The company has plans to commission its Dahej SEZ formulation facility in 2HFY16 thereby de-risking regulatory exposure to single facility for US. Price hike in Elder portfolio: The company undertook price hike in key brands acquired from Elder Pharma (namely Shelcal, Chymoral and Carnisure) in midNovember (2014). The impact of the same was partially reflected in 3Q and is likely to be prominently seen in the coming quarters. Moreover, the company also has plans to discontinue volume discount for key products as well as reduce trade margins, thereby boosting profitability for domestic business. 6 Torrent Pharmaceuticals Operating metrics Exhibit 9: Key operating metrics 4QFY12 1QFY13 2QFY13 3QFY13 4QFY13 1QFY14 2QFY14 3QFY14 4QFY14 1QFY15 2QFY15 3QFY15 USA 9.3 10.3 11.9 11.5 10.6 11.6 11.8 14.6 32.6 24.1 13.7 14.6 India 29.4 36.2 34.9 32.4 25.0 32.1 30.6 29.3 20.9 31.6 36.3 36.0 Europe 19.6 17.1 19.6 19.5 24.2 20.1 24.2 24.4 20.5 20.6 20.4 19.4 LatAm 18.5 17.7 14.9 14.7 15.3 13.7 12.9 14.6 10.4 13.4 13.1 13.4 RoW 10.0 9.2 8.9 9.8 9.4 8.7 10.0 9.4 8.4 7.7 8.0 9.1 CRAMs 12.4 8.9 9.0 11.4 14.6 12.5 10.5 7.8 7.2 2.6 8.5 5.7 Revenue Gr. (%) 34.5 21.0 13.3 14.1 22.7 22.9 25.1 28.6 50.4 20.8 28.7 16.8 USA 314.5 88.3 70.5 43.8 46.0 43.2 24.5 60.9 334.8 137.6 45.0 15.5 India 10.1 13.5 14.7 12.7 9.8 12.3 9.6 14.9 17.4 12.8 48.8 41.4 Europe 14.9 8.1 5.5 8.3 59.5 49.0 54.2 59.0 19.0 17.3 5.5 (8.5) LatAm 58.2 26.2 (6.5) (2.5) 6.3 (1.8) 7.7 26.5 (3.8) 12.0 28.0 5.4 RoW 20.8 68.3 19.7 30.0 21.7 20.6 41.0 21.8 25.6 1.2 - 11.6 CRAMs 24.6 (19.5) 1.1 5.6 17.5 4.9 50.8 (28.0) (14.9) (61.9) (2.0) 15.0 Raw material 34.1 29.9 29.5 32.1 30.3 33.7 32.2 32.1 26.5 27.6 31.7 32.2 Staff cost 22.1 20.8 21.1 20.0 20.4 19.0 19.4 18.1 17.2 16.8 18.6 17.2 Other expenses 34.0 32.3 33.9 30.7 30.4 31.9 33.1 30.6 28.7 26.0 28.2 30.9 3.6 26.6 24.1 21.6 24.5 20.3 25.7 16.0 23.0 26.6 15.7 21.0 Gross Margins 65.9 70.1 70.5 67.9 69.7 66.3 67.8 67.9 73.5 72.4 68.3 67.8 EBITDA Margins 12.6 20.3 18.8 20.2 25.3 21.4 18.4 21.2 28.6 31.0 22.4 20.5 EBIT Margins 9.4 17.7 16.2 17.7 22.7 19.2 16.2 19.1 26.7 29.1 17.8 15.9 PAT margins 8.3 13.3 12.6 14.1 13.7 15.3 11.6 15.6 19.9 23.0 16.3 14.3 Source: Company; MOSL Revenue Mix (%) As % of sales Tax Rate Margins (%) 29 January 2015 7 Torrent Pharmaceuticals Valuation and view Strong traction in US business (including one-off) as well as expectations of higher synergy benefits from Elder’s domestic portfolio acquisition has aided re-rating for TRP over the last twelve months. We expect core earnings (excluding one-offs) trajectory to remain strong (forecast 25% CAGR over FY15-17E) as we think margin upside in domestic portfolio is still not fully reflected. We expect the stock trade much above its historic P/E band due to higher revenue visibility and deleveraging prospects. Our TP of INR 1410 implies 24% upside from current levels. Our TP discounts TRP’s base business at 22x FY17E P/E, in line with current sector average multiple. This is at the higher end of its historical average and in line with current multiples (22.4x FY16E). Sustenance of high earnings growth and de-leveraging of Balance Sheet justify upward shift of its average P/E band upwards. Key catalysts to drive stock’s performance over the medium term are: Improvement in EBITDA margin, mainly on stronger contribution from Elder brands Execution in key US launches including gAbilify, gNexium, gExforge Improved free cash generation, driving Balance Sheet deleveraging Risks to our investment thesis: Regulatory delays could affect timely launch of key US launches. Increased span of drug price control could hurt domestic business (34% of total sales) Unstable currency and macroeconomic outlook for key emerging markets like Brazil/Russia could dampen growth prospects. Exhibit 10: TRP has re-rated structurally (1 yr forward P/E band) Exhibit 11: TRP trades at 18% discount to Sensex P/E (LPA) PE (x) Median(x) 27 Peak(x) Min(x) Torrent Pharma PE Relative to Sensex PE (%) LPA (%) Avg(x) 22.8 22 22.2 100 40.6 50 17 12.9 12.6 12 7 0 -17.9 -50 3.9 2 Source: Company, MOSL 29 January 2015 Jan-15 Oct-13 Jul-12 Apr-11 Jan-10 Oct-08 Jul-07 Apr-06 Jan-05 Jan-15 Oct-13 Jul-12 Apr-11 Jan-10 Oct-08 Jul-07 Apr-06 Jan-05 -100 Source: Company, MOSL 8 Torrent Pharmaceuticals Story in charts Exhibit 12: Formulation led sales growth Formulations (INR b) Exhibit 13: Domestic sales growth led by Elder acqn. in FY15E Revenues (INR m) CRAMS (INR b) Growth (%) 38.1 3 31.6 3 3 15.5 3 2 16 2 14 3 3 2 19 15.5 24 8.5 28 38 44 53 62 FY09 FY10 FY11 FY12 FY13 FY14 FY15E FY16E FY17E 12.7 7,254 8,377 9,090 10,240 11,620 16,050 21,129 24,823 FY10 FY11 FY12 FY13 FY14 US base sales (USD m) One-offs (USD m) Exhibit 15: Latam - Gradual recovery ahead Latam revenues (INR m) 8 32 151 19 25 FY10 FY11 65 45 FY12 FY13 183 17.4 19.9 5,020 105 84 5.2 FY14 FY15E FY16E FY17E 3,012 3,612 4,770 FY10 FY11 FY12 FY13 12.7 14.8 15.0 5,340 6,017 6,907 7,943 FY14 FY15E FY16E FY17E 6.4 Source: Company, MOSL Exhibit 16: Europe business to grow at 15% over FY15-17E Europe (INR m) Growth (%) Source: Company, MOSL Exhibit 17: Healthy return ratios 42.0 ROIC (%) 36.2 43.1 21.1 20.7 3.5 FY10 28.8 4,492 5,421 6,500 9,300 9,731 4.6 11,171 12,846 FY11 FY12 FY13 FY14 FY15E FY16E FY17E Source: Company, MOSL 31.1 32.3 32.2 31.8 29.9 22.5 22.5 14.8 15.0 29 January 2015 29.7 33.5 25.7 RoE (%) 36.0 29.2 19.9 3,710 Growth (%) 32.1 8 44 FY15E FY16E FY17E Source: Company, MOSL Source: Company, MOSL Exhibit 14: Base sales to grow at ~30% over FY15-17E 17.5 13.5 32.4 26.3 17.3 FY09 FY10 FY11 FY12 FY13 FY14 FY15E FY16E FY17E Source: Company, MOSL 9 Torrent Pharmaceuticals Exhibit 18: EBITDA growth (%) Exhibit 19: Gross margin to improve over FY16-17E EBITDA (INR b) 43.5 36.3 34.6 37.3 32.8 32.1 4 -5.1 4 5 7 10 11 EBITDA Margin (%) 67.2 70.0 68.3 68.0 71.2 70.3 69.4 71.3 71.3 18.4 21.5 17.6 19.4 21.6 22.7 23.4 25.4 26.0 FY09 FY10 FY11 FY12 FY13 FY14 FY15E FY16E FY17E 19.1 15.4 3 Gross Margin (%) EBITDA growth (%) 15 17 FY09 FY10 FY11 FY12 FY13 FY14 FY15E FY16E FY17E Source: Company, MOSL Source: Company, MOSL Exhibit 20: ANDA filed v/s pending ANDA filed Core EPS (INR/ share) ANDA pending One off 72 70 67 64 58 Exhibit 21: Core EPS to grow at 25% CAGR (FY15-17E) 0 45 32 29 21 FY09 FY10 32 FY11 27 FY12 8 24 21 19 FY13 FY14 YTD 0 3 1 14 16 16 19 28 32 41 51 64 0 -2 -3 -4 FY09 FY10 FY11 FY12 FY13 FY14 FY15E FY16E FY17E Source: Company, MOSL Source: Company, MOSL Exhibit 22: Market share(%) of Micardis HCT in US; reflecting gradual ramp up ROXANE BI TORRENT MYLAN QUALITEST 50.0 40.0 36.0 30.0 27.6 19.0 20.0 Jan-15 Dec-14 Dec-14 Nov-14 Nov-14 Oct-14 Oct-14 Sep-14 Sep-14 Aug-14 Aug-14 Aug-14 Jul-14 Jul-14 Jun-14 Jun-14 - Jan-15 14.9 2.5 10.0 Source: Bloomberg, MOSL 29 January 2015 10 Torrent Pharmaceuticals Corporate profile Company description Exhibit 23: Sensex rebased Torrent Pharma is one of the second tier Pharma companies that is actively targeting the regulated generics and semi-regulated markets. The company has strong presence in domestic market with focus and leadership in CVS and CNS segments. Recent acquisition of Elder’s brand in India strengthens its positioning further. The company has large presence in some of the key global markets like Brazil and Germany while it is expanding its footprint in key markets like US, Europe (excl. Germany) and RoW. Exhibit 24: Shareholding pattern (%) Dec-14 Exhibit 25: Top holders Sep-14 Dec-13 Promoter 71.5 71.5 71.5 DII 6.5 6.5 8.1 FII 12.9 12.8 10.5 Others 9.1 9.1 9.8 Holder Name % Holding Lavender Investments Ltd Franklin Templeton Investment Funds HDFC Trustee Company Ltd-HDFC Mid Cap 2.7 2.3 1.2 Note: FII Includes depository receipts Exhibit 26: Top management Exhibit 27: Directors Name Designation Name Name Sudhir Mehta Chairman Sudhir Mehta Markand Bhatt Pradeep Bhargava* Chaitanya Dutt Haigreve Khaitan* Samir Mehta Shailesh Haribhakti* *Independent Exhibit 28: Auditors Exhibit 29: MOSL forecast v/s consensus Name Type Delloite Haskins & Sells Kirit Mehta & Co Statutory Cost Auditor 29 January 2015 EPS (INR) FY15 FY16 FY17 MOSL forecast 41.3 50.9 64.0 Consensus forecast 45.5 52.3 63.6 Variation (%) -9.3 -2.7 0.6 11 Torrent Pharmaceuticals Financials and valuations Key assumption Segment growth USA India Europe LatAm RoW CRAMs Total Sales Expenses Cost of sales (%) EBITDA Margin (%) 2010 227.0 15.5 3.5 17.4 28.9 12.8 13.4 2011 25.7 15.5 21.1 19.9 18.6 13.4 15.7 2012 89.2 8.5 20.7 32.1 67.8 41.2 27.2 2013 64.2 12.7 19.9 5.2 30.8 1.4 19.1 2014 118.6 13.5 43.1 6.4 27.9 0.3 30.3 2015E 6.7 38.1 4.6 12.7 1.1 (7.8) 11.9 2016E 14.9 31.6 14.8 14.8 14.8 12.0 22.2 2017E 20.0 17.5 15.0 15.0 15.0 12.0 16.3 30.0 21.5 31.7 17.6 32.0 19.4 28.8 21.6 29.7 22.7 30.6 23.4 28.8 25.4 28.8 26.0 2010 19,040 16.8 14,953 78.5 4,087 21.5 661 3,426 291 216 3,352 -84 3,436 705 -74 631 18.8 2,805 0 2,805 2,680 2011 21,978 15.4 18,100 82.4 3,878 17.6 626 3,252 391 347 3,208 -168 3,376 751 -15 736 22.9 2,640 0 2,640 2,702 2012 26,961 22.7 21,743 80.6 5,218 19.4 817 4,400 395 445 4,451 863 3,588 690 40 730 16.4 2,858 23 2,835 3,287 2013 32,120 19.1 25,190 78.4 6,930 21.6 830 6,100 340 430 6,190 370 5,820 1,732 -262 1,470 23.8 4,350 20 4,330 4,705 2014 41,840 30.3 32,326 77.3 9,514 22.7 870 8,644 586 381 8,439 0 8,439 2,246 -445 1,801 21.3 6,638 0 6,638 5,362 2015E 46,849 12.0 35,869 76.6 10,980 23.4 1,890 9,090 1,840 2,310 9,560 0 9,560 2,044 0 2,044 21.4 7,516 0 7,516 6,981 2016E 57,236 22.2 42,727 74.7 14,509 25.4 2,318 12,191 2,198 900 10,893 0 10,893 2,233 0 2,233 20.5 8,660 0 8,660 8,606 Income Statement Y/E March Net Sales Change (%) Total Expenditure % of Sales EBITDA Margin (%) Depreciation EBIT Int. and Finance Charges Other Income - Rec. PBT before EO Expense EO Expense/(Income) PBT after EO Expense Current Tax Deferred Tax Tax Tax Rate (%) Reported PAT Less: Minority Interest Net Profit Adj PAT 29 January 2015 (INR Million) 2017E 66,578 16.3 49,301 74.1 17,277 26.0 2,491 14,786 2,018 950 13,719 0 13,719 2,812 0 2,812 20.5 10,906 0 10,906 10,838 12 Torrent Pharmaceuticals Financials and valuations Balance Sheet Y/E March Equity Share Capital Total Reserves Net Worth Minority Interest Deferred liabilities Total Loans Capital Employed Net Fixed Assets Capital WIP Investments Curr. Assets Inventory Account Receivables Cash and Bank Balance Loans & Advances Curr. Liability & Prov. Account Payables Provisions Net Current Assets Appl. of Funds (INR Million) 2010 423 7,887 8,310 0 499 5,224 14,033 5,411 1,098 1,412 11,607 3,236 2,982 3,883 1,506 5,496 4,216 1,280 6,111 14,033 2011 423 9,801 10,224 16 480 5,720 16,440 6,355 1,799 1,460 15,742 5,048 3,404 4,788 2,502 8,916 7,490 1,427 6,826 16,440 2012 423 11,515 11,938 35 514 5,786 18,274 7,968 1,188 1,240 20,081 5,315 5,228 6,743 2,795 12,202 10,395 1,807 7,878 18,274 2013 423 13,796 14,219 4 257 7,030 21,510 8,198 2,853 605 25,872 9,239 6,878 6,270 3,485 16,017 12,297 3,720 9,855 21,510 2014 846 18,178 19,024 4 -182 11,418 30,264 8,753 5,341 1,857 34,091 10,061 10,994 7,694 5,342 19,777 16,239 3,538 14,314 30,265 2015E 846 23,441 24,287 4 275 25,418 49,983 30,978 3,171 1,857 33,217 10,456 9,838 7,047 5,876 19,299 13,924 5,375 13,918 49,923 2016E 846 29,061 29,907 4 275 23,418 53,604 31,702 2,085 1,857 39,687 12,012 12,020 9,192 6,463 21,787 15,992 5,796 17,900 53,544 2017E 846 36,139 36,986 4 275 21,418 58,682 32,732 1,543 1,857 47,729 13,973 13,981 12,665 7,110 25,239 18,597 6,642 22,490 58,622 2010 2011 2012 2013 2014 2015E 2016E 2017E 15.8 20.5 49.1 6.0 21.1 16.0 19.3 60.4 8.0 29.8 19.4 21.6 70.5 8.5 29.2 27.8 30.5 84.0 23.0 52.3 31.7 44.4 112.4 10.0 29.8 41.3 55.6 143.5 13.3 35.1 50.9 64.9 176.7 15.4 35.1 64.0 79.2 218.6 19.3 35.1 35.9 25.6 10.1 4.7 20.6 0.9 27.6 20.5 7.9 4.5 19.2 1.2 22.4 17.5 6.4 3.6 14.3 1.3 17.8 14.4 5.2 3.0 11.7 1.7 E: MOSL Estimates Ratios Y/E March Basic EPS (INR) EPS Cash EPS BV/Share DPS Payout (%) Valuation (x) P/E Cash P/E P/BV EV/Sales EV/EBITDA Dividend Yield (%) Return Ratios (%) RoE RoCE Working Capital Ratios Fixed Asset Turnover (x) Debtor (Days) Inventory (Days) Working Capital Turnover(Days) Leverage Ratio (x) Interest Cover Ratio Debt/Equity 29 January 2015 36.2 29.3 29.2 24.4 29.7 28.8 36.0 33.5 32.3 34.9 32.2 28.4 31.8 25.4 32.4 28.2 3.6 56 62 43 3.7 55 84 34 3.8 71 72 15 4.0 78 105 41 4.9 96 88 58 2.4 77 81 54 1.8 77 77 56 2.1 77 77 54 11.8 0.6 8.3 0.6 11.2 0.5 17.9 0.5 14.7 0.6 4.9 1.0 5.5 0.8 7.3 0.6 13 Torrent Pharmaceuticals Financials and valuations (INR Million) Cash Flow Statement Y/E March Oper. Profit/(Loss) before Tax Interest/Dividends Recd. Direct Taxes Paid (Inc)/Dec in WC CF from Operations 2010 4,087 216 -716 349 3,937 2011 3,878 347 -755 190 3,660 2012 5,218 445 -696 902 5,869 2013 6,930 430 -1,728 -2,449 3,183 2014 9,514 381 -2,239 -3,034 4,622 2015E 10,980 2,310 -1,588 -252 11,450 2016E 14,509 900 -2,233 -1,837 11,340 2017E 17,277 950 -2,812 -1,117 14,297 EO Expense / (Income) CF from Operating incl EO Expense -84 4,021 -168 3,828 863 5,006 370 2,813 0 4,622 0 11,450 0 11,340 0 14,297 -1,487 -17 -1,504 -2,214 -48 -2,262 -1,736 220 -1,516 -2,460 636 -1,825 -3,904 -1,252 -5,156 -21,665 0 -21,665 -1,957 0 -1,957 -2,979 0 -2,979 0 398 -291 -592 -449 -934 0 512 -391 -787 5 -661 0 85 -395 -836 -390 -1,535 0 1,212 -340 -2,273 -61 -1,462 423 4,388 -586 -1,980 -286 1,959 0 14,000 -1,840 -2,638 45 9,567 0 -2,000 -2,198 -3,040 0 -7,237 0 -2,000 -2,018 -3,828 0 -7,846 1,583 2,300 3,883 905 3,883 4,788 1,955 4,788 6,743 -473 6,743 6,270 1,425 6,270 7,694 -647 7,694 7,047 2,145 7,047 9,192 3,473 9,192 12,665 (inc)/dec in FA (Pur)/Sale of Investments CF from Investments Issue of shares (Inc)/Dec in Debt Interest Paid Dividend Paid Others CF from Fin. Activity Inc/Dec of Cash Add: Beginning Balance Closing Balance 29 January 2015 14 Torrent Pharmaceuticals NOTES 29 January 2015 15 Torrent Pharmaceuticals Disclosures This document has been prepared by Motilal Oswal Securities Limited (hereinafter referred to as Most) to provide information about the company(ies) and/sector(s), if any, covered in the report and may be distributed by it and/or its affiliated company(ies). This report is for personal information of the selected recipient/s and does not construe to be any investment, legal or taxation advice to you. This research report does not constitute an offer, invitation or inducement to invest in securities or other investments and Motilal Oswal Securities Limited (hereinafter referred as MOSt) is not soliciting any action based upon it. This report is not for public distribution and has been furnished to you solely for your general information and should not be reproduced or redistributed to any other person in any form. This report does not constitute a personal recommendation or take into account the particular investment objectives, financial situations, or needs of individual clients. Before acting on any advice or recommendation in this material, investors should consider whether it is suitable for their particular circumstances and, if necessary, seek professional advice. The price and value of the investments referred to in this material and the income from them may go down as well as up, and investors may realize losses on any investments. Past performance is not a guide for future performance, future returns are not guaranteed and a loss of original capital may occur. MOSt and its affiliates are a full-service, integrated investment banking, investment management, brokerage and financing group. We and our affiliates have investment banking and other business relationships with a some companies covered by our Research Department. Our research professionals may provide input into our investment banking and other business selection processes. Investors should assume that MOSt and/or its affiliates are seeking or will seek investment banking or other business from the company or companies that are the subject of this material and that the research professionals who were involved in preparing this material may educate investors on investments in such business. The research professionals responsible for the preparation of this document may interact with trading desk personnel, sales personnel and other parties for the purpose of gathering, applying and interpreting information. Our research professionals are paid on the profitability of MOSt which may include earnings from investment banking and other business. MOSt generally prohibits its analysts, persons reporting to analysts, and members of their households from maintaining a financial interest in the securities or derivatives of any companies that the analysts cover. Additionally, MOSt generally prohibits its analysts and persons reporting to analysts from serving as an officer, director, or advisory board member of any companies that the analysts cover. Our salespeople, traders, and other professionals or affiliates may provide oral or written market commentary or trading strategies to our clients that reflect opinions that are contrary to the opinions expressed herein, and our proprietary trading and investing businesses may make investment decisions that are inconsistent with the recommendations expressed herein. In reviewing these materials, you should be aware that any or all of the foregoing among other things, may give rise to real or potential conflicts of interest. MOSt and its affiliated company(ies), their directors and employees and their relatives may; (a) from time to time, have a long or short position in, act as principal in, and buy or sell the securities or derivatives thereof of companies mentioned herein. (b) be engaged in any other transaction involving such securities and earn brokerage or other compensation or act as a market maker in the financial instruments of the company(ies) discussed herein or act as an advisor or lender/borrower to such company(ies) or may have any other potential conflict of interests with respect to any recommendation and other related information and opinions.; however the same shall have no bearing whatsoever on the specific recommendations made by the analyst(s), as the recommendations made by the analyst(s) are completely independent of the views of the affiliates of MOSt even though there might exist an inherent conflict of interest in some of the stocks mentioned in the research report Reports based on technical and derivative analysis center on studying charts company's price movement, outstanding positions and trading volume, as opposed to focusing on a company's fundamentals and, as such, may not match with a report on a company's fundamental analysis. In addition MOST has different business segments / Divisions with independent research separated by Chinese walls catering to different set of customers having various objectives, risk profiles, investment horizon, etc, and therefore may at times have different contrary views on stocks sectors and markets. Unauthorized disclosure, use, dissemination or copying (either whole or partial) of this information, is prohibited. The person accessing this information specifically agrees to exempt MOSt or any of its affiliates or employees from, any and all responsibility/liability arising from such misuse and agrees not to hold MOSt or any of its affiliates or employees responsible for any such misuse and further agrees to hold MOSt or any of its affiliates or employees free and harmless from all losses, costs, damages, expenses that may be suffered by the person accessing this information due to any errors and delays. The information contained herein is based on publicly available data or other sources believed to be reliable. Any statements contained in this report attributed to a third party represent MOSt’s interpretation of the data, information and/or opinions provided by that third party either publicly or through a subscription service, and such use and interpretation have not been reviewed by the third party. This Report is not intended to be a complete statement or summary of the securities, markets or developments referred to in the document. While we would endeavor to update the information herein on reasonable basis, MOSt and/or its affiliates are under no obligation to update the information. Also there may be regulatory, compliance, or other reasons that may prevent MOSt and/or its affiliates from doing so. MOSt or any of its affiliates or employees shall not be in any way responsible and liable for any loss or damage that may arise to any person from any inadvertent error in the information contained in this report. MOSt or any of its affiliates or employees do not provide, at any time, any express or implied warranty of any kind, regarding any matter pertaining to this report, including without limitation the implied warranties of merchantability, fitness for a particular purpose, and non-infringement. The recipients of this report should rely on their own investigations. This report is intended for distribution to institutional investors. Recipients who are not institutional investors should seek advice of their independent financial advisor prior to taking any investment decision based on this report or for any necessary explanation of its contents. Most and it’s associates may have managed or co-managed public offering of securities, may have received compensation for investment banking or merchant banking or brokerage services, may have received any compensation for products or services other than investment banking or merchant banking or brokerage services from the subject company in the past 12 months. Most and it’s associates have not received any compensation or other benefits from the subject company or third party in connection with the research report. Subject Company may have been a client of Most or its associates during twelve months preceding the date of distribution of the research report MOSt and/or its affiliates and/or employees may have interests/positions, financial or otherwise of over 1 % at the end of the month immediately preceding the date of publication of the research in the securities mentioned in this report. To enhance transparency, MOSt has incorporated a Disclosure of Interest Statement in this document. This should, however, not be treated as endorsement of the views expressed in the report. Motilal Oswal Securities Limited is under the process of seeking registration under SEBI (Research Analyst) Regulations, 2014. There are no material disciplinary action that been taken by any regulatory authority impacting equity research analysis activities Analyst Certification The views expressed in this research report accurately reflect the personal views of the analyst(s) about the subject securities or issues, and no part of the compensation of the research analyst(s) was, is, or will be directly or indirectly related to the specific recommendations and views expressed by research analyst(s) in this report. The research analysts, strategists, or research associates principally responsible for preparation of MOSt research receive compensation based upon various factors, including quality of research, investor client feedback, stock picking, competitive factors and firm revenues Disclosure of Interest Statement Analyst ownership of the stock Served as an officer, director or employee TORRENT PHARMACEUTICALS LTD No No Regional Disclosures (outside India) This report is not directed or intended for distribution to or use by any person or entity resident in a state, country or any jurisdiction, where such distribution, publication, availability or use would be contrary to law, regulation or which would subject MOSt & its group companies to registration or licensing requirements within such jurisdictions. For U.S. Motilal Oswal Securities Limited (MOSL) is not a registered broker - dealer under the U.S. Securities Exchange Act of 1934, as amended (the"1934 act") and under applicable state laws in the United States. In addition MOSL is not a registered investment adviser under the U.S. Investment Advisers Act of 1940, as amended (the "Advisers Act" and together with the 1934 Act, the "Acts), and under applicable state laws in the United States. Accordingly, in the absence of specific exemption under the Acts, any brokerage and investment services provided by MOSL, including the products and services described herein are not available to or intended for U.S. persons. This report is intended for distribution only to "Major Institutional Investors" as defined by Rule 15a-6(b)(4) of the Exchange Act and interpretations thereof by SEC (henceforth referred to as "major institutional investors"). This document must not be acted on or relied on by persons who are not major institutional investors. Any investment or investment activity to which this document relates is only available to major institutional investors and will be engaged in only with major institutional investors. In reliance on the exemption from registration provided by Rule 15a-6 of the U.S. Securities Exchange Act of 1934, as amended (the "Exchange Act") and interpretations thereof by the U.S. Securities and Exchange Commission ("SEC") in order to conduct business with Institutional Investors based in the U.S., MOSL has entered into a chaperoning agreement with a U.S. registered broker-dealer, Motilal Oswal Securities International Private Limited. ("MOSIPL"). Any business interaction pursuant to this report will have to be executed within the provisions of this chaperoning agreement. The Research Analysts contributing to the report may not be registered /qualified as research analyst with FINRA. Such research analyst may not be associated persons of the U.S. registered broker-dealer, MOSIPL, and therefore, may not be subject to NASD rule 2711 and NYSE Rule 472 restrictions on communication with a subject company, public appearances and trading securities held by a research analyst account. For Singapore Motilal Oswal Capital Markets Singapore Pte Limited is acting as an exempt financial advisor under section 23(1)(f) of the Financial Advisers Act(FAA) read with regulation 17(1)(d) of the Financial Advisors Regulations and is a subsidiary of Motilal Oswal Securities Limited in India. This research is distributed in Singapore by Motilal Oswal Capital Markets Singapore Pte Limited and it is only directed in Singapore to accredited investors, as defined in the Financial Advisers Regulations and the Securities and Futures Act (Chapter 289), as amended from time to time. In respect of any matter arising from or in connection with the research you could contact the following representatives of Motilal Oswal Capital Markets Singapore Pte Limited: Anosh Koppikar Kadambari Balachandran Email : [email protected] Email : [email protected] Contact : (+65)68189232 Contact : (+65) 68189233 / 65249115 Office Address : 21 (Suite 31),16 Collyer Quay,Singapore 04931 29 January 2015 Motilal Oswal Securities Ltd Motilal Oswal Tower, Level 9, Sayani Road, Prabhadevi, Mumbai 400 025 Phone: +91 22 3982 5500 E-mail: [email protected] 16


© Copyright 2026