
Download Full Text - Harvard University
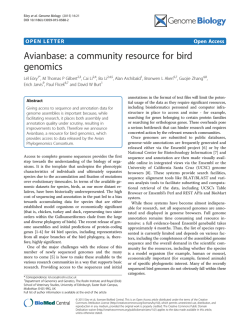
Gateways to the FANTOM5 promoter level mammalian
expression atlas
The Harvard community has made this article openly available.
Please share how this access benefits you. Your story matters.
Citation
Lizio, M., J. Harshbarger, H. Shimoji, J. Severin, T. Kasukawa,
S. Sahin, I. Abugessaisa, et al. 2015. “Gateways to the
FANTOM5 promoter level mammalian expression atlas.”
Genome Biology 16 (1): 22. doi:10.1186/s13059-014-0560-6.
http://dx.doi.org/10.1186/s13059-014-0560-6.
Published Version
doi:10.1186/s13059-014-0560-6
Accessed
February 6, 2015 11:04:12 AM EST
Citable Link
http://nrs.harvard.edu/urn-3:HUL.InstRepos:13890635
Terms of Use
This article was downloaded from Harvard University's DASH
repository, and is made available under the terms and conditions
applicable to Other Posted Material, as set forth at
http://nrs.harvard.edu/urn-3:HUL.InstRepos:dash.current.termsof-use#LAA
(Article begins on next page)
Lizio et al. Genome Biology (2015) 16:22
DOI 10.1186/s13059-014-0560-6
SOFTWARE
Open Access
Gateways to the FANTOM5 promoter level
mammalian expression atlas
Marina Lizio1,2, Jayson Harshbarger1,2, Hisashi Shimoji1,2, Jessica Severin1,2, Takeya Kasukawa2, Serkan Sahin1,2,
Imad Abugessaisa2, Shiro Fukuda1, Fumi Hori1,2, Sachi Ishikawa-Kato1,2, Christopher J Mungall5, Erik Arner1,2,
J Kenneth Baillie7, Nicolas Bertin1,2,19, Hidemasa Bono10, Michiel de Hoon1,2, Alexander D Diehl13,
Emmanuel Dimont12, Tom C Freeman7, Kaori Fujieda10, Winston Hide12,17, Rajaram Kaliyaperumal8,
Toshiaki Katayama15, Timo Lassmann1,2,18, Terrence F Meehan6, Koro Nishikata16, Hiromasa Ono10, Michael Rehli9,
Albin Sandelin11, Erik A Schultes8,14, Peter AC ‘t Hoen8, Zuotian Tatum8, Mark Thompson8, Tetsuro Toyoda16,
Derek W Wright7, Carsten O Daub1, Masayoshi Itoh1,2,3, Piero Carninci1,2, Yoshihide Hayashizaki1,3,
Alistair RR Forrest1,2*, Hideya Kawaji1,2,3,4* and the FANTOM consortium
Abstract
The FANTOM5 project investigates transcription initiation activities in more than 1,000 human and mouse primary
cells, cell lines and tissues using CAGE. Based on manual curation of sample information and development of an
ontology for sample classification, we assemble the resulting data into a centralized data resource (http://fantom.
gsc.riken.jp/5/). This resource contains web-based tools and data-access points for the research community to
search and extract data related to samples, genes, promoter activities, transcription factors and enhancers across
the FANTOM5 atlas.
Introduction
One of the most comprehensive ways to study the molecular basis of cellular function is to quantify the presence of RNA molecules expressed by a given cell type.
Over the years, the genomics field has collectively built
up several gene expression repositories across biological
states to facilitate exploration of biological systems. As
for genome-wide surveys of encoded RNAs, a number of
partial and full-length cDNA clone collections have been
constructed and sequenced previously [1-6]. The resulting data were used for genome annotation, in particular
to build gene models (NCBI RefSeq [4], Ensembl transcripts [7], Representative Transcript and Protein Sets
(RTPS) [8]), and for exploration of active genes within
specific biological contexts (NCBI UniGene [4], DigiNorthern [9], and cross-species analysis based on simplified
* Correspondence: [email protected]; [email protected]
1
Omics Science Center, RIKEN Yokohama Institute, 1-7-22 Suehiro-cho,
Tsurumi-ku, Yokohama, Kanagawa 230-0045, Japan
2
Division of Genomic Technologies (DGT), RIKEN Center for Life Science
Technologie, 1-7-22 Suehiro-cho, Tsurumi-ku, Yokohama, Kanagawa 230-0045,
Japan
Full list of author information is available at the end of the article
ontologies [10]). However, the ability of these surveys to
quantify RNA abundance was limited mainly due to sequencing performance. Another approach to assess gene
expression is by hybridization to pre-designed probes (that
is, microarrays) [11-13]. Thousands of studies have been
published on gene expression profiles using microarrays
(Gene Expression Omnibus [14], ArrayExpress [15],
CIBEX [16]) and collections of curated data sets (GNF
SymAtlas2 [17], EBI Gene expression atlas [18], BioGPS
[19]) have become popular tools to survey gene expression
levels. However, the coverage of identifiable RNA molecules and the accuracy of quantification are limited due to
their probe design, which relies on existing knowledge of
RNA species.
The recent development of next-generation sequencers
enables us to obtain genome-wide RNA profiles comprehensively, quantitatively and without any pre-determination
of what should be expressed using methods like cap analysis of gene expression (CAGE) [20] and RNA-seq [21].
In particular, a variation of the CAGE protocol using a single molecule sequencer [22] allows us to quantify transcription start site (TSS) activities at single base pair
resolution from as little as approximately 100 ng of total
© 2015 Lizio et al.; licensee BioMed Central. This is an Open Access article distributed under the terms of the Creative
Commons Attribution License (http://creativecommons.org/licenses/by/4.0), which permits unrestricted use, distribution, and
reproduction in any medium, provided the original work is properly credited. The Creative Commons Public Domain
Dedication waiver (http://creativecommons.org/publicdomain/zero/1.0/) applies to the data made available in this article,
unless otherwise stated.
Lizio et al. Genome Biology (2015) 16:22
RNA. We used this technology to capture transcription
regulation across diverse biological states of mammalian
cells in the Functional Annotation of Mammalian Genomes 5 (FANTOM5) project [23]. The collection consists
of more than 1,000 human and mouse samples, most of
which are derived from primary cells. This is a unique data
set to understand regulated transcription in mammalian
cell types. The broad coverage of biological states allows
researchers to find samples of interest and inspect active
genes or transcription factors in their biological contexts.
The comprehensive profiling across the sample collection
provides the opportunity to look up any gene, transcription factor or non-coding RNA of interest and to examine
in which context they are activated across mammalian cellular states. CAGE-based TSS profiles at single base resolution allow the correlation of transcription activity with
sequence motifs or epigenetic features. In previous studies,
we generated TSS profiles based on CAGE in FANTOM3
[24,25] and FANTOM4 [26,27], but the diversity of biological states and the quantification capabilities were quite
limited due to the state of the technologies at that point.
To facilitate FANTOM5 data exploration from various
perspectives, we prepared a set of computational resources, including a curated data archive and several
database systems, so that researchers can easily explore,
examine, and extract data. Here, we introduce the online resources with underlying data structure and describe their potential use in multiple research fields.
This work is part of the FANTOM5 project. Data downloads, genomic tools and co-published manuscripts are
summarized at [28].
Results and discussions
Annotation of the sample collection
In FANTOM5 [23], more than 1,000 human and mouse
samples were profiled by CAGE. These include primary
cells, cell lines, and tissues consisting of multiple cell
types. To facilitate examination of the diverse and large
number of samples by both wet-bench and computational
biologists, we describe the samples from two complementary perspectives: (i) manual collection and curation of
sample attributes and (ii) systematic classification using
existing ontologies. Manual curation was accomplished via
a standardized sample and file naming procedure based
on a compiled set of sample attributes (such as age, sex,
tissue, and cell type; details in Additional files 1, 2, and 3).
Names are formed by concatenating the curated sample
names (for example, 'Smooth Muscle Cells - Aortic,
donor0'), RNA ID (for example, '11210-116A4') and
CAGE library ID (for example, 'CNhs10838'), where the
latter two enable us to track the samples in the form of
RNA extracts and loaded sequencing materials (Additional
file 4). Replicates are further identified with suffix notation
(such as tech_rep#, biol_rep#, donor#, pool#) to the
Page 2 of 14
sample names. The resulting sample and file names are
structured so that related samples (like developmental
stages) will be grouped together in order when sorted alphabetically. We faced the challenge that the file names
needed to be both informative for researchers and valid for
computational systems that impose restrictions on the set
of allowed characters in file names and file access paths. A
full description of samples often requires a variety of symbols (for example, single quote in 'Hodgkin's lymphoma',
slash, caret, parentheses in 'cell line:143B/TK^(−)neo^(R)'),
and some computer systems have problems handling file
names including these symbols. One option is to use short
labels as in the case of genes, where unique short labels
for human genes (called gene symbols) are determined
through community discussions under coordination by the
Human Genome Nomenclature Committee [29]. But we
chose not to do this, as this introduces an extra layer of
complexity in data handling and coordination, and an additional cognitive burden on human users. Instead, we decided to encode the sample names in 'URL encode'
scheme (RFC3986) for file names, so that we can systematically generate them and decrease the risk of data tracing
errors. This has the added advantage that URL path accessors to the files are consistent with those of the file system.
To classify samples systematically, we assembled the
FANTOM Five (FF) Sample Ontology [23] consisting of
the existing basic ontologies: cell types (CL), anatomical
systems (UBERON), and diseases (DOID) [30-32]. We
used the RNA ID as a unique identifier term (see
Additional file 4 and below) of the individual samples
and to link the corresponding FF ontology terms in a
parent-child relationship. This scheme provides a way
for researchers to query a group of samples based on
existing knowledge and to aggregate related information
systematically. In addition, we mapped graphical images
in the BodyParts3D resource [33] to the UBERON terms
composing the FF ontology, via the Foundational Model
of Anatomy ontology [34]. This enables us to provide
graphical shapes of individual organs in our databases.
Overview of the data collected from the FANTOM5 samples
The FANTOM5 analysis pipeline is shown in Figure 1,
and resulting data types are summarized in Table 1. Cell
or tissue RNA extracts were collected either from the
FANTOM5 collaborators directly or purchased from
companies. Each sample was assigned a unique RNA ID,
annotated as described above, and CAGE libraries were
constructed using either an automated system [35] or,
for lower quantity RNA samples, a manual protocol
[22]. Libraries were sequenced and analyzed (see Materials and methods) to generate TSS profiles for each
sample and CAGE peaks were annotated with normalized expression level tags per million where library sizes
were adjusted by relative log expression [36,37]. Further
Lizio et al. Genome Biology (2015) 16:22
Sample collection
RNA extraction
(RNA ID)
CAGE library
production
(CAGE library ID)
Sequencing,
post-processing
Cell lines
CAGE assay and basic processing
Primary cells
Page 3 of 14
Tissues
FF sample
ontology
sample info
co-expression module
TSS info
motif
Co-expression
clusters
FF sample
enrichment
GO, pathway,
TFBS enrichemnt
OBO
FF sample
enrichment
Sample attributes
motif analysis
Activities of the
TSS regions
TSS region
annotation
TSS region
BED
Data archive
"/extra" directory
Meta data
Read alignment
Sequences
BAM
BED
(score represents read counts)
Data archive
"/basic" directory
Figure 1 FANTOM5 assay flow and the data archive. Sample collection and data processing are indicated in a schematic view (green boxes).
The resulting data and the analysis are collected into corresponding directories in the data archive (orange). GO, gene ontology.
analyses resulted in quality assessment and promoter annotation, including gene association, gene ontology function, co-expression analysis and motif analysis. We also
associate individual CAGE peaks with biological states
where they are actively transcribed (see below), which
was enabled by the systematic classification provided
within FF Sample Ontology. We compiled these results as
a consistent data set in a central data archive. The results
of the standard processing pipeline are kept in a directory
named ‘basic’, where all of the materials, data, and
Table 1 Data files available in the data archive
Data or analysis type
Data format
Path
Sample, RNA, and CAGE library information (metadata)
SDRF
/basic/*sdrf.txt
Ribosomal RNA hitting reads
FASTA
/basic/*CAGE/*nobarcode.rdna.fa.gz (1,385 files)
/basic/*CAGE/00_*assay_sdrf.txt
Mapping results (including unmapped reads)
BAM
/basic/*CAGE/*nobarcode.bam (1,385 files)
TSS profiles (counts of obtained 5'-end reads at 1 bp resolution)
BED
/basic/*CAGE/*ctss.bed.gz (1,385 files)
Sample classification based on the FANTOM Five Sample Ontology
OBO
/extra/Ontology/ff-phase1-*.obo
CAGE peaks (TSS clusters)
BED
/extra/CAGE_peaks/*.bed.gz
CAGE peak annotation (descriptions and gene association)
OSC
/extra/CAGE_peaks/*.ann.txt.gz
Expression of the CAGE peaks
OSC
/extra/CAGE_peaks/*.osc.txt.gz
Co-expression clustering
OSC
/extra/Co-expression_clusters/*_co-expression_modules.tar.gz
De novo motif analysis
TXT
/extra/Motifs/novel_pwms.txt
Sample enrichment analysis
TXT
/extra/Sample_ontology_enrichment_of_CAGE_peaks /*.txt.gz
Gene ontology enrichment analysis of co-expression clusters
OSC
/extra/Co-expression_clusters/*co-expression_GOstats.tar.gz
Lizio et al. Genome Biology (2015) 16:22
Page 4 of 14
protocols are described in MAGE/ISA-tab [38,39]. The
subsequent analysis results, such as the identified TSS regions, their quantified expressions, co-expression clustering, ontology enrichment and DNA motif analysis, are
kept in a directory named ‘extra’.
Interfaces to the series of FANTOM5 results
To provide these diverse data sets in a useful format for
multiple purposes we created a series of database systems
(Figure 2) that are complementary to each other in terms
of hosted data or context. Researchers may be primarily
interested in accessing data in two ways: (i) in-depth inspection of the computational characterization (analysis
results) delineating cellular states, transcription initiation
events and their regulation; and (ii) dynamic exploration
of individual profiles (original data) on-demand. For indepth inspection we made the comprehensive information
accessible using existing and widely utilized software interfaces. For example, FANTOM5 tracks on the UCSC Genome Browser via track hub [40] allow users to inspect the
FANTOM5 TSS regions together with epigenetic marks
profiled by the ENCODE project [41] and Roadmap
Epigenomics [42]. Our BioMart [43] instance makes it
Dynamic
exploration
ZENBU
Inspection of precalculated results
UCSC
Data types
possible to export the annotation of CAGE peaks with a
simple and stepwise interface. The Table Extraction Tool
(TET) provides a simple way to obtain a relevant subset of
expression intensities for individual CAGE peaks. The
resulting expression tables downloaded from TET are
formatted in a general expression matrix where rows represent CAGE peaks and columns individual samples, enabling users to immediately start their expression analysis
without re-formatting. Additionally we created a semantic
catalog of samples, transcription initiation and regulators
(SSTAR); Abugessaisa et al., in preparation, a database
system using the Semantic MediaWiki framework [44] to
host the heterogeneous analysis results in a transparent
way. Using SSTAR, researchers can access the FANTOM5
analysis results in a similar manner to Wikipedia [45] with
a customized visualization and data export. From BioGPS
[19], a gene annotation portal to study gene function,
SSTAR entries for genes can be shown via its FANTOM5
SSTAR plugin. Further, we modeled the annotations and
activities of CAGE peaks in the Resource Description
Framework (RDF), published in a nanopublication format
[46,47], and provided a set of SPARQL endpoints so that
each of the peaks can be queried and cited by using
nanopub
BioMart
TSS region
TET
sample info
Figure 2 Interfaces to FANTOM analyses. Scope and contents of the database systems.
BioLayout Express 3D
SSTAR
co-expression module
motif
Lizio et al. Genome Biology (2015) 16:22
Semantic Web technologies. A portion of the data stored
in SSTAR is also loaded in RIKENBASE [48] to be associated with other RIKEN databases.
For interactive and dynamic data exploration, optimized
for individual data types, we configured the ZENBU genome browser and analysis system [49], which stores and
displays all CAGE experiments, including the genome
alignments of individual CAGE reads as well as the annotation of each sample. It enables users to explore TSS activities in any region of the genome, with a user-selectable
alignment threshold between the CAGE reads and the
genome. The Enhancer Selector tool (Li et al., under preparation) stores the summarized activity profiles of the enhancers identified by CAGE [50] based on curated tissue
categories and enables users to select a group of enhancers
activated in specified conditions through its intuitive
'slider' interface. BioLayout Express3D [51] presents the results of co-expression clustering as a three-dimensional
visualization of expression space with an interactive user
interface.
Data exploration: use cases
All of the individual interfaces have their own scope and
advantages and are linked to each other to allow easy
Page 5 of 14
access to relevant information. An example analysis flow
using multiple tools is shown in Additional file 5, while
a variety of explorations are possible for biological questions and hypotheses. Below, we provide examples to access FANTOM5 data via the specific interfaces.
Starting with sample details
Data exploration often starts from searching for samples
of interest and examining details of the individual cellular states. SSTAR provides a collection of pages representing the complete sets of FANTOM5 samples, CAGE
peaks, transcription factors and ontologies. It also contains
analysis results such as expression and co-expression of
peaks, enrichment scores, and motifs. SSTAR provides
lists of samples profiled in FANTOM5 as individual sample pages (Figure 3) that store basic details such as donor
age, sex, and RNA quality metrics as well as analysis results about transcription regulation, including relative expression levels of transcription factors and DNA binding
motifs relevant in the sample. For example, a page corresponding to 'CD14+ Monocytes, donor 1' [52] shows essential transcription factors for monocytes sorted by
relative abundance. SPI1, encoding the hematopoietic
master transcription factor PU.1, for example, is ranked
Sample details and regulatory information
Sample list
Tissue/cell type list
Expression-based
sample clustering
Figure 3 Access to the sample details. Detailed information of a sample, including regulatory information produced by computational analysis
of its transcriptome, is summarized in a page (dotted box on the left). This page can be found by examining pages of listed samples or tissue cell
types, or by looking at (dis)similarities of samples in a transcriptome space defined by expression clustering (right boxes).
Lizio et al. Genome Biology (2015) 16:22
second (p1@SPI1). Its DNA binding motif, listed in the
motifs section, is discovered by de novo motif analysis
(PB0058.1_Sfpi1_1, Additional file 6).
Checking a group of samples based on manually curated
classifications
SSTAR provides lists of the sample ontology terms (cell
type, tissue, and disease ontologies) with hyperlinks to individual ontology term pages. Within each of these pages,
detailed information on the term itself, such as crossreferences and name spaces, are shown, and samples
associated with the term based on FF Sample Ontology
classification are listed (Figure 3; Additional file 7). The
ontology term page also shows parent-children relationships via a graphical and interactive user interface by using
the NCBO widget [53]. For example, a page describing the
cell type 'monocyte' shows that it develops from promonocyte and into macrophage (Additional file 7). Furthermore,
it shows the CAGE peaks highly active in the monocyterelated samples based on FF Sample Ontology Enrichment
Analysis (Additional file 8).
Overviewing sample proximity and distance across
transcriptome space
BioLayout Express3D [51] is a powerful network analysis
tool that provides an interactive way to explore similarity
relationships between samples and transcription initiation
activities (that is, CAGE peak expressions). The user can
inspect a network in which nodes represent either samples
or CAGE peaks where node colors are based on the coexpression cluster they belong to, and edges represent correlations between them above the user-defined threshold.
The network displayed in a three-dimensional environment can be rotated, zoomed and explored interactively.
Graphical representation of the FANTOM5 data allows
the user to examine promoter expression patterns across
nearly 1,000 samples included in this study or subsets
thereof. A number of pre-calculated graph views (layout
files) are available at our web resource. For example, a network shown in Additional file 9 enables us to examine
sample-sample (dis)similarities, and one in Additional file
10 to examine relationships between CAGE peaks where
their expression patterns can be displayed in a pop-up
window. A web search function for nodes (samples or
CAGE peaks) is set up to query the SSTAR or ZENBU databases for matches. For further in-depth examination,
users can activate the clustering option based on the
Markov Cluster Algorithm (MCL) [54] and adjust the parameters in order to obtain co-expression classes, or clusters, of samples sharing similar patterns in expression.
Inspecting genes, transcription factors and DNA motifs
A simple keyword search of a gene in SSTAR (Additional
file 11) allows us to find a gene page showing its associated
Page 6 of 14
CAGE peaks and its activity levels across all the samples,
as well as basic gene information from EntrezGene [4].
For example, SPI1 is associated with seven TSS regions
whose expression profiles are summarized in a page as in
Additional file 12. The hyperlinked 'TSS region' page
shows further details, such as FF sample ontology enrichment analysis and the co-expression cluster it belongs to,
as well as its activity profiles across samples (Figure 4).
For genes encoding a known transcription factor, the
gene page also includes its corresponding consensus
recognition sequence ('DNA motif') if known. It shows
the samples where transcription is significantly correlated with the motif occurrence (see Materials and
methods) as well as its nucleotide pattern by sequence
logo (Additional file 12).
Putting data in the genomic axis
ZENBU [49] provides an interactive interface to explore
transcription initiation activities in their genomic context
and it helps to examine transcription activity in-depth, independent of the CAGE peaks defined in FANTOM5
[23]. It also allows for selection of CAGE profiles to be
displayed using the Data Explorer search tab (Additional
file 13). A single ‘pooled’ track aggregating multiple CAGE
samples allows a user to examine the expression profile in
each of the CAGE profiles immediately by selection of any
genomic regions. For example, selection of the SPI1
promoter region in a pre-configured pooled track of all
the FANTOM5 CAGE profiles displays accumulated
transcription activities. From there one can apply a filter on sample names and sort by expression levels
(Additional file 14). Several configurations prepared for
the FANTOM5 data set are accessible from the ZENBU
resource page. Similarly, we prepared a set of configured
data files for the data hub in the UCSC Genome Browser
[40], which allow users to overlay the FANTOM5 CAGE
peaks and TSS profiles with the views and annotations
maintained by the database management team and the
community. For example, one can examine the CAGE
peaks associated with SPI1 and compare them with the
ENCODE regulation tracks and segmentation tracks
(Additional file 15).
Exporting selected data
Besides individual inspection of compiled results, further
computational analyses with custom parameters and/or
tools are sometimes required to build a working hypothesis and select candidates for experiments. Researchers
can use several interfaces to obtain desired data rather
than downloading and parsing large data files from the
entire data archive. ZENBU and the UCSC Genome
Browser both have export functions as a part of their
user interface. In particular, ZENBU’s unique interface
enables us to export expression profiles of arbitrary
Lizio et al. Genome Biology (2015) 16:22
Page 7 of 14
Figure 4 Inspection of a transcription factor and its activity. Detailed information on the most active CAGE peak at the SPI1 promoter is
summarized in one page (dotted box, bottom left). This page can be found by examining the SPI1 gene on ZENBU (top left panel) or SSTAR (top
right panel).
regions, which is useful for in-depth examination of
non-annotated genomic regions. Similarly, portions of
the data can be extracted using the BioMart [43] instance and TET tool. The former provides a way to
select and obtain CAGE peak annotations, such as associated genes and promoter features, via a widely used
interface (Additional file 16). TET lets users obtain a
subset of data by specifying the desired columns and
rows. In the FANTOM5 context, TET enables users to
specify CAGE peaks and samples to be included. The
resulting data matrix is immediately usable for expression analysis across CAGE peaks and biological samples
(Additional file 17).
Connecting to linked data
In addition to data export in tab-delimited files, we also
modeled the FANTOM5 data as nanopublications (the
smallest unit of publishable information) [46,55]. Nanopublications expose individual records allowing automatic integration with any other linked data [56,57] and
for citation tracking of their impact [58]. Each of the
nanopublications is composed of three elements based
on RDF (Additional file 18): an assertion (data or scientific statement), provenance for the assertion (how the
assertion came to be), and publication information (how
the nanopublication came to be). We have exposed
three types of nanopublications from FANTOM5 data:
CAGE peaks (type I nanopublications; see Materials and
methods); their associated genes (type II); and their expression information (type III). By applying standard
SPARQL [59] queries to the FANTOM5 nanopublications (available at [47]), specific results can be retrieved
semantically. For example, Additional file 19 shows a
SPARQL query to retrieve the samples related to skeletal muscle and activities of the TSSs for MYOD, a master regulator of myogenesis, in those samples. Although
this is a simple biological question, automatic retrieval
of its result is challenging due to ambiguities in several
layers. For example, there are ambiguities in concept
identification (MYOD1, not MYOD, is the official symbol
Lizio et al. Genome Biology (2015) 16:22
in HUGO nomenclature), multiple CAGE peaks can be
associated with the gene (actually four CAGE peaks are
associated with MYOD1), and many different FANTOM5
samples, including cell lines and primary cells, are related
to skeletal muscle but not all samples contain the keyword
'muscle' in the sample description (for example, myoblast).
Despite these semantic complications, the query in
Additional file 19 retrieves expected data (Additional file
20) by resolving these ambiguities with semantic integration of Linked Life Data [60], retrieved 16 April 2014) and
the FANTOM5 nanopublications. We foresee that the
nanopublications and associated SPARQL endpoints facilitate the automated integration with many other biomedical datasets.
Continual evolution of resources to treat diverse sets of
data
Based on our experience preparing the series of interfaces, here we discuss the challenges we faced in their
preparation and the approaches we took, as a lesson for
other future projects. At the initial stage of FANTOM5,
we had a clear vision of the data set to be generated and
analyses to be tackled, but we did not have a complete
picture of the results, research questions and directions.
The types of raw and processed data were clear, but it
was difficult to determine the number of data files and
data types, and to predict their complexities through the
entire project.
Given the challenge of working with large amounts of
data under such uncertainty, we started to prepare interfaces from a minimum set of visible tools requiring
less data modeling assumptions ('data agnostic' tools).
MediaWiki is designed for Wikipedia, a web-based, collaborative and flexible form of encyclopedia to collect a
comprehensive summary from any branch of knowledge. Individual pages can contain any sort of description, and immediate data visibility on a page provides a
means for data providers and generators to visually
check, confirm or correct details, where Semantic
MediaWiki extension helped us to retrieve relevant information even if stored in different pages. Genome
browsers require data to have genomic coordinates, and
the use of genome browsers for inspection of data (in
the context of other data in the same genomic region)
is obviously important for the genomics field. Loading
all the CAGE profiles into ZENBU helped us to validate
the processing of samples by checking the expression of
marker genes. After starting with these two interfaces,
we gradually added other interfaces to complement uncovered parts. We included BioMart, BioGPS plugin,
and UCSC DataHub to disseminate our results across
these user communities, and introduced the enhancer
selector, BioLayout and TET to facilitate further analysis
and inspection of our resources. This might serve as a
Page 8 of 14
practical approach in treating data for exploratory research, and a guide for developers to design tools and
their functions.
Conclusions
In FANTOM5, the FANTOM Consortium has profiled
TSS level transcription activities in a diverse range of
samples. We assembled the data and analysis results into
an on-line resource containing a comprehensive expression atlas for exploration from multiple perspectives.
The expression atlas covers the largest number of samples (nearly 1,000 human and 400 mouse samples) based
on HeliScopeCAGE [22]. An existing expression resource, BioGPS [19], and one of the most popular databases for microarray-based gene expression atlases,
provides around 200 samples at its most recent version.
CellMontage, a system for searching gene expression databases based on profile similarity, exhaustively collected
hundreds of thousands of human microarray gene expression profiles from different public repositories, providing a tool to retrieve data sets from different studies
and laboratories [61]. Our resource uniquely consists of
the largest number of samples on a single platform. In
terms of TSS profiles, the FANTOM5 collection is the
largest (ENCODE profiled 36 cell lines by CAGE [41],
while the DataBase of Transcriptional Start Sites (DBTSS)
[62] has TSS profiles from 20 tissues and 7 cell lines). The
FANTOM5 atlas expands the existing resources in terms
of coverage and diversity of samples that were profiled.
Moreover, considering the nature of HeliScopeCAGE data,
absolute measurement of capped RNA abundance by
using a single molecule sequencer can achieve higher
quantification ability [63] compared with the previous
CAGE technology employing two steps of PCR [64]. Thus,
the FANTOM5 atlas could contribute to the research
community by providing high quality data.
The resource provides extensive annotation about
transcription initiation as well as cellular transcription
states, which is far beyond merely assembling profiles.
We strategically defined TSS regions in a data-driven
manner and annotated them by performing a series of
computational analyses. Such analyses enriched the
characterization of experimentally defined regions, although they also increased data types. We prepared a
series of database systems to host heterogeneous data to
make it possible for researchers to explore the data from
multiple perspectives. The tools or database systems
shown in Figure 2 provide multiple means to play with
data interactively, export only a subset of the entire data,
and integrate with other data beyond FANTOM5. In the
on-going activities of the second phase of FANTOM5, we
are now working on time-dependent dynamics and their
regulation. We expect additional data types and are going
to expand the collection to cover additional analysis.
Lizio et al. Genome Biology (2015) 16:22
Materials and methods
A standardized description of samples and experimental
conditions
A wide range of RNA samples with different origin and
with replicates was produced for FANTOM5. To describe, in a consistent manner, the entire set of samples,
experiments, and protocols, we employed the MAGE/
ISA-tab file format [38,39], a standard format to describe
experimental details. The experimental steps described
in the file can be visualized with SDRF2GRAPH [65], a
tool developed during the FANTOM4 project [26]
(available as a web tool at [66]), providing an intuitive
representation of the complex experimental steps. These
meta-data files help to document the data structure of
the FANTOM5 project and support its use and biological interpretation.
Standardized data collection, quality control and
automated data processing
For each FANTOM5 sample, cDNAs resulting from
CAGE library preparation were loaded onto HeliScope
flow cells. Each sequencing result was then systematically processed, discarding sequences that are too short or
that represent artifacts [67], aligning the obtained reads to
the reference genome sequences [68], and counting CAGE
read alignments based on their 5’ end (termed CAGE tag
start site (CTSS) [25]) with required mapping quality ≥20
and sequence identity ≥85%. Mapping files were first filtered to discard bad alignments and then indexed by using
SAMtools utilities [69] to allow both extraction of specific
mapping locations and access the BAM files remotely.
The mapping files were then converted into CTSS BED
files using a combination of BedTools [70] and shell commands to reduce the data. They were then systematically
named using a combination of sample names and unique
identifiers (Additional file 4). This yields a quantification
of transcription initiation activity in each sample at single
base pair resolution.
Based on the TSS profiling data above, we determined
TSS regions by calling peaks over the CAGE signals
(Additional file 21) [23]. We refer to them as 'CAGE
peaks' to avoid confusion with co-expression clustering
below. We assigned peak names based on the closest
gene (located within 500 bp upstream of the 5’ end of
the gene model, or alternatively on its first exon up to
500 bp downstream), and ranked them based on the
CTSS counts when multiple CAGE peaks were associated with the same gene. For example, p1@B4GALT1
(CAGE peak 1 at the B4GALT1 5’ end) indicates a peak
near the B4GALT1 gene which is the most highly
expressed among those associated with the same gene.
Further, we examined the association of CAGE peaks with
gene structure and repetitive elements based on a curation
rule (see below). We also examined the similarity of their
Page 9 of 14
neighboring genomic sequences to conventional TSSs by a
machine learning approach to distinguish TSS-like sequences from others [23]. We quantified activities of the
identified TSS regions based on the counts of CAGE read
alignments as tags per million after adjusting the library
size by the relative log expression method [36,37].
Based on the TSS regions and their expression levels,
we performed co-expression analysis by applying the
MCL [23,71] followed by pathway enrichment analysis
(Figure 1). Gene ontology enrichment analysis [72] allowed us to annotate individual co-expression clusters in
terms of gene function, while the sample ontology let us
annotate the biological context in which a CAGE peak
or a co-expression cluster is activated in an analogous
way to gene set enrichment analysis [73]. In parallel, we
examined the presence of DNA motifs, which are regulatory elements encoded in the genome. We examined
over-representation of known DNA motifs (obtained
from Jaspar [74]) in each of the co-expression clusters,
and correlation between their presence and expression
(see Materials and methods). Furthermore, we explored
novel DNA motifs by evaluating their correlation with
CAGE expression patterns [23].
Significance assessment of DNA motifs
We predicted putative transcription factor binding sites
(TFBSs) using a position-weight matrix model as implemented in Biopython [75] for each JASPAR [74] motif
and for each novel motif, with a background probability
based on a 40.9% GC content. The position-weight
matrix scores were converted to Bayesian posterior
probabilities using a prior probability of 5 × 10⁻⁴. We
retained all predicted TFBSs with a posterior probability
larger than 0.1. We then associated predicted TFBSs
with the 184,476 (human) or 116,064 (mouse) robust
promoters [23] as described previously [26] using a
-300.. +100 bp region with respect to the representative
genome position of the promoter, defined as its most
highly expressed position in the FANTOM5 samples.
For each motif in each sample, we calculated the Pearson correlation across the robust promoters between the
number of TFBSs estimated for each promoter and its
CAGE expression level. For each motif, we repeated this
procedure for 1,000 randomized position-weight matrices, in which the order of rows (corresponding to positions along the motif ) is randomly permuted. We then
expressed the Pearson correlation for each motif as a
Z-score by subtracting the mean and dividing by the
standard deviation of the Pearson correlations found
for the randomized motifs. The P-value displayed is the
tail probability of the normal distribution corresponding to this Z-score.
For each novel motif, we calculated the number of
predicted TFBSs for each promoter by summing their
Lizio et al. Genome Biology (2015) 16:22
posterior probabilities. We averaged this number over
the robust promoters and multiplied it by the number of
robust promoters in each of the co-expression clusters
to find the expected number of TFBSs for the motif
under the null hypothesis that the motif is not overrepresented in the given co-expression cluster. The observed
number of TFBSs of a motif was found by summing its
predicted TFBSs over the co-expression cluster. We then
calculated the statistical significance of motif overrepresentation in the co-expression cluster by finding the tail
probability of the observed number of TFBSs under a
Poisson distribution with a mean equal to the expected
number of TFBSs in the co-expression cluster.
Annotation of CAGE peaks based on transcript structure
We devised a hierarchical approach to annotate TSS regions (or CAGE peaks) with respect to Gencode V10
transcript model structures such as TSSs, proximal promoter regions (500 bp upstream and 500 bp downstream
of the TSS, or ending with the 3' end of its first exon),
exonic region split into coding and non-coding (differentiating non-coding transcript exons, coding transcripts'
5' UTR and 3' UTR exonic regions) as well as relative
position within the transcript (first, inner or last exon of
the transcript), and intronic regions (similarly differentiated with respect to the coding sequence and position
relative to the transcript). We also defined genome segments corresponding to the opposite DNA strand of
those TSSs, proximal promoters, exons and intronic regions. A CAGE peak can overlap more than one genome
segment region (for example, the proximal promoter region of a transcript and the first intron of another colocalized transcript). The annotation follows this hierarchy: TSS followed by proximal promoter regions, first
followed by inner and last exons, antisense the TSS, then
proximal promoter regions, then exonic regions, and finally intron (first sense and then antisense). The
complete process is described in Additional file 22, and
its implementation is based upon BedTools IntersectBed
and groupBy utilities [70].
Finally, we used the same genome segmentation annotation pipeline to annotate CAGE peaks with respect to
CpG island proximal region (retrieved from the UCSC
table browser), TATA box proximal region (based on a
genome-wide scanning of the JASPAR TATA-binding
protein position weight matrix [74]), repeat elements
(retrieved from the rmsk UCSC table) and ENCODE
clustered TFBS proximal region (wgEncodeRegTfbsClustered track from UCSCwgEncodeRegTfbsClustered track
from UCSC; region defined as cluster boundaries ±300 bp).
ZENBU data load and view configuration
We implemented a semi-automated pipeline using command line tools for bulk loading of the large numbers of
Page 10 of 14
CTSS and BAM alignment files into ZENBU along with
the corresponding sample annotation metadata using
ZENBU's command line tools [49]. Several preconfigured views where created and updated to aid users in
their research activities. Views included full sets of human and mouse samples, together with primary cell
only, cell line only and tissues only. In addition, the
flexibility of ZENBU allows researchers to modify and
create their own visualization views on the FANTOM5
data and share them publicly or within a collaboration.
BioMart interface for the defined transcription start site
regions
BioMart [43] is a freely available, open source, and
powerful query-oriented data management system. The
BioMart system provides simple web browser interfaces
and web services that allow a user to rapidly access an
underlying database without knowledge of its data
model. We customized the BioMart system to have
CAGE peak annotation data and sample annotation data
for both human and mouse. The FANTOM5 BioMart
provides researchers with a simple web interface for performing queries of the FANTOM5 CAGE peaks and
samples. It holds 1,048,124 human and 652,860 mouse
CAGE peaks for 889 human and 389 mouse samples.
Each CAGE peak has multiple attributes representing
various annotation properties, including gene association, repeat association, robust and permissive designations, TSS-like flags, and GENCODE association for
human and Ensembl association for mouse.
Configuration of BioLayout
BioLayout Express3D is an application that has been specifically designed for the integration, visualization, and
analysis of large network graphs derived from biological
data. It can be configured to a high degree in order to
respond to the needs of various areas of research. The
FANTOM5 BioLayout runs on a Java webstart program
accessible from the FANTOM5 site. When the Java webstart application is launched BioLayout is opened with
the input files that have been chosen as a default view
describing our data collection. Nodes can be either samples or genes. BioLayout itself can be configured in order
to provide access to other tools, such as SSTAR sample/
gene searches or ZENBU experiment searches.
Table extraction tool
FANTOM5 expression data are primarily distributed in
compressed tab-separated-value (TSV) file format, each
file consisting of the full set of CAGE peaks (184,827
rows in human and 116,277 rows in mouse) and expression values over samples (975 columns in human and
399 columns in mouse). In order to assist in the data extraction process we have created the FANTOM5 Table
Lizio et al. Genome Biology (2015) 16:22
Extract Tool (TET). TET is intended to be a simplified
way of extracting relevant sections from a curated set of
FANTOM5 data tables. Using TET a user will select one
of the FANTOM5 data sets, select the columns they
wish to extract (that is, samples), then specify a set of
rows (that is, CAGE peaks) using a regular expression
search pattern, and finally view or download the resulting subset.
Nanopublication
When exposing nanopublications from FANTOM5, we
followed a four-step process as in Additional file 23.
First, we examined the dataset to identify conceptual
entities (for example, CAGE peaks, TSSs, genes) and
assigned appropriate ontological descriptors. Second, we
composed RDF triples and used the Vocabulary of Interlinked Datasets (VoID) [76] to create a ‘naive’ data
model describing the data structure of the FANTOM5
entities. Using VoID statements, we could convert the
dataset to 'nanopublication compliant' RDF and give
each entry in the dataset (for example, each row-column
combination) a Uniform Resource Identifier (URI). For
example, each row of the dataset is transformed to a
CAGE peak web resource. Using the void:inDataset
predicate, each CAGE peak is linked back to the resource for the entire dataset. Subsequent predicates connect the CAGE peak to entities that represent columns
of the raw dataset.
The third and most intellectually demanding step was
to model the scientifically meaningful associations, the
provenance metadata and publication information. This
step uses the framework of the naive model to construct
the actual nanopublication data model. When considering
the FANTOM5 dataset, we developed several compelling
proposals on how to model TSS-related assertions. As we
worked through the models, we concluded that gene association should be a separate assertion (that is, a separate
nanopublication) from the definition of a CAGE peak region as well as its expression. We generated three types of
nanopublications: type I nanopublications make the link
between CAGE peaks and the physical genome location;
type II nanopublications make explicit the association that
a particular CAGE peak is also a TSS region for a particular gene; type III nanopublications link the CAGE peaks to
samples (that is, species, cell type) with the expression
levels in those samples. This has several advantages: first,
the process used to determine gene association is an independent process from the identification of CAGE peaks,
so the provenance of gene association should be different
from CAGE peak identification. Second, by separating the
gene association from CAGE peak assertion, we can easily
release a new set of associations if the FANTOM consortium needs to repeat the gene association process with different sets of data and/or parameters without redefining
Page 11 of 14
CAGE peaks. Third, it increases the granularity and reusability of data as others may use their own method/data to
assign gene associations with FANTOM5 CAGE peaks. In
modeling the provenance and publication information elements of the nanopublications, we chose here minimal
models that simply referenced the FANTOM5 Consortium. As they are used in this study, the nanopublications
have a clear provenance and so the minimal model is sufficient and without unnecessary complications. However, as
stand-alone publications the provenance could be elaborated upon, creating more ‘autonomous’ data with distinct
advantages for maximizing citations or for tracking scientific impact.
Lastly, we applied each of the three developed nanopublication models to instantiate the individual nanopublications as a referenceable linked data resource. This
involved writing a script to instantiate the triples that
compose the nanopublications. These triples were initially exported as large RDF files, which were then
uploaded in the triple store provided by the Database
Center for Life Science (DBCLS). The triple store is an
OpenLink Virtuoso OS 7.1 and provides the SPARQL
endpoint that is required to do integration queries such
as the one shown in the section above. The last step
consisted of making the nanopublication URLs resolvable, which is encouraged by and in line with the principles of Linked Data. This was achieved by means of a
virtual host redirect on the Apache web server and a
small application to query the triple store and return
the requested nanopublication as serialized RDF (in
Trig format. An example of each type of nanopublication, as well as a direct link to the triple store is available at [47]).
In writing these nanopublications, we surveyed existing ontologies. However, these were inadequate for our
purposes and we decided to develop our own ontology,
such as Reference Sequence Annotation (RSA) to fill
the gap [77]. We wanted the RSA to accommodate the
basic CAGE region description as well as scenarios such
as allowing a single annotation to be mapped onto different reference assemblies. This provided the mechanism to compare data between FANTOM4, FANTOM5,
and others.
Computational resource
To provide the on-line resources for FANTOM5, we
used nine physical servers and one virtual server for
web applications, databases and file systems (not including the RDF store, Enhancer Selector tool and
RIKENBASE). We used in total approximately 120
Tbytes hard disk space for storing data. We used existing software to host the data, and URLs of the source
code are summarized in Additional file 24. All of the
data are available at [28].
Lizio et al. Genome Biology (2015) 16:22
Additional files
Additional file 1: Attributes collected for individual samples.
Additional file 2: Curated names for human samples.
Additional file 3: Curated names for mouse samples.
Additional file 4: Structure of file names. (A) File names are
organized in a systematic way, where sample names, CAGE library ID,
RNA ID, and other information are delimited with dot ('.'). To allow
handling of special symbols by computers (such as Unix), the sample
names are encoded by URLencoding. (B) An example code to decode
the sample names in R.
Additional file 5: An example of analysis flow. Analysis steps are
indicated in rounded boxes, supplemented with tool names used. On the
right side, analysis examples at each step for someone who is interested
in transcriptional regulation networks to implement monocytic function
in fibroblasts (as in [78]) are shown.
Additional file 6: Information and analysis results on a monocyte
profile. The information collected on the samples, like detailed sample
and RNA information, highly expressed transcription factors, significant de
novo motifs, co-expressed sample clusters, and highly expressed repeats
are summarized into a single SSTAR page.
Additional file 7: Access to individual samples in SSTAR. Two ways
to identify samples of interest in SSTAR: by using a list of sample names
(orange arrows); by cell type inspection followed by selection of samples
of interest (purple arrows). If the sample of interest has one UBERON
term associated with it, a search through tissue types can be performed
too (blue arrow).
Additional file 8: Sample ontology enrichment analysis connected
to CAGE peak expression. Results of sample ontology enrichment
analysis on 'hematopoietic cell' showed one of the SPI1-related CAGE
peaks (p6@SPI1) as enriched. A link to the CAGE peak page where its
individual expression pattern can be confirmed.
Additional file 9: Graphical representation of sample-sample
relationships in the transcriptome space by BioLayout Express3D.
Individual nodes (spheres) indicate a sample in the transcriptome space
where the MCL (Markov cluster algorithm)-based clusters of samples are
represented. Clustering is obtained by using correlation coefficients of
expression as proximity metric. The three-dimensional graphs can be
zoomed in/out and rotated by mouse operations such as dragging.
Additional file 10: Graphical representation of CAGE peak
relationships in the transcriptome space by BioLayout Express3D.
Individual nodes (spheres) indicate a CAGE peak or a group of CAGE
peaks (cluster) very close to each other in the transcriptome space where
MCL-based clusters of CAGE peaks are represented. Clustering is obtained
by using correlation coefficients of expression as proximity metric.
Expression patterns of each CAGE peak can be shown as a graph by
pressing the Ctrl key followed by left-mouse button click.
Additional file 11: Find genes by keyword search. Keyword search in
the SSTAR top page enables genes to be found.
Additional file 12: Access to transcription factors and DNA motifs.
The side bar menu (top left) provides links to lists of transcription factors
and DNA motifs. A gene page for a transcription factor (on the right)
shows detailed information, including binding motifs. A DNA motif page
(center) provides a list of associated samples (the center window).
Additional file 13: ZENBU Data Explorer. The upper panel shows the
data explorer tab and the available options for displaying all data sets
(preconfigured views, preconfigured tracks, experiments, annotations).
The lower panel is an example of expression experiments where all data
sets are listed, including FANTOM5 CAGE. Users can select multiple data
sets for individual or pooled graphical representation.
Additional file 14: Interactive inspection of TSS activities with
ZENBU. The upper panel displays graphical representation of CAGE
signals at the SPI1 locus along the genome. Mouse dragging operation
enables a genomic region of interest to be specified (dark grey), and the
expression intensities under the region are dynamically visualized (lower
panel). The representation can be configured by clicking the 'gear' icon.
Page 12 of 14
Additional file 15: FANTOM5 TSS regions associated with ENCODE
regulatory track on the UCSC Genome Browser. FANTOM5 data hub
allows the FANTOM5 data to be displayed on the UCSC genome
browser. In addition to CAGE peaks displayed in this figure, CAGE signals
along the genome for individual experiments can be selected.
Additional file 16: Annotation export with BioMart. This screenshot
shows an example of how to obtain annotations of CAGE peaks,
including short descriptions, Human Genome Nomenclature Committee
gene IDs, presence of a TATA-box and CpG content.
Additional file 17: Table Extraction Tool. An example of how to
export a subset of CAGE peak expression values using TET. Users can
select columns in an interactive manner as shown in the left panel, and
select rows by specifying the matching string (regular expression). The
result can be exported as a table (the right panel) or visualized as a heat
map.
Additional file 18: Schema of the annotation pipeline. A
nanopublication is a schema built on top of existing semantic web
approaches that essentially labels a single scientifically meaningful
(publishable) assertion with metadata such that individual assertions are
citable and their impact trackable. Nanopublications are composed of
three elements: (1) the Assertion; (2) the Provenance metadata of the
assertion (for example, authors, methods, funding source, date/time); and
(3) the Provenance metadata about the nanopublication itself, in this
case called Publication Info.
Additional file 19: An example of a SPARQL query. A SPARQL query
that integrates data from three different Linked Data resources: the
FANTOM5 nanopublication repository, the FANTOM5 Ontology and
Linked Life Data. (A) The variables in the query linking the different
datasets together. First the FANTOM5 ontology is queried to find samples
from skeletal muscle. Then Linked Life Data is used to link the given
gene symbol MYOD to a Bio2RDF resource URL. This Bio2RDF URL is used
in the type II nanopublications to identify the CAGE peaks, which are a
TSS region for the given gene. Using the type 3 nanopublications, we
restrict the search for TSSs to the previously identified sample types that
have a tags per million value larger than 0 (meaning that there is evidence
for transcription on that region). Finally, the type I nanopublications provide
the start and end coordinates for the TSSs. (B) The actual query.
Additional file 20: An example of a SPARQL query. Retrieved data for
the query in Additional file 19 is shown.
Additional file 21: CAGE peaks and their annotation. Examples of
CAGE peaks identified in FANTOM5. Six peaks in the proximal region of
B4GALT1 promoters are identified, and their names are indicated as
p#@B4GALT1. The track below indicates that all of the peaks are
supported by at least one EST (expressed sequence tag) model.
Additional file 22: Classification of CAGE peaks according to the
transcript structure. Our hierarchical approach annotates CAGE peaks
(left side, colored boxes) with respect to Gencode V10 transcript model
structures (right side, grey boxes). The output of one step represents
peaks that were not annotated yet and makes the input to the next step,
as indicated by the direction of the arrows. The hierarchy is first run for
sense transcript models, and then again for anti-sense ones. At the end
of the pipeline, peaks are annotated as upstream and downstream (first
sense, then antisense) of a TSS.
Additional file 23: Workflow converting FANTOM5 data into
nanopublications.
Additional file 24: URLs of the source code used in the gateway.
Abbreviations
bp: base pair; CAGE: cap analysis of gene expression; CTSS: CAGE tag start
site; FANTOM5: Functional Annotation of Mammalian Genomes 5;
FF: FANTOM Five; GO: Gene Ontology; MCL: Markov Cluster Algorithm;
PCR: polymerase chain reaction; RDF: Resource Description Framework;
SSTAR: semantic catalog of samples, transcription initiation and regulators;
TET: Table Extraction Tool; TFBS: transcription factor binding site;
TSS: transcription start site; UTR: untranslated region.
Lizio et al. Genome Biology (2015) 16:22
Competing interests
The authors declare that they have no competing interests.
Authors’ contributions
ML created the data archives, and set up the ZENBU views; JH set up
BioMart, and created the TET tool; HS, SS, IA, TK, and HK developed SSTAR; JS
developed the ZENBU genome browser; KJB and TCF provided the results of
co-expression clustering; TCF, DW, and JH set up the BioLayout Express3D
web start; FH, SIK and SF handled metadata during data production; CM, TM
and AD developed FF ontology; ZT, MT, RK, EAS and PACH created
nanopublication; TK set up the RDF store; TT and KN loaded data in RIKENBASE;
AS devised the enhancer slider; HB, HO and KF performed integration of
BodyParts3D; ED and WH performed pathway enrichment analysis; EA performed
gene ontology enrichment analysis; MR performed de novo motif analysis; MDH
performed motif evaluation; NB performed computational TSS annotation; TL
performed TSS classification analysis; CD, MI, PC, HK, ARRF, and YH coordinated
the FANTOM5 project; HK led the data control and management group in
FANTOM5; ARRF and HK designed organization of the web resources; JH, TK,
ARRF, ML and HK wrote the manuscript. All authors read and approved the final
manuscript.
Acknowledgements
FANTOM5 was made possible by the following grants: Research Grant for
RIKEN Omics Science Center from MEXT to Yoshihide Hayashizaki; Grant of
the Innovative Cell Biology by Innovative Technology (Cell Innovation
Program) from the MEXT, Japan to Yoshihide Hayashizaki; Research Grant
from MEXT to the RIKEN Center for Life Science Technologies; Research
Grant to RIKEN Preventive Medicine and Diagnosis Innovation Program from
MEXT to Yoshihide Hayashizaki. This publication was also supported by a
grant from the John Templeton Foundation, EU’s Innovative Medicine Joint
Undertaking under grant agreement number 115191 (Open PHACTS), the
Novo Nordisk and Lundbeck Foundations, the European Union Seventh
Framework Programme (FP7/2007-2013) under grant agreement number
305444 (RD-Connect), the Center for Medical Systems Biology within the
framework of The Netherlands Genomics Initiative (NGI)/Netherlands
Organisation for Scientific Research (NWO), an Institute Strategic Grant from
the Biotechnology and Biological Sciences Research Council (BBSRC; grant
number BB/JO1446X/1, BB/I001107/1), and the Director, Office of Science,
Office of Basic Energy Sciences, of the US Department of Energy under
contract number DE-AC02-05CH11231. The opinions expressed in this
publication are those of the authors and do not necessarily reflect the views
of the John Templeton Foundation. The pictures in Figure 1 are provided by
Gundula G Schulze-Tanzil (tenocyte), Anna Ehrlund (Adipocyte), RIKEN BRC
(cell lines), and BodyParts 3D (tissues). We would like to thank all members
of the FANTOM5 consortium for contributing to generation of samples and
analysis of the data-set and thank GeNAS for data production. We would also
like to thank Kang Li for working on the enhancer slider.
Author details
1
Omics Science Center, RIKEN Yokohama Institute, 1-7-22 Suehiro-cho,
Tsurumi-ku, Yokohama, Kanagawa 230-0045, Japan. 2Division of Genomic
Technologies (DGT), RIKEN Center for Life Science Technologie, 1-7-22
Suehiro-cho, Tsurumi-ku, Yokohama, Kanagawa 230-0045, Japan. 3RIKEN
Preventive Medicine and Diagnosis Innovation Program, 2-1 Hirosawa, Wako,
Saitama 351-0198, Japan. 4Preventive medicine and applied genomics unit,
RIKEN Advanced Center for Computing and Communication, 1-7-22
Suehiro-cho, Tsurumi-ku, Yokohama, Kanagawa 230-0045, Japan. 5Genomics
Division, Lawrence Berkeley National Laboratory, 84R01, 1 Cyclotron Road,
Berkeley, CA 94720, USA. 6Mouse Informatics, European Molecular Biology
Laboratory, European Bioinformatics Institute, Wellcome Trust Genome
Campus, Hinxton, Cambridge CB10 1SD, UK. 7The Roslin Institute and Royal
(Dick) School of Veterinary Studies, University of Edinburgh, Easter Bush,
Edinburgh, Midlothian EH25 9RG, Scotland, UK. 8Department of Human
Genetics, BioSemantics Group, Leiden University Medical Center, Albinusdreef
2, Leiden 2333 ZA, Netherlands. 9Department of Internal Medicine III,
University Hospital Regensburg, F.-J.-Strauss Allee 11, Regensburg D-93042,
Germany. 10Database Center for Life Science, Research Organization of
Information and Systems, 1111 Yata, Mishima 411-8540, Japan. 11Department
of Biology & Biotech Research and Innovation Centre, Section for
Computational and RNA Biology, Copenhagen University, Ole Maaloes Vej 5,
Copenhagen N DK2200, Denmark. 12Department of Biostatistics, Harvard
Page 13 of 14
School of Public Health, 655 Huntington Avenue, Boston, MA 02115, USA.
13
Department of Neurology, University at Buffalo School of Medicine and
Biomedical Sciences, 701 Ellicott Street, Buffalo, NY 14203, USA.
14
BioSemantics Group, Leiden Institute of Advanced Computer Science,
Leiden University, 111 Snellius, Niels Bohrweg 1, Leiden 2333 CA,
Netherlands. 15Database Center for Life Science, Research Organization of
Information and Systems, 178-4-4 Wakashiba, Kashiwa, Chiba 277-0081,
Japan. 16Integrated Database Unit, RIKEN Advanced Center for Computing
and Communication, 2-1 Hirosawa, Wako, Saitama 351-0198, Japan.
17
Sheffield Institute for Translational Neuroscience, University of Sheffield,
385a Glossop Road, Sheffield S10 2HQ, UK. 18Telethon Kids Institute, The
University of Western Australia, Perth, Western Australia 6008, Australia.
19
Cancer Science Institute of Singapore, National University of Singapore,
Singapore 117599, Singapore.
Received: 13 May 2014 Accepted: 3 December 2014
References
1. Kawai J, Shinagawa A, Shibata K, Yoshino M, Itoh M, Ishii Y, et al. Functional
annotation of a full-length mouse cDNA collection. Nature. 2001;409:685–90.
2. Okazaki Y, Furuno M, Kasukawa T, Adachi J, Bono H, Kondo S, et al. Analysis
of the mouse transcriptome based on functional annotation of 60,770 fulllength cDNAs. Nature. 2002;420:563–73.
3. Carninci P, Kasukawa T, Katayama S, Gough J, Frith MC, Maeda N, et al. The
transcriptional landscape of the mammalian genome. Science 2005, 309:1559–1563.
4. NCBI, Resource Coordinators. Database resources of the National Center for
Biotechnology Information. Nucleic Acids Res. 2013;41:D8–D20.
5. Soejima H, Kawamoto S, Akai J, Miyoshi O, Arai Y, Morohka T, et al. Isolation of
novel heart-specific genes using the BodyMap database. Genomics.
2001;74:115–20.
6. Takeda J, Yamasaki C, Murakami K, Nagai Y, Sera M, Hara Y, et al. H-InvDB in
2013: an omics study platform for human functional gene and transcript
discovery. Nucleic Acids Res. 2013;41:D915–9.
7. Flicek P, Ahmed I, Amode MR, Barrell D, Beal K, Brent S, et al. Ensembl 2013.
Nucleic Acids Res. 2013;41:D48–55.
8. Kasukawa T, Katayama S, Kawaji H, Suzuki H, Hume DA, Hayashizaki Y.
Construction of representative transcript and protein sets of human, mouse,
and rat as a platform for their transcriptome and proteome analysis.
Genomics. 2004;84:913–21.
9. Wang J, Liang P. DigiNorthern, digital expression analysis of query genes
based on ESTs. Bioinformatics. 2003;19:653–4.
10. Kruger A, Hofmann O, Carninci P, Hayashizaki Y, Hide W. Simplified
ontologies allowing comparison of developmental mammalian gene
expression. Genome Biol. 2007;8:R229.
11. Chetverin AB, Kramer FR. Oligonucleotide arrays: new concepts and
possibilities. Biotechnology (N Y). 1994;12:1093–9.
12. Shalon D, Smith SJ, Brown PO. A DNA microarray system for analyzing
complex DNA samples using two-color fluorescent probe hybridization.
Genome Res. 1996;6:639–45.
13. Churchill GA. Fundamentals of experimental design for cDNA microarrays.
Nat Genet. 2002;32:490–5.
14. Edgar R, Domrachev M, Lash AE. Gene Expression Omnibus: NCBI gene expression
and hybridization array data repository. Nucleic Acids Res. 2002;30:207–10.
15. Rustici G, Kolesnikov N, Brandizi M, Burdett T, Dylag M, Emam I, et al.
ArrayExpress update–trends in database growth and links to data analysis
tools. Nucleic Acids Res. 2013;41:D987–90.
16. Ikeo K, Ishi-i J, Tamura T, Gojobori T, Tateno Y. CIBEX: center for information
biology gene expression database. C R Biol. 2003;326:1079–82.
17. Su AI, Wiltshire T, Batalov S, Lapp H, Ching KA, Block D, et al. A gene atlas of
the mouse and human protein-encoding transcriptomes. Proc Natl Acad Sci
U S A. 2004;101:6062–7.
18. Kapushesky M, Emam I, Holloway E, Kurnosov P, Zorin A, Malone J, et al.
Gene expression atlas at the European bioinformatics institute. Nucleic
Acids Res. 2010;38:D690–8.
19. Wu C, Orozco C, Boyer J, Leglise M, Goodale J, Batalov S, et al. BioGPS: an
extensible and customizable portal for querying and organizing gene
annotation resources. Genome Biol. 2009;10:R130.
20. Shiraki T, Kondo S, Katayama S, Waki K, Kasukawa T, Kawaji H, et al. Cap
analysis gene expression for high-throughput analysis of transcriptional
Lizio et al. Genome Biology (2015) 16:22
21.
22.
23.
24.
25.
26.
27.
28.
29.
30.
31.
32.
33.
34.
35.
36.
37.
38.
39.
40.
41.
42.
43.
44.
45.
46.
47.
48.
49.
50.
starting point and identification of promoter usage. Proc Natl Acad Sci U S A.
2003;100:15776–81.
Qi YX, Liu YB, Rong WH. RNA-Seq and its applications: a new technology for
transcriptomics. Yi Chuan. 2011;33:1191–202.
Kanamori-Katayama M, Itoh M, Kawaji H, Lassmann T, Katayama S, Kojima M,
et al. Unamplified cap analysis of gene expression on a single-molecule
sequencer. Genome Res. 2011;21:1150–9.
Forrest ARR, Kawaji H, Rehli M, Kenneth Baillie J, de Hoon MJL, Haberle V, et al.
A promoter-level mammalian expression atlas. Nature. 2014;507:462–70.
Carninci P, Sandelin A, Lenhard B, Katayama S, Shimokawa K, Ponjavic J, et al.
Genome-wide analysis of mammalian promoter architecture and evolution.
Nat Genet. 2006;38:626–35.
Kawaji H, Kasukawa T, Fukuda S, Katayama S, Kai C, Kawai J, et al. CAGE
Basic/Analysis Databases: the CAGE resource for comprehensive promoter
analysis. Nucleic Acids Res. 2006;34:D632–6.
Suzuki H, Forrest AR, van Nimwegen E, Daub CO, Balwierz PJ, Irvine KM, et al.
The transcriptional network that controls growth arrest and differentiation in a
human myeloid leukemia cell line. Nat Genet. 2009;41:553–62.
Kawaji H, Severin J, Lizio M, Waterhouse A, Katayama S, Irvine KM, et al. The
FANTOM web resource: from mammalian transcriptional landscape to its
dynamic regulation. Genome Biol. 2009;10:R40.
FANTOM5 [http://fantom.gsc.riken.jp/5/]
Povey S, Lovering R, Bruford E, Wright M, Lush M, Wain H. The HUGO Gene
Nomenclature Committee (HGNC). Hum Genet. 2001;109:678–80.
Ashburner M, Ball CA, Blake JA, Botstein D, Butler H, Cherry JM, et al. Gene
ontology: tool for the unification of biology. The Gene Ontology
Consortium. Nat Genet. 2000;25:25–9.
Mungall CJ, Torniai C, Gkoutos GV, Lewis SE, Haendel MA. Uberon, an
integrative multi-species anatomy ontology. Genome Biol. 2012;13:R5.
Smith B, Ashburner M, Rosse C, Bard J, Bug W, Ceusters W, et al. The OBO
Foundry: coordinated evolution of ontologies to support biomedical data
integration. Nat Biotechnol. 2007;25:1251–5.
Mitsuhashi N, Fujieda K, Tamura T, Kawamoto S, Takagi T, Okubo K. BodyParts3D:
3D structure database for anatomical concepts. Nucleic Acids Res. 2009;37:D782–5.
Rosse C, Mejino Jr JLV. A Reference Ontology for Bioinformatics: The
Foundational Model of Anatomy. J Biomed Inform. 2003;36:478–500.
Itoh M, Kojima M, Nagao-Sato S, Saijo E, Lassmann T, Kanamori-Katayama M,
et al. Automated workflow for preparation of cDNA for cap analysis of gene
expression on a single molecule sequencer. PLoS One. 2012;7:e30809.
Anders S, Huber W. Differential expression analysis for sequence count data.
Genome Biol. 2010;11:R106.
Robinson MD, McCarthy DJ, Smyth GK. edgeR: a Bioconductor package for
differential expression analysis of digital gene expression data.
Bioinformatics. 2010;26:139–40.
Rayner TF, Rocca-Serra P, Spellman PT, Causton HC, Farne A, Holloway E,
et al. A simple spreadsheet-based. MIAME-supportive format for microarray
data: MAGE-TAB. BMC Bioinformatics. 2006;7:489.
Sansone SA, Rocca-Serra P, Field D, Maguire E, Taylor C, Hofmann O, et al.
Toward interoperable bioscience data. Nat Genet. 2012;44:121–6.
Meyer LR, Zweig AS, Hinrichs AS, Karolchik D, Kuhn RM, Wong M, et al. The
UCSC Genome Browser database: extensions and updates 2013. Nucleic
Acids Res. 2013;41:D64–9.
The ENCODE Project Consortium. An integrated encyclopedia of DNA
elements in the human genome. Nature. 2012;489:57–74.
Bernstein BE, Stamatoyannopoulos JA, Costello JF, Ren B, Milosavljevic A,
Meissner A, et al. The NIH Roadmap Epigenomics Mapping Consortium. Nat
Biotechnol. 2010;28:1045–8.
Kasprzyk A: BioMart: driving a paradigm change in biological data
management. Database (Oxford) 2011, 2011:bar049.
Semantic MediaWiki [http://semantic-mediawiki.org/]
Wikipedia [http://wikipedia.org/]
Mons B, van Haagen H, Chichester C, Hoen PB, den Dunnen JT, van
Ommen G, et al. The value of data. Nat Genet. 2011;43:281–3.
BioSemantics [http://rdf.biosemantics.org]
RIKENBASE [http://database.riken.jp]
Severin J, Lizio M, Harshbarger J, Kawaji H, Daub CO, Hayashizaki Y, et al.
Interactive visualization and analysis of large-scale sequencing datasets
using ZENBU. Nat Biotechnol. 2014;32:217–9.
Andersson R, Gebhard C, Miguel-Escalada I, Hoof I, Bornholdt J, Boyd M, et al.
An atlas of active enhancers across human cell types and tissues. Nature.
2014;507:455–61.
Page 14 of 14
51. Freeman TC, Goldovsky L, Brosch M, van Dongen S, Maziere P, Grocock RJ,
et al. Construction, visualisation, and clustering of transcription networks
from microarray expression data. PLoS Comput Biol. 2007;3:2032–42.
52. FANTOM5: CD14+ Monocytes, donor1, [http://fantom.gsc.riken.jp/5/sstar/
FF:11224-116B9]
53. Whetzel PL, Noy NF, Shah NH, Alexander PR, Nyulas C, Tudorache T, et al.
BioPortal: enhanced functionality via new Web services from the National
Center for Biomedical Ontology to access and use ontologies in software
applications. Nucleic Acids Res. 2011;39:W541–5.
54. van Dongen S, Abreu-Goodger C. Using MCL to extract clusters from
networks. Methods Mol Biol. 2012;804:281–95.
55. Nanopub [http://nanopub.org/]
56. Bizer C, Heath T, Berners-Lee T. Linked Data - the story so far. Int J Semantic
Web Inf Syst. 2009;5:1–22.
57. Linked Data [http://linkeddata.org/]
58. Patrinos GP, Cooper DN, van Mulligen E, Gkantouna V, Tzimas G, Tatum Z,
et al. Microattribution and nanopublication as means to incentivize the
placement of human genome variation data into the public domain. Hum
Mutat. 2012;33:1503–12.
59. SPARQL [http://www.w3.org/TR/sparql11-query/]
60. Linked life data [http://linkedlifedata.com/]
61. Fujibuchi W, Kiseleva L, Taniguchi T, Harada H, Horton P. Cell Montage:
similar expression profile search server. Bioinformatics. 2007;23:3103–4.
62. Yamashita R, Sugano S, Suzuki Y, Nakai K. DBTSS: DataBase of Transcriptional
Start Sites progress report in 2012. Nucleic Acids Res. 2012;40:D150–4.
63. Kawaji H, Lizio M, Itoh M, Kanamori-Katayama M, Kaiho A, Nishiyori-Sueki H,
et al. Comparison of CAGE and RNA-seq transcriptome profiling using
clonally amplified and single-molecule next-generation sequencing.
Genome Res. 2014;24:708–17.
64. Takahashi H, Lassmann T, Murata M, Carninci P. 5' end-centered expression
profiling using cap-analysis gene expression and next-generation sequencing.
Nat Protoc. 2012;7:542–61.
65. Kawaji H, Hayashizaki Y, Daub CO. SDRF2GRAPH: a visualization tool of a
spreadsheet-based description of experimental processes. BMC Bioinformatics.
2009;10:133.
66. SDRF2GRAPH [http://fantom.gsc.riken.jp/4/sdrf2graph]
67. Lassmann T, Hayashizaki Y, Daub CO. TagDust–a program to eliminate artifacts
from next generation sequencing data. Bioinformatics. 2009;25:2839–40.
68. Djebali S, Davis CA, Merkel A, Dobin A, Lassmann T, Mortazavi A, et al.
Landscape of transcription in human cells. Nature. 2012;489:101–8.
69. Li H, Handsaker B, Wysoker A, Fennell T, Ruan J, Homer N, et al. The Sequence
Alignment/Map format and SAMtools. Bioinformatics. 2009;25:2078–9.
70. Quinlan AR, Hall IM. BEDTools: a flexible suite of utilities for comparing
genomic features. Bioinformatics. 2010;26:841–2.
71. Enright AJ, Van Dongen S, Ouzounis CA. An efficient algorithm for
large-scale detection of protein families. Nucleic Acids Res.
2002;30:1575–84.
72. Beissbarth T, Speed TP. GOstat: find statistically overrepresented Gene
Ontologies within a group of genes. Bioinformatics. 2004;20:1464–5.
73. Subramanian A, Tamayo P, Mootha VK, Mukherjee S, Ebert BL, Gillette MA, et al.
Gene set enrichment analysis: a knowledge-based approach for interpreting
genome-wide expression profiles. Proc Natl Acad Sci U S A. 2005;102:15545–50.
74. Bryne JC, Valen E, Tang MH, Marstrand T, Winther O, da Piedade I, et al. JASPAR,
the open access database of transcription factor-binding profiles: new content
and tools in the 2008 update. Nucleic Acids Res. 2008;36:D102–6.
75. Cock PJ, Antao T, Chang JT, Chapman BA, Cox CJ, Dalke A, et al. Biopython:
freely available Python tools for computational molecular biology and
bioinformatics. Bioinformatics. 2009;25:1422–3.
76. Describing Linked Datasets with the VoID Vocabulary [http://www.w3.org/
TR/void/]
77. Tatum Z, Roos M, Gibson AP, Taschner PE, Thompson M, Schultes EA, et al.
Preserving sequence annotations across reference sequences. J Biomed
Semantics. 2014;5:S6.
78. Suzuki T, Nakano-Ikegaya M, Yabukami-Okuda H, de Hoon M, Severin J,
Saga-Hatano S, et al. Reconstruction of monocyte transcriptional regulatory
network accompanies monocytic functions in human fibroblasts. PLoS One.
2012;7:e33474.

© Copyright 2026