
Fill Factor Enhancement of Amorphous Silicon Solar Cells for High
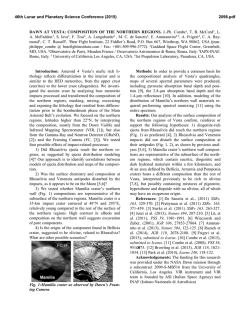
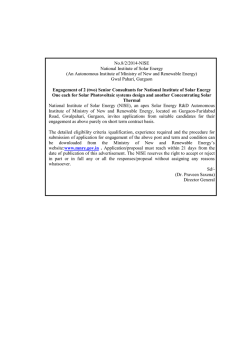
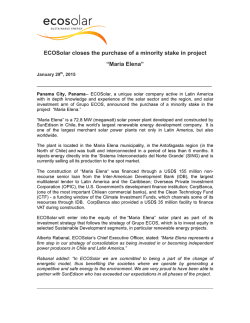
J. Energy Power Sources Vol. 2, No. 1, 2015, pp. 1-5 Received: September 8, 2014, Published: January 30, 2015 Journal of Energy and Power Sources www.ethanpublishing.com Fill Factor Enhancement of Amorphous Silicon Solar Cells for High Efficiency Tandem Structures Osama Tobail Egypt Nanotechnology Center (EGNC), Cairo University, 12588 Giza, Egypt Corresponding author: Osama Tobail ([email protected]) Abstract: We focus on three types of material grown by Plasma Enhanced Chemical Vapour Deposition (PECVD) for fabricating the absorber of the bottom cell in tandem structures: (1) Hydrogenated microcrystalline silicon (µc-Si:H); (2) Hydrogenated amorphous silicon germanium a-SiGe:H alloy; (3) Hydrogenated microcrystalline silicon germanium (µc-SiGe:H) alloy. A baseline of reproducible and homogeneous germanium based low band gab absorber bottom cell has been achieved. Solar cell characterization showed that the fabricated bottom solar cell performance is limited by small fill factor due to high series resistance. AMPS-1D simulation of the fabricated cells show that the fill factor limitation of the low band gap cells is due to a 0.5 eV barrier at the p/i interface. This barrier was reduced to 0.1 eV by adding Ge to the p-type window layer. The fabricated cells have an increased fill factor from 53.2 to 58.8% due to a reduction of cell series resistance from 8.3 to 4.8 cm-2. Keywords: Solar cells, hydrogenated amorphous silicon, tandem cells, band gap engineering. Nomenclature: d DR EQE TCE Ec Eg Ev FF IQE J Jsc k L Lc n V Voc Rs T Absorption coefficient (1 cm-1) Energy conversion efficiency (%) Standard deviation Wavelength of light (nm) Absorber thickness (nm) Dilution ratio (%) External quantum efficiency (%) Transparent conductive electrode Conduction band edge (eV) Energy gap (eV) Valence band edge (eV) Fill factor (%) Internal quantum efficiency (%) Measured current density (mA cm-2) Short circuit current density (mA cm-2) Imaginary part of the refractive index Absorption length (cm) Carrier collection length (nm) Real part of the refractive index Measured cell voltage (V) Open circuit voltage (V) Series resistance ( cm-2) Temperature (C) 1. Introduction The cost structure analysis of the supply chain for crystalline silicon solar cell indicates high potential of transferring certain industries to countries like Egypt more than others [1]. Basically, energy and labor intensive industries are more suitable for Egypt. However, labor training and know-how localization is a critical issue for sustainable Photovoltaic (PV) industry and development. In the frame of localizing different PV basic technologies, we are developing PV technologies in the field of wafer based and thin film silicon solar cells [2-5]. For thin film silicon solar cells tandem structures are necessary to enable absorption of the whole spectrum. We found that although the good collection length of our solar cells in the range of 150 nm [4], which is larger than our absorber thickness (120 nm), the test cells suffer from limited fill factor. We ascribe the limited fill factor to the elevated series resistance of the test cells. Performing AMPS-1D simulation resulted in 2 Fill Fa actor Enhance ement of Amo orphous Silico on Solar Cells s for High Effiiciency Tande em Structures s that the reasoon of the elevvated series reesistance is thhe potential barrrier between the high ban nd gap window w p-layer and thhe low band ggap absorber i-layer. i Addinng germanium to t the p-type window layer reduces thhe potential barrrier from 0.55 eV to 0.1 eV and hencce reduced the cell series resisstance from 8.3 to 4.8 cm m-2. The impact off the new winddow layer on the t fill factor is that it was enhanced e from m 53.2 to 58 8.8% due to a reduction of cell c series resiistance. 2. Experim mental Detaiils Multi-Cham mber Plasma Enhanced Ch hemical Vapoor Deposition (P PECVD) servves to depositt hydrogenateed amorphous/m microcrystallinne silicon an nd germanium m alloys (a-Si::H/µc-Si:H aa-SiGe:H and d µc-SiGe:H H). Different chaambers are used to avoid doping d memorry and cross coontamination. Silane and germane g gasees are used to deposit d siliconn and germaniium layers annd phosphine annd diborane aare used for n- and p-typpe doping, respeectively. The gas are generrally diluted iin hydrogen witth a dilution rratio defined as the ratio oof the flow ratees, DR = H2/((GeH4+SiH4).. The substratte temperature is i fixed at T = 250 C by heeating from thhe bottom via ceramic c heateer. The pressu ure and poweer used at PECV VD processing is 4 Torr (5 5.33 mbar) annd -22 80 mW cm . Optimized deposition paarameters succh as hydrogen dilution and Ge content are performeed systematicallyy and publiished elsewh here [6]. Foor microcrystalline material, the plasm ma power annd pressure in addition a to tthe hydrogen dilution ratiio were varied in ranges too optimize th he crystallinityy, which was inndicated by the open circuitt voltage of thhe cell in additioon to Raman sshift. Fig. 1 scheematically deppict the cell structure s of thhe p-i-n solar celll on a glass suubstrate. The light penetratees the glass and the ZnO:Al llayer and is ab bsorbed mainlly in the intrinsicc a-SiGe:H abbsorber layer. First, F aluminum m doped zinc oxxide (ZnO:All) was sputtereed on the glasss substrate to foorm the Transsparent Condu uctive Electrodde (TCE). Surfacce texture was formed on the TCE by shoort dip in 5% HC CL solution. Thhe textured fron nt ZnO togetheer Fig. 1 A schematic of o the a-SiGe based (p-i-n) ssolar cell depositeed by PECVD on a glass supeerstrate. with thhe back side reeflector compoosed of a stackk of ZnO and metals m (Ag/Al)) enhance thee light trapping. The TCE deposition d parameters aree adjusted tto form ZnO:A Al with sheet reesistance of 5 /Sq. The abbsorption length L = 1/, wh hile the absorpption coefficieent of the layer was determ mined from thee imaginary paart (k) of the measured compleex refractive inndex by the reelation = 2/kk. The complex refractive inndex (n + ik) and the layer thickness t weere determined by modellling the measurred white lightt interferometrry [7]. 3. Ressults and Diiscussions Our first results th he hydrogen dilution d ratio eeffect on the drifft length and hence h cell effiiciency was puublished in Ref. [4]. We repeaated the cell onn large area too test the statisticcs and homog geneity of our process. Fig. 2 shows the bacck side of the solar cells witth the metallicc points. Each 6 cells are inccluded in a dotted d square and the average av and sttandard deviaation of the cell efficienncy are shown n near to the square. The sstatistics of the 48 4 cells show ws a standard deviation d of 0.15 over 2 10 cm . Table 1 su ummarizes thee parameters of solar cells inn Fig. 2 and its statistics. The absorber material of the soolar cells in Fig. 2 was analyzeed by our method publisheed in [4]. The method determ mines the drift length from the t measured Internal Quantuum Efficiency y (IQE) withh the analogyy of the well-knnown method to determine the t diffusion llength of Fill Fa actor Enhance ement of Amo orphous Silico on Solar Cells s for High Effiiciency Tande em Structures s 3 ndard deviation n for the 48 cellls Table 1 The mean and stan output parameeters shown in F Fig. 2. Parameter Mean Standard deviiation Voc 522.665 69.7772 Jsc 15.88 0.797 FF 51.44 1.840 4.4 0.319 (a) Fig. 2 Photoggraph of fabriccated array off 48 solar on aan area of 10 cm2. crystalline Si solar cells [8]. This metho od determined a carrier collecction length Lc = 190 nm, larger than thhe absorber layyer thickness of d = 12 20 nm. As a consequence of the relativvely large co ollection lengtth compared to cell c thickness, the electroniic quality is noot responsible foor the limited cell performan nce. Therefore, the small fill factor (51%) is most probaably limited bby series resistaance and not material quaality, while w we determined a series resistannce in the ord der of 8 cm--2. While the celll area is smalll and no laterral resistance is existing especcially becausee of the low sheet s resistancce of our TCE (/Sq), ( we asscribe the resiistive losses tto the device itself especiaally the potential barrierrs between diffferent layers. To better understand u thhe potential barrriers resultingg from the baand diagram oof our cells, we modeled the ssolar cell by AMPS-1D A [9]. Fig. 3a shhows the enerrgy band diag grams resulteed from AMPS--1D for two cells with diifferent p-layeer band gap Eg = 1.8 eV for ppure a-Si:H an nd Eg = 1.6 eV V for p-type a-SiGe:H. Holees are represeented as circlees beneath the valence v band edge (Ev) and d its motion is indicated by a left arrow, w while electronss (circles abovve the conductioon band edge Ec) injection iss indicated by a right arrow. It I is obvious thhat the photog generated holees at the i-layer is i facing a largger barrier if injected i to purre + a-Si:H than a--SiGe:H p -laayer. Fig. 3b-3 3c compares thhe barrier heightt of both casess. It is clear fro om Fig. 3b thaat (b) (c) Fig. 3 Energy band d diagrams resulted from A AMPS-1D ar cells: (a) with h different p+-tyype band simulattion for the sola gaps; (b b) with band gap of p+-layer a-Si:H Eg = 1..8 eV; (c) with baand gap Eg = 1.6 6 eV for the Gee containing p+--layer. the holles are facing 0.5 eV barrieer to flow intoo a-Si:H, while only o 0.1 eV potential p barriier is to be croossed in the casse of a-SiGe:H H in Fig. 3c. The Ge conttent was adjusteed according to our optim mization publiished in Ref. [66] to adjust the band gap off the p+-layerr to Eg = 1.6 eV V. To achieve the t desired baand gap, a Gee content of 20% % was incorporated at 5% germane to silaane ratio [6]. Fig. 4a-4b com mpares the current/voltag c ge (J/V) charactteristics under simulatedd AM1.5G aand the Externnal Quantum Efficiency E (EQ QE), respectivvely, for solar cells c with a-Sii:H p-layer annd a-SiGe:H p+-layer. The im mproved cell efficiency duue to incorporration of Ge into the p+-typee window layyer is ascribedd to the enhancced series resistance from Rs = 8.3 to 4.8 cm-2, while the t absorber quality q was noot changed. Thhis result confirm ms that the red duction of the p/i interface ppotential barrierr height by inccorporating Gee into the p+-laayer and reducinng its band gaap from 1.8 eV V to 1.6 eV ennhanced the chaarge carrier collection from m the absorbeer to the + p -layeer and hence increased thee cell perform mance by series resistance r deccrease to the half. h It is knoown that the p-layer should have h a wide baand gap to ennsure the 4 Fill Factor Enhancement of Amorphous Silicon Solar Cells for High Efficiency Tandem Structures (a) (a) (b) Fig. 4 (a) Measured current/voltage characteristics of the cells with and without Ge incorporated in the p+-type window; (b) Comparison of measured quantum efficiency of cells with and without Ge incorporation into the p-layer. (b) Fig. 5 (a) Raman-Shift measurement for c-Si:H and c-SiGe:H; (b) Measured absorption length as function of wavelength for c-Si1-xGex:H for x = 0.1, 0.15 and 0.2 and compared to standard c-Si:H (x = 0). light transmission to the i-layer where the photogenerated carriers can be collected by drift. Therefore, quantum efficiency measurement is critical to investigate the influence of the p-layer band gap reduction on the cell spectral behavior. Fig. 4b compares the EQE for the cells with a-Si:H and a-SiGe:H p-layers. Apparently, the increase in the carrier collection of short wavelengths, which are photons absorbed near to the p/i interface, overcomes the slight decrease of photon penetration into the i-layer due to the decreased band gap of the a-SiGe:H p-layer. Consequently, the overall behavior of the cell with reduced p-layer band gap showed an improved spectral response beside the improved electronic and electrical responses. A further enhancement of the cell performance can be achieved by reducing the i-layer thickness further to enable more efficient carrier collection. However, reducing the layer thickness will reduce the total absorbed photons. Therefore, we are currently optimizing microcrystalline silicon germanium alloy (c-SiGe:H) to achieve higher absorption and at the same time enhanced electronic quality in addition to elevated growth rate. Fig. 5a compares between the measured Raman shift of excitation laser of 633 nm for c-SiGe:H and Fill Factor Enhancement of Amorphous Silicon Solar Cells for High Efficiency Tandem Structures 5 c-Si:H. For the microcrystalline Si, we observed the Si-Si peak at 520 cm-1 in addition to the wide peak for the amorphous Si at 480 cm-1. Both peaks are also absorption length. observed in the case of c-SiGe:H, in addition to another clear peaks at 280 cm-1 and 380 cm-1. The peak at 280 cm-1 was observed also in the literature [10]. We ascribe the peak at 380 cm-1 to the Si-Ge interaction, while its sharpness is related to the crystallinity level. This work was performed under a joint development agreement between IBM Research and the Government of the Arab Republic of Egypt through Egypt Nanotechnology Center (EGNC). I am very grateful to A. Abou-Kandil, J. Kim, D. Sadana, M. El-Ashry for the fruitful discussions and support. The deposited c-SiGe:H layers shows also very high absorption compared to c-Si:H. Fig. 5b compares the measured absorption length of three different c-SiGe:H layers deposited with variable Ge atomic ratios to our reference c-Si:H. Increasing the Ge ratio slightly decreases the absorption length at the mid-wavelengths, however, it increases the absorption at long wavelengths due to the mid-gap defects. Therefore, considering the absorber electronic quality should be considered together with the absorption enhancement. 4. Conclusions The origin of the fill factor limitation of the a-SiGe:H bottom cell was determined experimentally and by AMPS-1D simulation and found that not the material quality, but the series resistance is responsible for the reduced cell performance. The simulation suggests decreasing the p-layer band gap from 1.8 to 1.6 eV to reduce the potential barrier from 0.5 to 0.1 eV. Fabrication of identical cells except with p+-layers with 1.8 eV for one type and 1.6 eV for the other type proved that the series resistance was reduced from 8.3 to 4.8 cm-2. The reduced series resistance resulted in an increase in the carrier collection especially carriers generated near to the p/i interface, as was obvious in the measure quantum efficiency beside the J/V characteristics and hence an 5.6% abs. enhancement of the fill factor. For further enhancement of the bottom cell, we are suggesting microcrystalline silicon germanium alloy as an absorber with 5 times enhanced Acknowledgment References [1] O. Tobail, Potenial of photovoltaic industry in Egypt, J. Energy Power Engineering 7 (2013) 1844-1851. [2] K.E. Fogel, J.H. Kim, D.K. Sadana, J.S. Tulevski, A.I. Abou-Kandil, H.S. Mohamed, M. Saad, O. Tobail, Photovoltaic devices with an interfacial band-gap modifying structure and methods for forming the same, US patent Pub. No.: US 2012/0031477 A1, Feb. 9, 2012. [3] O. Tobail, A.I. Abou-Kandil, M. El-Ashry, J. Kim, P. Kozlowski, M. Saad, D. Sadana, Deposition of hydrogenated thin film, US patent Pub. No.: US 2012/0156393 A1, Jun. 21, 2012. [4] O. Tobail, Method to determine the collection length in field-driven a-SiGe:H solar cells, Energy Procedia 10 (2011) 213-219. [5] K. Wang, O. Gunawan, N. Moumen, G. Tulevski, H. Mohamed, B. Fallahazad, E. Tutuc, S. Guha, Wire textured, multi-crystalline Si solar cells created using self-assembled masks, Opt Express 8 (2010) A568-A574. [6] O. Tobail, Optimization of a-SiGe solar cells for tandem structures, in: Proc. 3rd IEEE Thermal Issues in Emerging Technologies Theory and Applications (ThETA 3) 2010, pp.309-312. [7] O. Tobail, Porous Silicon for Thin solar Cell Fabrication, Shaker Verlag, 2009, p. 38. [8] P.A. Basore, Extended spectral analysis of internal quantum efficiency, in: Proc. 23rd IEEE Photovoltaic Specialists Conference, Piscataway, New York, 1993, pp. 147-152. [9] AMPS-1D Manual, The Center for Nanotechnology Education and Utilization, The Pennsylvania State University, http://www.ampsmodeling.org/. [10] K.V. Maydell, K. Grundewald, M. Kellermann, O. Sergeev, P. Klement, N. Reinighaus, T. Kilper, Microcrystalline SiGe absorber layer in thin-film silicon solar cells, Energy Procedia 44 (2014) 209-215.


© Copyright 2026