
Treatment of Petrochemical Wastewater by employing Membrane
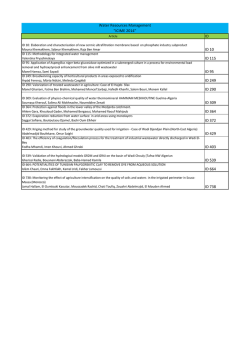
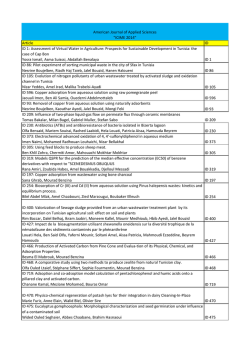
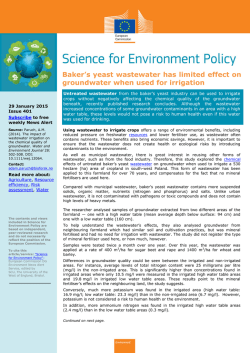
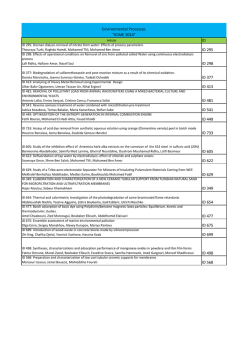
TREATMENT OF PETROCHEMICAL WASTEWATER BY EMPLOYING MEMBRANE BIOREACTORS: THE CASE STUDY OF PORTO-MARGHERA S. Di Fabio1, S. Malamis1,2, E. Katsou1, N. Frison3, F. Cecchi1, F. Fatone1 1 Department of Biotechnology, University of Verona, Strada Le Grazie 15, 37134 Verona, Italy Department of Water Resources and Environmental Engineering, School of Civil Engineering, National Technical University of Athens, 5 Iroon Polytechniou St., Zographou Campus, 15780, Athens, Greece 3 Department of Environmental Sciences, Informatics and Statistics, University Ca’Foscari of Venice, Dorsoduro 2137, 30121 Venice, Italy 2 Abstract The effectiveness of MBR technology to treat petrochemical effluents was studied. This work was conducted at the largest petrochemical membrane bioreactor (MBR) plant in the world, which is located in Porto-Marghera (Venice). The treated effluent is discharged in the lagoon of Venice and needs to satisfy strict limits. To optimize MBR operation a pilot scale MBR was set-up that received the same petrochemical effluents as the full-scale. Five experimental runs were carried out aiming initially to reproduce the conditions of the full scale MBR. Then, changes were introduced, which included the addition of greater amount of external carbon source, the reduction of the anoxic compartment volume, changes in configuration and in influent load. In the predenitrification configurations, ammonification was not effective. Nitrification was effective with the ammonium concentration in the permeate being lower than 0.5 mg NH4-N L-1. The reduction of the anoxic reactor volume and the abolition of internal recycling resulted in a decrease of denitrification. Variable removal of heavy metals/metalloids was obtained with B, Ba, Al, Ni, Se and Zn removed at <30%, Pb, Hg, Cu, Ag, Cr and Co at 40-70% and Fe >70 %. The MBR was able to safeguard the effluent quality for petrochemical effluents. Keywords: petrochemical effluents, membrane bioreactor, heavy metals, nitrification/denitrification Introduction Petrochemical refinery industries result in the production of significant quantities of wastewater from several processes including desalting, vacuum distillation, hydrocracking, catalytic cracking, catalytic reforming, alkylation etc [1, 2]. Petrochemical wastewater is usually characterized by significant concentrations of suspended solids, chemical oxygen demand (COD), oil and grease, sulphide, ammonia, phenols, hydrocarbons, benzene, toluene, ethylbenzene, xylene and polycyclic aromatic hydrocarbons (PAHs) [3,4]. The conventional processes that are applied for the treatment of petrochemical wastewater can only partially remove the contaminants. Often, the existing regulations governing the reuse and/or discharge of petrochemical effluents require the adoption of advanced treatment techniques including membrane processes [5]. The application of membrane bioreactors (MBRs) is widely recognized as an effective option for enhanced wastewater treatment in the industrial and urban sectors [6]. Among the best currently available techniques for wastewater treatment and reuse, MBRs are important because of their rapidly improving cost/benefit ratio [7, 8]. A membrane sequencing batch bioreactor (MSBR) was employed by Shariati et al. [9] to treat synthetic petroleum refinery wastewater resulting in high (>97%) removal of aliphatic and aromatic hydrocarbons. In the study of Rahman and AlMalack [10] a cross-flow MBR was used to treat refinery wastewater accomplishing total organic carbon (TOC) and ammonia concentrations in the permeate of 10.4-31.3 mgL-1 and 0.21-21.3 mgL-1 respectively. MBR processes retain particulate and colloidal matter, including macromolecular substances larger than the absolute pore size of the membranes. Thus, metals that are bound-adsorbed to activated sludge are effectively removed by the MBR process. Some research studies identify a ‘small’ superiority of MBR over conventional activated sludge (CAS) processes for removing heavy metals from domestic effluents. Santos and Judd [11] summarize the findings of various studies comparing the performance of MBR and CAS for the removal of heavy metals from municipal wastewater and conclude that MBR marginally achieve higher metal removal than CAS (64-92% instead of 51-87%). Similarly, Bolzonella et al. [12] found that MBR improve heavy metal removal by 10-15% due to the more efficient retention of suspended solids and the layer effect. 1 In parallel, the removal of volatile organic compounds (VOCs) from wastewater with the use of MBR has received limited attention. Min and Ergas [13] examined the volatilization and biodegradation rates for acetaldehyde, butyraldehyde and vinyl acetate in an MBR for varying organic loading rates and found that the overall removal of the three VOCs was higher than 99.7% for the examined loading rates. Fatone et al. [14] studied the occurrence, removal and fate of 16 PAHs and 23 VOCs in Italian municipal wastewater treatment systems consisting both of CAS and MBR. MBR enhanced the biodegradation of PAHs, since their concentration decreased in the mixed liquor with increasing sludge age. The full scale MBR of Porto-Marghera demonstrated to be the best available technique for petrochemical wastewater treatment. The plant receives wastewater from different petrochemical and chemical industries and it was upgraded to an MBR in order to meet the strict legislation governing the effluents discharged into the Lagoon of Venice [15]. High flexibility is a major skill required to the MBR technology, which must cope to drastic variations of the pollutant loads and types. In this work, a pilot scale MBR was operated at different conditions aiming to optimize its performance and provide feedback from the world’s largest MBR plant treating petrochemical wastewater, located in Porto Marghera, Venice. The study focused on selected VOCs, PAHs, heavy metals and metalloids removal, as well as COD and nitrogen removal. Materials and Methods Location of activities The full-scale MBR plant of Porto-Marghera (Figure 1) receives wastewater from different chemical and petrochemical industries, which are active in the area. It was upgraded to an MBR in order to meet the strict legislation governing the effluents discharged into the Lagoon of Venice [15]. The lagoon receives municipal and industrial effluents and strict limits have been set for specific substances that are contained in the discharged effluents. All effluent streams were equalized in tanks and the wastewater was then fed for clariflocculation where ferrous sulphate was dosed, while spent caustic soda from the nearby cracking plant was used to control the pH. After the physicochemical treatment the effluents were fed to the pilot and full scale MBRs. Figure 1. Location of the physicochemical unit, the pilot and the full scale MBR The pilot scale MBR was operated for 2 years and received the same industrial effluents as the full scale MBR. The pilot-scale MBR had a working volume of 4.24 m3 (aerobic compartment: 2.20 m3, anoxic compartment: 1.46 m3, membrane module compartment: 0.58 m3). The membrane module was supplied by GE Water and Process Technologies (ZeeWeed 230) and consisted of hollow fibers. The membranes had a nominal pore size of 0.04 μm and were made of polyvinylidene fluoride (PVDF). The membrane surface area was 21.7 m 2. The permeate flux ranged between 10 and 18 L m-2h-1. The system operated with the solids retention time (SRT) varying from 50 to 90 d and hydraulic retention time (HRT) varying from 10.7 to 21.5 h, depending on the run. Table 1 summarizes the operating characteristics of the 5 experimental periods that were conducted. 2 Table 1. Operating characteristics of the pilot MBR operation during the five experimental periods Parameter 1st period 2nd period 3rd period 4th period 5th period Time of operation (d) 142 91 62 50 50 HRT (h) 18.3 15.8 15.3 21.5 10.7 SRT (d) 90 90 90 70 50 Qinfluent (m3 d-1) 5.5 6.4 6.6 4.7 9.4 rsludge 2.6 2.0 2.2 2.2 1.7 rinternal 0.8 0.74 0.73 MLSSaerobic (g L-1) 3.7 3.0 3.6 3.9 4.8 (MLVSS/MLSS)aerobic (%) 72 78 72 78 75 F/M [kg COD / (kgVSS·d)] 0.048 0.042 0.109 0.086 0.11 rsludge: recycled sludge, rinternal: internally recycled sludge, MLSS: mixed liquor suspended solids, MLVSS: mixed liquor volatile suspended solids, F/M: food to microorganisms ratio, VSS: volatile suspended solids. MBR configurations Five experimental periods were performed to test the pilot scale MBR under different operating conditions and to optimize its performance. In the beginning, the reactor was inoculated with activated sludge from the fullscale MBR. This way, valuable feedback for the full scale plant can be provided. The operating characteristics of all five periods are presented in Table 1. Influent wastewater had received physicochemical treatment for the removal of suspended and colloidal material, which was enhanced by the addition of ferrous sulphate. In the 1st period (Figure 2a) the operating conditions of the full scale MBR were simulated, since the influent wastewater was fed into the anoxic reactor and pre-denitrification took place. A second anoxic reactor received the external recirculation of the mixed liquor from the membrane tank and the internal recirculation flow from the aerobic reactor. In the 2nd period (Figure 2b) the wastewater was fed to the aerobic reactor and the configuration was altered to nitrification, post-denitrification. The main purpose was to decrease the endogenous decay of heterotrophic biomass in the aerobic reactor and increase the fraction of active biomass within the activated sludge. In this period, the usual practice of adding an external carbon source to the denitrification zone was not followed in order to reduce the operating expenses. Moreover, the inflow rate increased by 35% and thus the HRT decreased by the same percent. In the 3rd period (Figure 2c) acetic acid was added to the aerobic reactor as an external carbon source to promote the heterotrophic biomass growth, while influent wastewater was introduced to the anoxic tank, as in the 1st period. Both the anoxic and the aerobic reactors received readily biodegradable organic matter to increase to increase the fraction of heterotrophic biomass growth in the aerobic reactor with respect to that of the 1st period and to achieve a higher denitrification rate than that of the 2 nd period. Thus, the main goal of the 2nd period was to resolve the main deficiencies observed during the first two periods. Figure 2. Configurations applied in the pilot scale MBR During the 4th and 5th period (Figure 2d) one of the two anoxic tanks and the internal recirculation were abolished to test the system with lower anoxic reactor volumes and lower energy requirements. The configuration of the 4th period was maintained in the 5th period, with the difference that the influent flow rate and thus the organic and nitrogen load were doubled. This way we simulated the conditions of the full-scale 3 MBR when only one of the two existing lines was used. In all five periods acetic acid was dosed together with the petrochemical wastewater to both the pilot and the full scale MBR. In the 3 rd period higher concentration of acetic acid than the one dosed to the full scale MBR was practiced. Sampling and analytical methods The samples were collected in the two year operation of the pilot-scale MBR. The sludge samples were collected from the aerobic and anoxic reactors. Samples of influent wastewater and permeate were collected by two peristaltic pumps automatically timed to sample a liquid aliquot at 3 min h-1 and obtain a daily composite sample. All samples were stored in plastic bottles and were kept at 4oC prior to analysis. The samples from the suspended activated sludge (SAS) and the clogging sludge (CS) were taken within a 6-month time period following the operation of the MBR for 1 year. The membrane module was periodically lifted from the membrane tank and the clogging sludge was collected from 3 different zones over the length of the membrane. A homogeneous and composite sample was then collected for the determination of metals/metalloids. The analyses were conducted at a maximum of 1 day following the collection time. The parameters of pH, alkalinity, total suspended solids (TSS), volatile suspended solids (VSS), chemical oxygen demand (COD), ammonium nitrogen (NH4 –N) and total Kjeldahl nitrogen (TKN) were measured according to standard methods [16]. Moreover, nitrate nitrogen (NO3–N), nitrite nitrogen (NO2–N), orthophosphate–P (PO4–P), fluoride (F-), sulphate (SO42-) were determined using ionic chromatography (ICS-900 Thermo Scientific). Organic nitrogen (Norg) was determined from the difference of TKN minus the NH4–N concentration. MLSS and mixed liquor volatile suspended solids (MLVSS) were determined in sludge according to standard methods [16]. Be, B, Al, V, Cr, Mn, Co, Ni, Cu, Zn, Mo, Ag, Cd, Sn, Te, Ba, Tl, Pb, As, Se and Sb were determined using the EPA method EPA200.8/94; Fe was determined according to APAT IRSA-CNR 29/2003 3020[15]; Al was determined according to IRSA Q100/94-3110. The metals/metalloids were determined using inductively coupled plasma-mass spectrometry (ICP-MS). PAHs and BTEX were measured by gas chromatography mass spectrometry (GC-MS) using an HP 6890 Plus gas chromatograph (Hewlett-Packard, Palo Alto, CA) coupled with a Micromass Autospec Ultima mass spectrometer (Waters, Framingham, Mass) following the U.S. EPA methods (EPA 8270C/96 and EPA 8260B/96). Results and Discussion Petrochemical wastewater characteristics Table 2 shows the characteristics of the wastewater that was fed to the MBR for the 5 periods. The wastewater stream is characterized by low total and ammonium nitrogen, low phosphorus concentrations and micropollutants and low COD. These characteristics do not favour the biological processes [3, 17, 18], while ammonification is an important process for nitrogen removal, since the concentrations of organic nitrogen are much higher than that of ammonium nitrogen. Table 2. Physicochemical characteristics of petrochemical wastewater fed to MBR Periods Parameter 1st 2nd 3rd 4th 5th pH 9.4 ± 0.4 8.7 ± 0.4 8.5 ± 0.4 9.3 ± 0.5 9.0 ± 0.4 TSS (mgL-1) 36.4 ± 29.7 31.5 ± 29.6 29.9 ± 22.8 31.3 ± 18.9 39.8 ± 25.1 COD (mgL-1) 108.0 ± 19.7 74.1 ± 31.5 195.8a ± 22.1 101.7 ± 28.1 222.7 ± 27.1 NH4-N (mgL-1) 4.7 ± 2.6 3.7 ± 1.3 4.4 ± 1.5 5.6 ± 2.0 5.0 ± 2.2 TKN (mgL-1) 9.8 ± 3.3 11.8 ± 3.8 16.9 ± 7.6 10.0 ± 1.6 17.4 ± 2.9 NO2-N (mgL-1) 0.02 ± 0.05 0.50 ± 0.41 0.32 ± 0.25 0.68 ± 0.39 0.39 ± 0.30 NO3-N (mgL-1) 0.08 ± 0.02 0.13 ± 0.25 0.03 ± 0.07 1.62 ± 1.34 2.11 ± 1.64 PO4-P (mgL-1) 0.1 ± 0.2 0.1 ± 0.1 0.1 ± 0.1 0.2 ± 0.2 0.4 ± 0.1 SO42- (mgL-1) 452 ± 166 235 ± 31 250 ± 40 123 ± 4 169 ± 45 The petrochemical wastewater characteristics were variable and so was the biodegradable fraction of total COD. Acetic acid was always added (from 90 Lh-1 to 200 Lh-1 corresponding to influent COD concentrations of 88–40 mgL-1) to increase the organic loading to the minimum possible F/M. Total nitrogen was higher in the 3rd and 5th period compared to the other periods. Over the last five years, several industries in the petrochemical area of 4 Porto-Marghera were shut down or subjected to temporary and irregular cessation runs, introducing drastic variability in influent loads and resulting in a reduction of the organic strength of petrochemical effluents. As a result, the full scale MBR received much lower and fluctuating concentrations of organic matter and nutrients compared to previous, years as well as to the design treatment potential. Performance of biological processes The MBR permeate characteristics are given in Table 3, while a comparison is made with the existing limits concerning the discharge of effluents into the lagoon of Venice. Table 3. Physicochemical characteristics of the treated MBR effluent Parameter TSS (mgL-1) COD (mgL-1) TN (mgL-1) TKN (mgL-1) NH4-N (mgL-1) NO2-N (mgL-1) NO3-N (mgL-1) PO4-P (mgL-1) SO42- (mgL-1) 1st < 0.1 23.1 ± 5.2 3.30 ± 1.17 2.4 ± 2.5 0.16 ± 0.37 0.11 ± 0.01 0.94 ± 0.56 0.13 ± 0.07 436 ±182 Period (mean value ± standard deviation) 2nd 3rd 4th 5th < 0.1 < 0.1 < 0.1 < 0.1 23.0 ± 7.1 26.9 ± 8.1 14.9 ± 8.1 29.3 ± 6.0 10.97 ± 3.27 5.91 ± 4.90 4.86 ± 2.52 6.37 ± 2.86 1.7 ± 1.8 5.0 ± 4.7 2.9 ± 2.0 4.6 ± 2.6 0.09 ± 0.15 0.10 ± 0.01 0.31 ± 0.17 0.10 ± 0.08 0.04 ± 0.08 0.08 ± 0.19 0.02 ± 0.01 <0.01 8.99 ± 2.81 0.95 ± 0.81 1.71 ± 1.30 2.12 ± 1.18 0.03 ± 0.10 0.01 ± 0.06 0.20 ± 0.10 0.10 ± 0.20 246 ± 20.1 261 ± 32 129 ± 24 223 ± 31 Limits 35 120 10 2 0.3 0.5 500 The permeate meets the limits for all the examined parameters except sulphates, which were sometimes above the limit. In period 2, high NO3-N concentrations in the permeate were observed, while during the 3 rd and 5th period, a variation in the TKN concentrations of the permeate was obtained. The ammonium concentration of the permeate was very low (usually <0.5 mg L-1), showing that the oxidation of ammonium to nitrate was effective. The higher NH4–N content of the treated effluent in the beginning of the 4th and 5th period is most likely attributed to some peaks of nitrogen loading and/or to temporary and irregular inhibitory effects caused by influent wastewater. Since the NH4-N concentration of the influent was low, the ammonification of soluble organic nitrogen can be considered an important process in order to provide sufficient ammonium for nitrification. Ammonification was not effective in all periods except the 2nd, since the average organic nitrogen removal ranged from 29-60%. The nature of the petrochemical wastewater seems to inhibit to some level the biological conversion of organic nitrogen to ammonium nitrogen. In the 2 nd period, ammonification was much higher than all the other periods, probably due to the longer shutdown of the production of acrylic fibres. The nitrification post-denitrification configuration was not coupled with external carbon source in the anoxic reactor. These conditions were applied to examine whether autotrophic denitrification via-sulphide occurs. The latter process is favoured under limiting organic carbon and in the presence of significant sulphide concentrations, which are common in petrochemical wastewater [19]. Although these favourable conditions were observed in the 2nd period, autotrophic denitrification did not seem to occur probably due to sulphide oxidation in the aerobic reactor. Thus, the alternation to the nitrification, post-denitrification configuration without any external carbon source addition to the anoxic reactor resulted in very low denitrification. However, the average nitrogen concentration of the treated effluent was close to the limit of 10 mgL-1, showing that this configuration can be a viable solution. During the 3rd period the average nitrogen removal was similar to the one obtained during period 1. However, the fluctuation was larger with occasionally very low nitrogen removal (<30%). This can be attributed to inhibitory compounds contained in petrochemical wastewater. Denitrification was adversely affected by the high dissolved oxygen (DO) concentration of the mixed liquor that was recycled from the membrane tank (DO>6 mgL-1) and from the aerobic reactor (DO~4 mgL-1). As a result, in the first three periods, the first anoxic compartment was partly operated as an aerobic reactor to deoxygenate the recycled sludge. In the last two periods the internal recirculation was abolished in an effort to mitigate this problem. Moreover, in the 5th period, the HRT was decreased by 50% by doubling the influent flow rate (compared to the 4th period), while the influent nitrogen concentration was higher than that of 1 st and 4th periods. Therefore, in periods 4 and 5, despite the reduction of the anoxic compartment volume by 20% and the abolition of internal recirculation, the nitrogen removal was only slightly lower compared to period 1. Nitrification was effective in all periods. 5 Efficiency (%) The COD concentration of influent wastewater was low, particularly in the 1 st, 2nd and 4th period. The latter can explain the moderate COD removal efficiency (on average 69-86% for all periods). The addition of acetic acid did not result in any significant change in the permeate COD. In the 4 th period, the lower permeate COD is probably related to the inflow characteristics, with the soluble non biodegradable COD from industrial discharges being lower. In the 5th period, higher fluctuation of the permeate COD concentration was observed due to the higher influent loads introduced to the system. The MBR performance was evaluated under transient conditions (i.e. shift between the different multi-zone schemes). The permeate quality was not significantly affected by sudden variations of the treatment scheme. Consequently, the MBR ensured high treated effluent quality with respect to COD at all times. Figure 3 summarizes the nitrification and denitrification removal efficiencies for the examined periods. The lowest nitrification efficiency was obtained in the 4 th period and is probably attributed to the toxic action of petrochemical wastewater substances and/or to some peak loading of nitrogen. The variation in nitrification efficiency that was observed is mainly attributed to the low influent ammonium nitrogen concentration rather than the low process performance. The denitrification was negligible during the 2nd period, since external carbon source was not dosed to the anoxic reactor. 120 100 80 60 40 20 0 Nitrification 1st Denitrification 2nd 3rd 4th 5th Period Figure 3. Nitrification and denitrification efficiency Organic and inorganic micropollutants removal Table 4. Long-term metal occurrence and removal of metals/metalloids in the MBR pilot plant (number of samples = 95 collected over one year, 8 per month) Frequency of Influent concentration (aver. ± Removal Metal/Metalloid occurrence (%) var. coef.) (μgL-1 ± %) (aver. ± var. coef.) (% ± %) Al 100 74.90 ± 77.3 27.0 ± 32.6 Ag 5 0.27 ± 27.0 54.5 ± 6.5 As 91 2.38 ± 36.2 18.8 ± 25.6 Ba 100 20.12 ± 55.5 20.2 ± 26.7 Be 0 <0.50 ± 0.0 B 100 302.07 ± 68.9 17.2 ± 26.7 Cd 0 <0.50 ± 0.0 Co 21 0.33 ± 51.6 40.1 ± 32.3 Cr 98 11.81 ± 71.3 62.3 ± 32.4 Cr(VI) 0 <1 Cu 94 4.25 ± 87.8 41.4 ± 31.8 Fe 100 889.44 ± 61.6 85.0 ± 14.3 Hg 79 0.23 ± 58.2 52.1 ± 29.1 Mn 100 22.50 ± 55.8 66.3 ± 26.0 Mo 100 8.70 ± 34.8 13.6 ± 22.8 Ni 97 4.37 ± 72.1 25.0 ± 30.2 Pb 97 2.25 ± 110 45.4 ± 37.1 Sb 21 0.62 ± 38.9 38.1 ± 32.9 Se 56 4.28 ± 51.1 9.2 ± 23.1 Sn 72 1.54 ± 75.1 42.3 ± 31.2 Tl 0 <0.50 ± 0.0 Te 0 <0.50 ± 0.0 V 98 4.08 ± 82.5 31.3 ± 28.8 Zn 99 33.53 ± 77.1 28.2 ± 32.6 6 The removal of heavy metals/metalloids, polycyclic aromatic hydrocarbons (PAHs) and benzene, toluene, ethylbenzene and xylene (BTEX) from the clariflocculation unit and the MBR was investigated. Table 4 shows the metals/metalloids concentrations after the clariflocculation unit and the removal achieved by the pilot MBR. The metals/metalloids after flocculation-clarification were in the range of 0.1-100 µgL-1, which is similar to the levels that usually occur in municipal wastewater treatment plants. The petrochemical effluent fed to the MBR was characterized by significant Zn, Fe and Al concentrations, while Cr, Pb, Ni, Cu, Se and As were present at levels below than that of typical municipal wastewater, on average lower than 12 µgL-1 over the year. Co, Ag and Sb had frequencies of occurrence below 50%; Be, Cr(VI), Cd, Tl and Te were always under the limit of quantification. The average removals of metals/metalloids by MBR were as follows: < 30% for B, Ba, Al, Ni, Se and Zn 40-70% for Pb, Hg, Cu, Ag, Cr and Co >70 % for Fe Figure 4 shows the arsenic, lead, mercury and cadmium concentrations of the influent petrochemical wastewater that is fed to the clariflocculation unit, of the effluent fed to the MBR unit and of the MBR permeate. The clariflocculation unit resulted in significant removal of arsenic, while the MBR resulted in very poor arsenic removal. a b c d e f Figure 4. (a)Arsenic, (b) lead, (c) cadmium, (d) mercury, (e) PAHs and (f) BTEX concentrations in influent wastewater, the effluent fed to the MBR and the MBR permeate (A405=influent to clariflocculation, A413=influent to MBR, SM22= MBR permeate) The low removal of As is mainly related to its chemical forms: both arsenate, As(V), and arsenite, As(III) are soluble and negatively charged, so they do not react with binding sites in the activated sludge. The lead decreased to very low concentrations by the clariflocculation process (< 4μgL-1) and the MBR further reduced the lead concentration. The cadmium concentration was always below the limit of quantification of 0.5 μgL-1. The mercury concentration of petrochemical effluents was low (0.23 μgL-1) and the MBR process reduced it to the level of 0.1 μgL-1. The MBR permeate had Pb, Cd and Hg and PAHs concentrations that were consistently below the very strict limits of 10 μgL-1, 1 μgL-1, 0.5 μgL-1 and 1 μgL-1 respectively, set for the discharge of the treated effluent in the Lagoon of Venice. Only the arsenic concentration exceeded the limit of 1 μgL-1 as the 7 permeate concentration was usually around 1.5-3 μgL-1. PAHs were effectively removed in the physicochemical stage as they are associated to particulate and colloidal matter. The sum of the PAHs entering the MBR was almost always lower than 100 ngL -1. The BTEX was effectively removed by the MBR mainly through the process of volatilization, with the permeate having a BTEX concentration of 1-2 μgL-1. The coarse bubble aeration in the membrane tank enhanced the volatilization of such compounds. Metals/metalloids accumulation The accumulation of metals/metalloids in the suspended activated sludge (SAS) and in the clogging sludge (CS) was also examined. Despite the fact that coarse bubble aeration was employed to minimize membrane fouling, CS was observed to accumulate within the membrane fibres (Figure 5). Figure 5. View of the clogging sludge (CS) (a) in the membrane module and (b) from the aerobic and the anaerobic lay-zone Table 5. Metal concentration in wastewater entering the MBR, in the SAS and in the CS Metal / Metalloid Fe Al Zn Cr Mn Cu Ni Pb B Ba V Sn Se Sb Mo Ag As Co Cd CS anaerobic CS aerobic SAS lay-zone lay-zone (mg(kgTS)-1) -1 -1 (mg(kgTS) ) (mg(kgTS) ) 38258 54932 17990 1391 933 2543 715.2 627.5 121.0 265.3 271.5 281.0 184.1 421.2 350.5 83.4 72.7 69.0 58.8 71.7 18.0 24.6 21.8 21.0 119 213.4 125.0 34.7 46.3 33.0 16 24.1 34.0 8.8 11.8 78 6.8 5.7 2.8 1.4 1.7 0.6 10.2 19 2.9 2.1 3.5 3.0 7.9 9.4 1.0 3.5 4.1 2.5 2.2 1.5 <0.01 Metals accumulation in CS anaerobic lay-zone (%) Metals accumulation in CS aerobic lay-zone (%) 113 -45 491 -6 -48 21 227 17 -5 5 -53 -89 143 133 252 -30 690 40 >219 205 -63 419 -3 20 5 298 4 71 40 -29 -85 104 183 555 17* 840 64 >149 The CS was classified as aerobic and anaerobic depending on whether it was collected from the outer (i.e. aerobic) or the inner part of the membrane module. As seen in Figure 5, the appearance of CS in the aerobic lay zone was essentially different from the CS in the anaerobic lay-zone as different redox conditions were experienced in the low lay-zones. The concentration of COD, N, P, extracellular polymeric substances (EPScarbohydrate, EPSprotein) and soluble microbial products (SMP protein) were higher in the CS than in SAS. This shows the important role of CS in the removal of colloidal and soluble compounds. Regarding the effect of 8 anaerobic and aerobic conditions on CS, major influences on the COD, TKN or P contents were not observed. Heavy metals in the CS were found in the following descending order: Fe>Al>Zn>Cr>Cu>Ni>Pb>As>Se>Cd. As seen in Table 5 specific metals/metalloids were found to accumulate much more in CS than in SAS, following the order As>Zn>Ni>Cd>Sb>Fe>Se. This was probably attributed to the synergistic effect of extracellular polymeric compounds and metal-resistant bacteria. Additionally, oxidative (aerobic) conditions had a minor positive influence on metal bio-precipitation. Several researchers have linked the increased content of EPS to the enhanced metal-binding potential of the biofilm [20, 21]. Acknowledgments The authors would like to acknowledge the Servizi Porto-Marghera Scarl for hosting the pilot scale MBR at their premises and for the fund that the company provided. BODOSSAKI Foundation of Greece is acknowledged for supporting the research. Conclusion The MBR coupled to the physicochemical pre-treatment step demonstrated to safeguard the effluent quality for petrochemical effluents. Only the arsenic concentration exceeded the very strict limit of 1 μgL-1. Nitrification was effective with the ammonium concentration in the permeate being consistently lower than 0.5 mg NH4-N L1 . The reduction of the anoxic reactor volume and the abolition of internal recycling resulted in a decrease of denitrification. The reduction of the anoxic reactor volume and the abolition of internal recycling resulted in a decrease of denitrification. The performance of the MBR with respect to metals/metalloids removal was variable since B, Ba, Al, Ni, Se and Zn were poorly removed (<30%), Pb, Hg, Cu, Ag, Cr and Co were removed at 4070% and Fe at >70 %. The PAHs were effectively removed by the clariflocculation unit and BTEX were removed by the MBR to the level of 1-2 μgL-1 mainly due to volatilization. Specific metals/metalloids were found to accumulate much more in clogging sludge than in the suspended activated sludge, following the order As>Zn>Ni>Cd>Sb>Fe>Se. References [1] M. Al Zarooni, W. Elshorbagy, Characterization and assessment of Al Ruwais refinery wastewater, J. Hazard. Mater., A136 (2006) 398-405. [2] A. Coelho, A.V. Castro, M. Dezotti, G.L. Sant’Anna Jr., Treatment of petroleum refinery sourwater by advanced oxidation processes, J. Hazard. Mater., B137 (2006) 178-184. [3] M. Tobiszewski, S. Tsakovski, V. Simeonov, J. Namieśnik, Chlorinated solvents in a petrochemical wastewater treatment plant: An assessment of their removal using self-organising maps, Chemosphere, 87 (2012) 962-968. [4] G. Pérez, A.R. Fernández-Alba, A.M. Urtiaga, I. Ortiz, Electro-oxidation of reverse osmosis concentrates generated in tertiary water treatment, Water Res., 44 (2010) 2763-2772. [5] M.T. Ravanchi, T. Kaghazchi, A. Kargari, Application of membrane separation processes in petrochemical industry: a review, Desalination, 235 (2009) 199-244. [6] H. Lin, W. Gao, F. Meng, B.-Q. Liao, K.-T. Leung, L. Zhao, J. Chen, H. Hong, Membrane bioreactors for industrial wastewater treatment: A critical review, Crit. Rev. Environ. Sci. Technol., 42 (2012) 677-740. [7] P. Coté, M. Masini, D. Mourato, Comparison of membrane options for water reuse and reclamation, Desalination, 167 (2004) 1-11. [8] S. Judd, The MBR Book: Principles and applications of Membrane bioreactors in water and wastewater treatment, Elsevier, Oxford, 2006. [9] S.R.P. Shariati, B. Bonakdarpour, N. Zare, F.Z. Ashtiani, The effect of hydraulic retention time on the performance and fouling characteristics of membrane sequencing batch reactors used for the treatment of synthetic petroleum refinery wastewater, Bioresour. Technol., 102 (2011) 7692-7699. [10] M.M. Rahman, M.H. Al-Malack, Performance of a crossflow membrane bioreactor (CF-MBR) when treating refinery wastewater, Desalination, 191 (2006) 16-26. [11] Santos, S. Judd, The fate of metals in wastewater treated by the activated sludge process and membrane bioreactors: A brief review, J. Environ. Monit., 12 (2010) 110-118. [12] D. Bolzonella, F. Fatone, S. Di Fabio, F. Cecchi, Application of membrane bioreactor technology for wastewater treatment and reuse in the Mediterranean region: Focusing on removal efficiency of nonconventional pollutants, J. Environ. Manag., 91 (2010) 2424-2431. 9 [13] K. Min, S. Ergas, Volatilization and biodegradation of VOCs in membrane bioreactors (MBR), Water Air Soil Pollut., 6 (2006) 83-96. [14] F. Fatone, M. Dante, E. Nota, S. Di Fabio, N. Frison, P. Pavan, Biological Short-Cut Nitrogen Removal from Anaerobic Digestate in a Demonstration Sequencing Batch Reactor, Chem. Eng. Trans., 24 (2011) 11351140. [15] S. Cattaneo, F. Marciano, L. Masotti, G. Vecchiato, P. Verlicchi, C. Zaffaroni, Improvement in the removal of micropollutants at Porto Marghera industrial wastewaters treatment plant by MBR technology, Water Sci. Technol., 58 (2008) 1789-1796. [16] APHA AWWA WEF, Standard methods for the examination of water and wastewater, 20 ed., American Public Health Association, American Water Works Association, Water Environment Federation, Washington, DC, 1998. [17] T.-H. Khaing, J. Li, Y. Li, N. Wai, F.-S. Wong, Feasibility study on petrochemical wastewater treatment and reuse using a novel submerged membrane distillation bioreactor, Sep. Purif. Technol., 74 (2010) 138-143. [18] T. Ma, C. Zhao, Y. Peng, X. Liu, L. Zhou, Applying real-time control for realization and stabilization of shortcut nitrification-denitrification in domestic water treatment, Water Sci. Technol., 59 (2009) 787-796. [19] E. Vaiopoulou, P. Melidis, A. Aivasidis, Sulfide removal in wastewater from petrochemical industries by autotrophic denitrification, Water Res., 39 (2005) 4101-4109. [20] N.K. Srivastava, C.B. Majumder, Srivastava NK, Majumder CB, J. Hazard. Mater., 151 (2008) 1-8. [21] Hammaini, F. González, A. Ballester, M.L. Blázquez, J.A. Muñoz, Biosorption of heavy metals by activated sludge and their desorption characteristics, J. Environ. Manag., 84 (2007) 419-426. 10
© Copyright 2026