
Mapping Genes through the Use of Linkage Disequilibrium
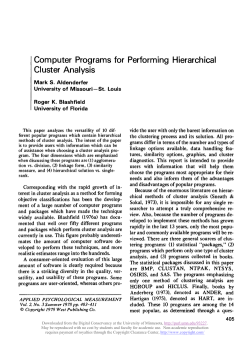
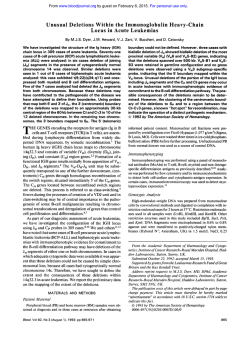
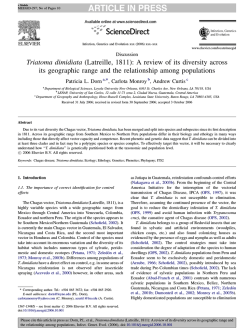
Original Paper
Hum Hered 1998;48:138–154
Joseph D. Terwilliger a, b
Sebastian Zöllner c
Maris Laan c
Svante Pääbo c
a
b
c
Department of Psychiatry and
Columbia Genome Center,
Columbia University and
Department of Neuroscience,
New York State Psychiatric
Institute, New York., N.Y., USA;
Institute of Zoology, University of
Munich, Germany
OOOOOOOOOOOOOOOOOOOOOOOOOOOOOOOOOOOOO
Key Words
Genetic drift
Linkage disequilibrium
Demographic history
Population isolate
Complex disease
Population structure
Saami
Finns
Received: October 24, 1997
Revision received: November 13, 1997
Accepted: November 15, 1997
Mapping Genes through the Use of
Linkage Disequilibrium Generated by
Genetic Drift: ‘Drift Mapping’ in Small
Populations with No Demographic
Expansion
OOOOOOOOOOOOOOOOOOOOOOOOOOOOOOOOOOOOOOOOOOOOOOOOOOOOOOOOOOOOOOOOOOOOOOOOOOOOOO
Abstract
Linkage disequilibrium has been a powerful tool in identifying
rare disease alleles in human populations. To date, most
research has been directed to isolated populations which have
undergone a bottleneck followed by rapid exponential expansion. While this strategy works well for rare diseases in which
all disease alleles in the population today are clonal copies of
some common ancestral allele, for common disease genes with
substantial allelic heterogeneity, this approach is not predicted
to work. In this paper, we describe the dynamics of linkage
disequilibrium in populations which have not undergone a
demographic expansion. In these populations, it is shown that
genetic drift creates disequilibrium over time, while in expanded populations, the disequilibrium decays with time. We
propose that common disease alleles might be more efficiently
identified by drift mapping – linkage disequilibrium mapping
in small, old populations of constant size where the disequilibrium is the result of genetic drift, not founder effect. Theoretical models, empirical data, and simulated population models
are presented as evidence for the utility of this approach.
OOOOOOOOOOOOOOOOO
Introduction
While population geneticists study the dynamics of linkage disequilibrium in populations, genetic epidemiologists and gene map-
ABC
© 1998 S. Karger AG, Basel
0001–5652/98/0483–0138$15.00/0
Fax + 41 61 306 12 34
E-Mail [email protected]
www.karger.com
This article is also accessible online at:
http://BioMedNet.com/karger
pers use linkage disequilibrium as a tool to
localize genetic factors involved in the etiology of diseases. Here, we outline an intuitive
description of the various evolutionary forces
which create and dissolve linkage disequilib-
Joseph D. Terwilliger, PhD
Department of Psychiatry, Columbia University
60 Haven Avenue -#15C
New York, NY 10032 (USA)
E-Mail [email protected]
Let us assume that at some arbitrary point
in time, we can stratify a gene of interest into
two classes of alleles, ‘D’ = the population of
alleles which predispose to a phenotype of
interest (e.g. disease), and ‘+’ = the population
of alleles at this locus which do not increase
the probability of expressing said phenotype.
Within the ‘+’ class will be found the ‘wildtype’ form of this gene, and all of its polymorphisms which are phenotypically silent relative to our trait of interest, while the ‘D’ class
contains all variants of the gene which increase the probability of expressing the phenotype. For example, in the BRCA1 gene
there are hundreds of mutations with predisposing effects on breast cancer [1] – in this
analysis those are considered as one ‘D’ class
of alleles, while in many diseases of the Finnish disease heritage [2, 3] there may be only
one unique ancestral allele in this ‘D’ class.
For marker loci located so closely to the
disease locus that the recombination fraction
between the disease and marker loci is effectively 0, the population of chromosomes in
the ‘D’ class will evolve independently of the
population of chromosomes in the ‘+’ class.
This is true because without recombination,
there is no opportunity for exchange of genetic material between the ‘D’ and ‘+’ chromosomes. Thus, whereas the two populations of
chromosomal regions carrying the ‘D’ and ‘+’
alleles evolve independently of one another
(see fig. 1a), other unlinked parts of the genome evolve as one large population. Over
time, this can lead to substantial differences
in marker allele frequency distributions between the ‘D’ and ‘+’ populations for markers
in a neighborhood around the disease locus,
even if there were no differences in the beginning. Our model demonstrates that linkage
disequilibrium can exist even when the ‘basic
assumption of linkage disequilibrium mapping – that a significant fraction of today’s
disease chromosomes derive from a common
ancestor’ [4] is violated, in that no linkage disequilibrium or single common ancestor need
exist initially, for linkage disequilibrium to be
generated over time.
The phenomenon of genetic drift generating linkage disequilibrium between neutral
loci has been studied extensively, going back
to seminal work of Hill and Robertson [5],
and the analogy to subdivided populations of
chromosomes provides an intuitive framework for studying the effects of drift in generating linkage disequilibrium, in the context of
the more extensively studied problem of allele
frequency variation between subdivided populations [6]. The dynamics of change in allele
frequency due to genetic drift are mainly a
function of population size. When the size of
the ‘D’ population is substantially smaller
than that of the ‘+’ population, as will typically be the case, genetic drift will cause a more
Drift Mapping in Population Isolates
Hum Hered 1998;48:138–154
rium – using analogies to subdivided populations with migration. We furthermore discuss
how linkage disequilibrium, which has been
generated by genetic drift in populations that
have been of constant size over longer time
periods, might be useful to find genes involved in common genetic diseases and discuss data from some populations of different
demographic histories as well as some simulations to illustrate this prediction. In this context, we also demonstrate that for linkage disequilibrium mapping to work, one need not
assume that a single ancestral mutation is
responsible for a large proportion of disease
cases in a present-day population, since genetic drift can create linkage disequilibrium
around disease loci in the absence of such
founder effects.
The Evolution of Disease Loci and
Surrounding Chromosomal Regions as
‘Population Subdivision’
139
b
c
a
Fig. 1. a Absent recombination and mutation, the
population of chromosomes with a ‘D’ allele (size ‘ND’)
evolves independently of the population of chromosomes with a ‘+’ allele (size N+), while other chromosomes, on which the disease locus does not reside,
evolve in concert as one large population of size ND +
N+. b Effects of recombination fraction, , in gene flow
model of linkage disequilibrium. c Mutation at the disease locus as unidirectional gene flow from the ‘+’ population to the ‘D’ population. Mutation rate from ‘+’ to
‘D’ is here considered to be equal to some small quantity Ì. d Population admixture/migration and its effects
on linkage disequilibrium. In this case, we model the
admixture from external population B with frequency of allele ‘D’ = PD/B, and total immigration of NB
chromosomes into the total population A area. This
would comprise NBPD/B new ‘D’ chromosomes, and
NB(1 – PD/B) ‘+’ chromosomes. Any differences in
allele frequencies between ‘D’ and ‘+’ chromosomes
due to this admixture/migration would be due to differences between PD and PD/B, and also differences in
the distribution of allele frequencies at the marker
locus between populations A and B. e ‘Hitchhiking’
effect when selection favors a given allele, leading to its
increase in frequency in the population, due to varying
causes, as described in fuller detail by Kimura [7, chap.
6]. In this diagram, some selective advantage is conferred to the D* allele, and it increases in frequency,
bringing along the 6 allele at the linked marker locus;
this effect will alter the allele frequency distribution at
the marker locus as shown with the 6 allele increasing
through selection. Note that this selective effect could
be an advantage of the D* allele, or some other tightly
linked allele on the same haplotype with D*.
140
Hum Hered 1998;48:138–154
d
e
Terwilliger/Zöllner/Laan/Pääbo
dramatic variance in allele frequencies from
one generation to the next in the ‘D’ population. In the simplest case of a diallelic marker
locus, with frequency of pn in generation n,
E(pn+1) = pn, but Var(pn+1) = pn(1 – pn)/N from
simple binomial theory. Thus the larger the
population size, the smaller the variance in
allele frequency between generations, meaning that in large populations the frequency of
an allele changes slower than in small ones.
For this reason, drift will alter the allele frequency distributions at a faster rate in the
smaller ‘D’ population than in the larger ‘+’
population. The dynamics of this process for
multiallelic loci are described in more complete mathematical detail elsewhere [7–9].
Generally, smaller populations acquire linkage disequilibrium faster than bigger ones.
It is important to point out that the linkage
disequilibrium generated by genetic drift will
take the form of strongly differing allele frequency distributions at marker loci in a neighborhood around a disease locus between ‘D’
and ‘+’ chromosomes. However, this does not
mean there will be a ‘disease-associated haplotype’. In fact, there typically will not be
such a single predominant haplotype – though
there will be strong linkage disequilibrium
between the disease locus and multiple markers. Certainly it is true that the distribution of
haplotypes surrounding the disease locus will
be different between ‘D’ and ‘+’ populations,
but there will often be such haplotypic diversity within each class that haplotype-based
analysis will often not be very sensitive. This
results in a phenomenon more amenable to
detection via multiple 2-point analysis [10,
11] than haplotype or shared segment analysis
[12, 13].
In the case of a so-called ‘founder effect’,
there is fixation of alleles in the ‘D’ population for loci in a neighborhood around the ‘D’
allele (i.e. a single disease-associated haplotype is created). If there were more than one,
but still limited number of founders, then one
might see a small number of haplotypes in this
sample, the relative proportions of each varying over time due to genetic drift, with one or
few likely becoming predominant over time –
as can be modeled using traditional genetic
drift theory to predict the time to fixation of
one allele (i.e. one of many ‘D’ alleles) conditional on population structure, etc. In this
sense, the founder effect phenomenon can be
generated in the population of ‘D’ alleles over
time, as long as the absolute copy number of
each ‘D’ allele remains sufficiently small. In
this context, the insight of Cavalli-Sforza et al.
[14] that a ‘founder effect is clearly only an
episode of drift’ becomes apparent. In the early stages of expansion, while the absolute
number of copies of each haplotype in the
population remains small, drift does affect
these haplotype frequency distributions – but
as the population increases, and the absolute
number of copies of each founder allele increases, the variance of its allele frequency in
the next generation decreases, and genetic
drift is arrested.
Drift Mapping in Population Isolates
Hum Hered 1998;48:138–154
Recombination as Symmetric and
Bidirectional ‘Gene Flow’
To model the decay in linkage disequilibrium due to recombination we can consider
recombination as bidirectional gene flow (or
exchange) between the ‘D’ and ‘+’ populations. The greater the recombination fraction
between a marker locus and the disease gene,
the greater the gene flow between ‘D’ and ‘+’
populations. As is well known from population genetics, it does not take a substantial
amount of gene flow to equilibrate the allele
frequencies between populations. The equation for haplotype decay as proportional to
(1 – )n, where is the recombination fraction,
is based on models of this gene flow (between
141
‘D’ and ‘+’ populations) and assumes that one
starts with a ‘founder effect’ or fixation in the
‘D’ population for surrounding marker loci. If
one does not have an equilibrium population,
and there has been no fixation of single extended haplotypes in the ‘D’ class (as is very
often the case when disease alleles have combined frequency as large as 0.10), while recombination acts to equilibrate allele frequencies between the ‘D’ and ‘+’ populations, the
genetic drift (acting faster in the ‘D’ population than the ‘+’ population because of differences in effective population size, Ne) works
to generate new linkage disequilibrium over
time. The relative impact of these two forces
has been studied [15–17], and depends on the
number of ‘D’ chromosomes (ND) and the
number of ‘+’ chromosomes (N+; see fig. 1b),
such that the expected number of alleles exchanged between the two populations per generation is ND(1 – PD), where PD is the frequency of the D chromosomes in the population: PD = ND/(ND + N+). When this value is
small, drift dominates over recombination,
and when it is large, recombination decreases
disequilibrium faster than drift can regenerate it. Note that when recombination acts
alone, the ‘D’ population in the next generation will on average have ND[1 – (1 – PD)]
alleles derived from the previous generation’s
‘D’ population, and ND (1 – PD) alleles from
the previous generation’s ‘+’ population, and
thus the analogy to a population admixture
model becomes clear.
Mutation at Disease Locus as
Unidirectional ‘Gene Flow’ between
Populations
The effects of mutations at the disease-predisposing locus will be to convert wild-type ‘+’
alleles into disease-predisposing alleles, which
can be modeled as unidirectional gene flow
142
Hum Hered 1998;48:138–154
from the ‘+’ population to the ‘D’ population
(see fig. 1c). Such mutations will bring along a
region of DNA around the disease locus and
will therefore serve to alter the allele frequency distributions of linked marker loci. This
effect will be more pronounced in the ‘D’ population than in the ‘+’ population, since the
former population of chromosomes is generally smaller than the latter.
The mathematics of such migration models have been described, and can be applied to
understand linkage disequilibrium dynamics.
In fact, one can see that if the mutation rate
from ‘+’ to ‘D’ is Ì, and no back mutations
occur, the number of alleles at a marker locus
in the next generation’s ‘D’ population derived from the previous generation’s ‘+’ population is expected to be ÌN+ + ND(1 – PD),
and the number of alleles derived from the
previous generation’s ‘D’ population is equal
to ND[1 – (1 – PD)], as above. Thus, the population of ‘D’ chromosomes is growing slowly
due to mutations, since under most circumstances the rate of back mutation from ‘D’ to
‘+’ can be considered to be infinitesimally
small.
Admixture Migration as Differential
‘Migration’ to Different
Subpopulations
It is well known that population admixture
can create linkage disequilibrium [18]. The
reason for this can also be described in the
context of our model with ‘D’ and ‘+’ populations as follows. If, for example, a group of
individuals from a population B that lack ‘D’
chromosomes migrate into a population A,
then all the incoming marker alleles go into
the ‘+’ class of chromosomes. The effect of
this is to alter the distribution of nearby marker allele frequencies in the ‘+’ chromosomes of
population A, while leaving those in the ‘D’
Terwilliger/Zöllner/Laan/Pääbo
population unchanged. If the ‘D’ class of
alleles had frequency of 0.05 in population A,
and 0.10 in population B, the admixture from
population B would affect the ‘D’ class in population A more than it would affect the ‘+’
class, since the proportional amount of admixture would be greater, relative to Ne (see
fig. 1d). In general, we assume the ‘D’ class to
be smaller than the ‘+’ class, so the larger
effects should typically be seen in ‘D’. Mathematically speaking, if the number of chromosomes per generation entering population A
from population B is NB, and PD/B is the frequency of the ‘D’ class of alleles in population
B, then NBPD/B chromosomes will migrate
into the ‘D’ class of alleles from population
B to population A per generation, and
NB(1 – PD/B) chromosomes will migrate into
the ‘+’ class of alleles of population A per generation. Thus, under most circumstances,
population admixture will tend to increase
differences in the allele frequency distributions of linked marker loci between the ‘D’
and ‘+’ populations.
the others, such that allelic diversity in the ‘D’
class of alleles will decrease as one allele
comes to predominate. This process can act in
concert with random evolutionary forces to
cause one allele to become fixed in the ‘D’
population. One striking effect can be to increase the size of the ‘D’ population while
decreasing its diversity – this effect alone can
generate linkage disequilibrium over time,
due to the ‘hitchhiking effect’ whereby the
allele frequencies of existing alleles in the
region around the disease allele whose frequency is rising in the population are rising
along with it (see fig. 1e).
Marker Locus Mutations – No
Equilibrium State if Ne Small
If selection against disease alleles occurs,
the effect is to gradually reduce the size of the
‘D’ population as well as the diversity at the
disease locus and marker loci surrounding it.
This will increase the rate of change of marker
allele frequency distributions around the disease locus, leading to greater differences between ‘D’ and ‘+’ populations. Selection can
also act to increase linkage disequilibrium
when the selection is in favor of some allele, or
when there is balancing selection in a population to maintain some ‘D’ allele over time.
Such selection will have its most striking
effect when it is in favor of one ‘D’ allele over
Marker locus mutation rates have been
thought of as an obstacle to doing linkage disequilibrium studies in human populations
with microsatellites. It has long been known
[8] that markers with more allelic diversity
show higher amounts of linkage disequilibrium than less polymorphic markers, but it has
been hypothesized that the higher mutation
rates known to exist for microsatellite loci
might preclude their usefulness in mapping
studies – since mutation was thought of as a
normalizing factor [19, 20]. This makes intuitive sense if we are hypothesizing an equilibrium population in terms of the allele frequency
distribution at a microsatellite locus. However, in practice, we are dealing with populations where at least the ‘D’ class is sufficiently
small that equilibrium is not approached [21],
at least not relative to mutation at the marker
locus, such that any effects of mutation may
act to increase disequilibrium by inducing
asymmetric changes between the ‘D’ and ‘+’
populations (since marker mutation acts independently on each). Only in large populations,
over the long term, may it lead to an approach
Drift Mapping in Population Isolates
Hum Hered 1998;48:138–154
Selection Modeled as Change in
Relative Size of Subpopulations and
Hitchhiking Effect
143
to equilibrium and thus absence of linkage
disequilibrium between the ‘D’ and ‘+’ populations. It should be noted that in general,
mutation rates for microsatellites are !0.008
[19], and when marker mutation rates on this
order of magnitude (or smaller) are considered, the effects are negligible relative to genetic drift and recombination, and for the
most part marker mutation can be safely disregarded as a factor in decay of drift-generated disequilibrium (see simulation results
below).
Inbreeding and Assortative Mating
In general inbreeding and assortative mating will lead to a more rapid generation of linkage disequilibrium (due to its effect on decreasing the effective population size), and
slower decay of such disequilibrium due to
recombination – because in systems with inbreeding and in which there is assortative mating with respect to the genotype of the locus
under study, the primary effect is that there
will be too many individuals in the population
who are homozygous at the disease locus, and
too few heterozygotes [7, 8, 22]. In such cases,
recombination will have less effect because it is
increasingly likely that recombinations occur
between two ‘D’ chromosomes or between two
‘+’ chromosomes. On the other hand, a tendency towards inbreeding avoidance may lead to
recombination acting somewhat faster to decay the disequilibrium, though when the ‘D’
allele frequency is !0.20, there are so few
homozygotes expected that this effect is minimal. The effect on the gene flow between ‘D’
and ‘+’ chromosomes can be quantified in
terms of the inbreeding coefficient, f, such that
instead of having NDN+/(ND + N+) alleles at
the marker locus flow between ‘D’ and ‘+’
populations each generation, one will have
(1 – f )NDN + /(ND + N+) [see 23].
144
Hum Hered 1998;48:138–154
Constant Population Size versus
Expanded Population Size
Demographic history has dramatic impact
on each of the aforementioned forces. In a
population of constant size, new disequilibrium is continuously generated due to genetic
drift [17]. In our example, random sampling
of haplotypes causes a continual change in the
marker allele frequencies in the ‘D’ and ‘+’
populations, and also in the relative sizes of
the ‘D’ and ‘+’ populations. In contrast, in a
rapidly expanding population there will be little effect of genetic drift to generate new linkage disequilibrium (after the first few generations of expansion, when the absolute number
of chromosomes is still small), since most
alleles will be represented in each generation
in roughly the same proportions as in the preceding generation. Consequently, the allelic
composition of the population will be a snapshot of the conditions after the earliest stages
of the expansion (which may itself represent
the result of generations of earlier genetic
drift). In such populations, however, there is a
rapid decay in the amount of linkage disequilibrium around a given locus, because of the
large number of opportunities for recombination and mutation, while in contrast to stable
populations there is minimal genetic drift to
generate new disequilibrium over time. Effectively, population expansion arrests genetic
drift, and thus leads to populations in which
new linkage disequilibrium does not develop,
whereas recombination continues to decay existing linkage disequilibrium. A summary diagram of the forces affecting linkage disequilibrium in constant and expanded populations is
outlined in figure 2 and table 1; the forces are
described in terms of their relative influence
on linkage disequilibrium.
We propose that the higher levels of linkage disequilibrium generated by genetic drift
in constant populations may be usefully ex-
Terwilliger/Zöllner/Laan/Pääbo
Fig. 2. Summary of all the
forces acting to generate and destroy linkage disequilibrium displayed in the context of our population subdivision model.
ploited as a tool to map genetic loci with reasonable phenotypic effects, including loci
where disease alleles have been created by
mutations far back in time and those at which
multiple recurrent mutations have occurred
over time. In this regard it is important to
remember that what we mean by linkage disequilibrium is the existence of some difference in the allele frequency distribution at
some marker locus conditional on whether
‘D’ or ‘+’ alleles are present at the disease
locus. This will be the case for populations
where no demographic expansion has taken
place since genetic drift will there generate
differences in marker allele frequency distributions in a neighborhood around the disease
locus, whereas all unlinked parts of the genome evolve as one single population where
consequently no differences in marker allele
frequencies conditional on the disease trait
are expected. In this approach, no single associated marker allele need be expected, and no
single haplotype need be assumed. There will
simply be higher levels of linkage disequilibrium around the disease locus, as described by
Ohta and Kimura [15, 16] for selectively neu-
tral alleles, and by Franklin and Lewontin
[24] and Felsenstein [25] in the presence of
selection. At the time when the initial studies
of drift-generated linkage disequilibrium were
done [e.g. 5, 6, 15, 16, 24, 25], the major linkage disequilibrium mapping impetus was towards identifying rare alleles of strong effect, for which populations which had gone
through a bottleneck followed by rapid expansion are ideal for detection of linkage disequilibrium. Today, however, the main focus of
gene mappers is on identifying common alleles or allelic classes which may have smaller
individual phenotypic effects. In this search,
such expanded populations have not been
very useful, and we propose that some of the
solutions might lie rather in these stable populations which were ill-adapted to the earlier
problem of identifying rare disease alleles.
In the last sections of this paper we investigate the possibilities for mapping through genetic drift in constant populations as compared with the common approach of using
rapidly expanded populations to identify single haplotypes which appear due to a founder
effect.
Drift Mapping in Population Isolates
Hum Hered 1998;48:138–154
145
Table 1. Effects of various phenomena on linkage disequilibrium mapping as a function of
demographic history
Force
Population structure
constant size
exponential expansion
Genetic drift
Higher recombination fraction
Longer time in generations
Large population size
Mutation (trait locus)
Mutation (marker locus)
Migration
Shared segment methods?
Multiple 2-point works?
Protective alleles detected?
Founder effect?
‘D’ allele frequency
Pattern of disequilibrium
No initial disequilibrium
Increases
Decreases
Increases
Decreases
Minimal effect
Minimal effect
Can increase
No
Yes
No
No
Increases
Random
Generated over time
Negligible effect
Decreases
Decreases
Decreases
Decreases
Minimal effect
Slight increase possible
Yes
Yes
No
Maybe
Decreases
Single haplotype
No later disequilibrium
Decay rate in Related to NDN+
ND + N+
Related to (1 – )N
Where not clearly stated, the effects given are such when the phenomenon in the first
column is increased. The effects listed under the population structure headings refer to the
effects of the phenomenon on linkage disequilibrium.
Saami and Finns
Finns and Saami (formerly known as
Lapps) are two populations that live in close
geographic proximity in Fenno-Scandinavia.
Whereas the Finns show signs of a rapid population expansion that probably took place
within the last few thousand years, Saami do
not present evidence of any such expansion.
When seven microsatellite loci on the X chromosome were analyzed in random individuals in these two populations [26], it was
found that 17 out of 21 pairwise comparisons
of highly polymorphic microsatellite loci
showed linkage disequilibrium at the 0.05 level in a sample of Saami from northern Sweden, whereas only two pairs did so in the
Finns. In fact, 14 of those pairs in Saami were
146
Hum Hered 1998;48:138–154
significant at the 0.0001 level, while only 1
was in Finns; it should be noted that that single pair of very tightly linked loci which were
strongly associated in Finns has been shown
to be strongly associated (p ! 0.000001) in
every population studied, irrespective of population structure or history [26].
Furthermore, several loci exhibiting linkage disequilibrium in the Saami were separated by more than 10 Mb. The same situation obtains in several other small populations that have been of constant size over long
time according to analyses of DNA sequence
variation, while many other large and small
expanded populations behave like the Finns
[Laan et al., unpubl. observations]. Thus, it
seems that several nonexpanded human populations exhibit levels of drift-generated link-
Terwilliger/Zöllner/Laan/Pääbo
age disequilibrium that would potentially allow for the detection of disease loci by a
genomic screen for linkage disequilibrium.
If one is applying haplotype analysis methods or searches for shared chromosomal segments, the high levels of marker to marker
linkage disequilibrium may increase the rate
of false positives [4, 27, 28]. Shared segment
approaches are thus anticonservative because
of the background linkage disequilibrium between markers – whether or not there is a disease allele in their vicinity. Furthermore,
drift-generated linkage disequilibrium is not
expected to present itself in the form of predominant shared segments or haplotypes. As
a result, such approaches to gene mapping are
not very powerful when linkage disequilibrium is present since it will not take this form.
In contrast, single marker analysis should
benefit from the marker-marker correlations
– in that much less multiple testing correction
is needed – much like the well-studied situation in linkage analysis [27, 29]. Multiple twopoint analysis [10, 11] is expected to be close
to optimal for detecting this type of linkage
disequilibrium, because the decay in the
amount of disequilibrium between marker
loci and disease locus is a function of the
recombination fraction, and population size
and structure. Methods based on the likelihood of multiple marker data as a function of
this predicted decay in disequilibrium [see 11,
21] are under development.
In order to demonstrate empirically that
the disequilibrium between linked markers
does not increase the false-positive rate, the
data of Laan and Pääbo [26] were subjected to
a randomization analysis. In this analysis, we
randomly assigned observed haplotypes of the
seven loci in their study to be either cases or
controls and then performed contingency table ¯2 tests of linkage disequilibrium for each
marker independently. From this, we determined the pointwise false-positive rate for
each marker locus to show that there is no
increased false-positive rate from this analysis. Then, we identified the most significant
statistic over the seven markers analyzed, and
looked at the false-positive rate over this region. For both samples, after 100,000 randomizations, the false-positive rates were consistent with what was expected for each of the
marker loci in the sample, in a single marker
locus analysis. However, when one identified
the most significant of the seven loci, in
Finns, the probability of this being significant
at the 0.05 level was 0.27, which is also the
value one expects if the tests were independent at each locus (i.e. 1 – ¶[1 – pi]), given the
pi estimates from the randomizations. However, for the Saami, this probability was only
0.19, where it was expected to be 0.265 if the
tests were independent. For a p value of 0.01,
the corresponding false-positive rates were
0.042 in Finns, and 0.029 in Saami compared
to expected (under independence) rates of
0.041 and 0.039, respectively. This indicates
that the presence of marker-marker disequilibrium, as predicted, leads to a decrease in
the region-wide false-positive rates in the
Saami, while in the rapidly expanded Finnish
population, a Bonferroni correction is indicated because the tests of disequilibrium with
even these tightly linked loci behave as independent tests.
Drift Mapping in Population Isolates
Hum Hered 1998;48:138–154
Simulated Population Data
In order to simulate the extent to which the
predictions outlined above can be expected to
hold, simulations were performed for a given
starting population size and frequency for the
allelic class ‘D’. Disease locus genotypes were
simulated assuming Hardy-Weinberg equilibrium, and marker locus genotypes (with
phase) were simulated independently of the
disease locus (i.e. no linkage disequilibrium is
147
Fig. 3. Power calculations to
demonstrate the effects of different
phenomena on detectability of
linkage disequilibrium between a
marker locus and the disease locus
genotypes. Note that for purposes
of this figure, the simulated conditions were selected to demonstrate
the effects of the various phenomena; thus the conditions do not
represent the most powerful situations but rather situations for
which the power varies as a function of the different parameters in
an obvious manner. a Effects of
marker heterozygosity – in this
simulation, P(‘D’) = 0.20, constant population sizes (500, 1,000,
5,000, and 10,000 founder individuals), and 30 generations since
population founding with no initial
disequilibrium. Marker heterozygosity is simulated by altering the
number of equally frequent alleles
(X axis). When P(‘D’) is smaller,
the powers are substantially higher;
this value was selected to illustrate
the effects of marker heterozygosity on linkage disequilibrium. b Effects of population expansion on
linkage disequilibrium – in this
simulation, P(‘D’) = 0.20; the
marker locus has 4 equally frequent
alleles, and recombination fraction
of 0.025 between disease and
marker loci are assumed. When is
smaller, the effect of expansion rate
is attenuated somewhat, and when
a
b
assumed to exist in the first generation). Mating pairs were selected randomly from the
population, assuming one mate of opposite
sex per individual, with the number of children per couple distributed according to a
Poisson distribution with mean Ï. When Ï = 2
the population size is roughly constant, and
when Ï 12 the population is exponentially
expanding. Segregation of disease locus alleles
to each child was random, with marker locus
148
Hum Hered 1998;48:138–154
segregation being simulated conditional on
disease locus transmission according to the
recombination fraction, . Mutations at the
disease locus were simulated in one direction
‘+’→ ‘D’ with small probability, back mutation assumed to be negligibly rare. At the
marker locus mutations were assumed to follow a one-step model, wherein if a mutation
occurs, the microsatellite allele size changes
by one repeat unit up or down, with slight
Terwilliger/Zöllner/Laan/Pääbo
P(‘D’) is smaller the powers are
higher in general. Initial population sizes (N = 200, 500, 1,000,
2,000, and 5,000) are shown; note
that the populations are expanding
exponentially, so the population
from which the cases and controls
were ascertained can be substantially larger than this number.
c Effects of time and recombination fraction on linkage disequilibrium – in this simulation, P(‘D’) =
0.20, and 4 equally frequent marker alleles are assumed – recombination fractions ( = 0, 0.025, 0.05,
and 0.15) and time in generations
since the initial generation (where
there was no disequilibrium) are
varied to demonstrate their relative
and combined effects. d Effects of
recombination fraction on power
to detect linkage disequilibrium. In
this simulation, P(‘D’) = 0.20; 4
equally frequent marker alleles,
mutation rate (+ → D) of 0.001;
marker mutation rate of 0.008, and
population size = 1,000. Power after 10, 30, and 50 generations is
shown as a function of recombination fraction between disease and
marker, .
c
d
directional bias toward the center of the distribution. This process was repeated sequentially to simulate N generations.
To determine the power of the population
to detect linkage disequilibrium, 100 chromosomes from the ‘D’ population and 100 from
the ‘+’ population were ascertained randomly
and a contingency table ¯2 test was performed; this was repeated 1,000 times to estimate the power to detect linkage disequilibri-
um between alleles at the disease and marker
loci for a given population structure after N
generations. This power calculation was performed for each simulated replicate of the
population history and structure. In each case,
100 such populations were simulated, with
the average powers being presented in figure 3. To look at the effect of the mode of
inheritance, trait phenotypes were simulated
conditonal on genotypes at this locus accord-
Drift Mapping in Population Isolates
Hum Hered 1998;48:138–154
149
ing to some predetermined mode of inheritance, and again 50 cases and 50 controls (100
chromosomes per sample) were randomly ascertained from the population. Optionally
parental controls can be used by this program
according to the haplotype relative risk ascertainment procedure [see 30]. Selective neutrality was assumed for purposes of this study,
but the software is written to allow for selection by censoring individuals from the next
mating generation with probabilities conditional on disease locus genotype. This software is available from the authors by E-Mail
request (to [email protected]) if the reader
would like to simulate certain specific conditions, not given in this paper.
We first investigated the effects of marker
heterozygosity on the power to detect linkage
disequilibrium in constant populations of various sizes, as shown in figure 3a. In this analysis, we assumed the ‘D’ class of alleles to have
frequency of 20%, and absence of recombination between disease and marker loci. In each
replicate, n equally frequent alleles were simulated in populations of varying sizes, demonstrating that the more polymorphic the marker, the higher the chance to detect linkage disequilibrium, even when the marker locus mutation rate is assumed (as it was here) to be as
high as 0.008 [19]. When the ‘D’ class of
alleles is less frequent, the power can be substantially higher (data not shown) – the purpose of this analysis is to demonstrate the
trend. It is clearly notable that smaller populations exhibit higher levels of disequilibrium
than larger ones, also as predicted by the drift
model. Larger populations can exhibit equally
large levels of disequilibrium depending on
the assumed distribution of marker allele frequencies and ‘D’ allelic class frequency, consistent with empirical data [26].
To examine the effects of population expansion on the ability to detect linkage disequilibrium, we simulated populations with
150
Hum Hered 1998;48:138–154
initial sizes of 200, 500, 1,000, 2,000, and
5,000, with a mean number of offspring per
couple ranging from 2 (constant population
size) to 3 (rapid exponential growth of 150%
per generation). The frequency of ‘D’ in the
Nth generation was not specified or controlled, and the ‘D’ class alleles are sometimes
completely lost in the smallest populations, or
there were fewer than 100 ‘D’ chromosomes
in the population from which the data were
ultimately ascertained – in those circumstances, the ‘D’ sample is decreased as required, leading to the lower power in this sample, despite possibly higher levels of genetic
drift. The results are shown in figure 3b. What
one can see is that even small rates of population expansion prevent linkage disequilibrium from being generated in the 30 generations time-simulated in this analysis. In this
example, a four-allele marker locus was simulated, with recombination fraction of 0.025
between marker and disease loci. The slight
increase in power observed when moving
from population size of 200 to population size
of 500 (at no or very low expansion rates) has
to do with the decreased probability of the ‘D’
class being eliminated due to drift in the larger
population.
In figure 3c, we examine the effects of time
and recombination fraction on the power to
detect linkage disequilibrium – here in a constant population of starting size 1,000, and a
marker locus with 4 equally frequent alleles.
As can be seen, the disequilibrium increases
with time, to some stable ‘equilibrium’ between the effects of recombination fraction
(decreasing disequilibrium) and genetic drift
(increasing disequilibrium). The important
factor here is that linkage disequilibrium
created by genetic drift does not disappear
with time, as opposed to linkage disequilibrium in rapidly expanded populations caused
by a founder effect. As shown in the simulations in figure 3b, in expanded populations,
Terwilliger/Zöllner/Laan/Pääbo
the disequilibrium does disappear (or more
accurately fails to appear) as time increases.
In light of these results we propose that small
populations of constant size might be of more
utility in gene mapping of common ‘D’ classes
of alleles. To address the issue of how quickly
the disequilibrium decays with respect to the
recombination fraction, figure 3d shows this
relationship in terms of power to detect the
disequilibrium assuming a population of constant size 1,000, a 4-allele marker, and P(‘D’)
= 0.20 as above. As one can see, the power
does drop substantially as one goes to increasing genetic distances, but consistent with the
results in figure 3c, the power is still fairly
large even at a genetic distance of = 0.10.
To analyze the observation that in isolated
populations of constant size there is an abject
absence of rare recessive diseases [31], in contrast to the diseases of the Finnish disease heritage [2, 3] (which remain in large numbers
due to rapid population expansion), ‘D’ allele
frequencies of 0.01 and 0.001 were simulated,
in which case fixation of the ‘+’ allele occurs
rapidly in the constant populations, while in
the expanded populations there was much
higher probability of it being maintained
through the expansion (data not shown). This
observation was consistent with empirical
evidence. Similarly in those situations where
a single founder chromosome was maintained, the predicted single haplotype was
also preserved over a long distance around the
disease locus consistent with predictions and
empirical evidence.
When one is hoping to detect allelic associations with a complex phenotype, one will
obviously need larger sample sizes than to
detect linkage disequilibrium between markers and disease locus genotypes [32–35]. Just
how much lower the power will be is a function of the genotype-phenotype relationship,
the distribution of alleles at other disease-predisposing loci in a given population, and other
etiological covariates (be they genetic, environmental, or cultural). In small populations
of stable demographic history, the chance for
fixation of alleles at additional loci involved
in the etiology of disease is high [7, 8], potentially increasing or decreasing the power (due
to the potentially increased amount of genetic
homogeneity in the population and correspondingly lower levels of genotypic and phenotypic variability).
Drift Mapping in Population Isolates
Hum Hered 1998;48:138–154
Complex Disease Genetics and Drift
Mapping
There has been a great deal of effort invested to try and identify genetic factors
which have some predisposing influence on
common phenotypes. To date only linkage
analyses on large pedigrees [e.g. 36–39] and
candidate gene analyses [e.g. 40–42] have
been successful in gene identification. To this
end, it has been proposed that linkage disequilibrium methods might provide a solution
[32]. However, as these results indicate (see
fig. 3b) such studies may be doomed to failure in expanded populations. Most linkage
disequilibrium mapping studies have looked
at populations which have undergone a bottleneck followed by rapid expansion to try
and identify unique disease-associated haplotypes. This protocol can be successful only
in diseases where the ‘D’ allele is rare (relative
to Ne) and its effect on the phenotype is large
[e.g. 12, 13, 43, 44], and/or selective pressure
in the past may have led to an increase in the
frequency of a specific ‘D’ allele at some point
in history [44, 45]. It is proposed that small
populations of constant size (including those
with recent admixture) might hold some of
the solutions to this problem [see 46–49] provided that sufficient epidemiological information can be made available [see 50–57].
151
It has been questioned [4] whether ‘... the
allelic complexity of common diseases [will]
turn out to be sufficiently low for LD mapping
to work, even in young isolated populations’.
If one considers this model for drift-generated
linkage disequilibrium, it may turn out that
allelic complexity is not such a significant
impediment, but that young isolated populations may be far from ideal when disease
alleles are common. Perhaps it is in the older
constant-sized populations where some of the
solutions may be found.
Conclusions
In summary of the model, let us refer back
to figure 2, in which the major forces affecting
the dynamics of linkage disequilibrium are
illustrated, and table 1 in which the effects of
the various phenomena are delineated. It is
clear that for mapping of rare diseases of
strong effect, populations which have undergone a bottleneck followed by rapid expansion may be optimal, as evidenced by the successful mapping studies of the Finnish disease
heritage [2, 58–60]. This same result may
apply if selective pressure may have caused a
disease allele to increase in frequency at some
point in the past due to a hitchhiking effect.
However, for disease alleles which are common relative to the population size, and for
which selective neutrality is assumed (for
most common oligogenic diseases – typically
of late age of onset – selection can largely be
ignored), there may be no detectable linkage
disequilibrium in these rapidly expanded
populations.
In contrast, populations of small constant
size generate new disequilibrium faster than
recombination can make it disappear, such
that in large populations the disequilibrium is
only generated over small regions, while in
small populations it can extend over very
152
Hum Hered 1998;48:138–154
large regions. This disequilibrium, while not
presenting a ‘disease-associated’ haplotype,
can be detected in case control studies using
two-point or multiple pairwise approaches.
To this end, for mapping of disease loci whose
‘D’ class of alleles is large relative to Ne, small
constant populations may provide the best
solution. This may be so, not only because of
the high amount of linkage disequilibrium in
such populations, but also because for oligogenic traits, there is likely to be a smaller number of additonal predisposing genes segregating in those populations (other disease alleles
at other loci may be fixed or lost to drift with
higher probability than in expanded populations), as well as higher levels of cultural and
environmental homogeneity. When combined with recent colonial admixture, there
may be a plethora of allelic associations waiting to be discovered in the right resource.
Anthropological geneticists have already used
extremely isolated populations in linkage
mapping studies [e.g. 61, 62], and it is proposed that further collaboration between population geneticists and gene mappers might be
critical to making a success of common disease gene mapping by linkage disequilibrium.
Acknowledgments
We thank the following for financial support: A
Hitchings-Elion Fellowship from the Burroughs-Wellcome Fund (to J.T.), a fellowship from the Alexandervon-Humboldt-Stiftung (to M.L.), and the Deutsche
Forschungsgemeinschaft (Pa 452/3-1; Ha1628/2-2).
Helpful comments on an earlier version of this manuscript from Harald Göring, Dan Rabinowitz, Jürg Ott,
and an anonymous reviewer are gratefully acknowledged as are useful discussions with Jim Knowles and
Michael Crawford.
Terwilliger/Zöllner/Laan/Pääbo
OOOOOOOOOOOOOOOOOOOOOOOOOOOOOOOOOOOOOOOOOOOOOOOOOOOOOOOOOOOOOOOOOOOOOOOOOOOOOOOOOOOOOOOOOOOOOOOOOOOOOOOOOOOOOOOOOOOOOOO
References
1 Grade K, Jandrig B, Scherneck S:
BRCA1 mutation update and analysis. J Cancer Res Clin Oncol 1996;
122:702–706.
2 Norio R: Suomalaisen tautiperinnön tulevaisuus. Duodecim 1994;
110:640–643.
3 Norio R, Nevanlina HR, Perheentupa J: Hereditary diseases in Finland:
Rare flora in rare soil. Ann Clin Res
1973;5:109–141.
4 Kruglyak L: What is significant in
whole-genome linkage disequilibrium studies? Am J Hum Genet 1997;
61:810–812.
5 Hill WG, Robertson A: Linkage disequilibrium in finite populations.
Theor Appl Genet 1968;38:226–
231.
6 Ohta T: Linkage disequilibrium due
to random genetic drift in finite subdivided populations. Proc Natl
Acad Sci USA 1982;79:1940–1944.
7 Kimura M: The Neutral Theory of
Molecular Evolution. Cambridge,
Cambridge University Press, 1983.
8 Wright S: Evolution and the Genetics of Populations, vol 2: The Theory of Gene Frequencies. Chicago,
University of Chicago Press, 1969.
9 Cavalli-Sforza LL, Bodmer WF: The
Genetics of Human Populations.
San Francisco, Freeman 1971.
10 Morton NE, Andrews V: MAP, an
expert system for multiple pairwise
linkage analysis. Ann Hum Genet
1989;53:263–269.
11 Terwilliger JD: A powerful likelihood method for the analysis of linkage disequilibrium between trait loci
and one or more polymorphic marker loci. Am J Hum Genet 1995;56:
777–787.
12 Houwen RHJ, Baharloo S, Blankenship K, Raeymaekers P, Juyn J,
Sandkuyl LA, Freimer NB: Genome
screening by searching for shared
segments: Mapping a gene for benign recurrent intrahepatic cholestasis. Nat Genet 1994;8:380–386.
13 Nikali K, Suomalainen A, Terwilliger J, Koskinen T, Weissenbach J,
Peltonen L: Random search for
shared chromosomal regions in four
affected individuals: The assignment of a new hereditary ataxia locus. Am J Hum Genet 1995;56:
1088–1095.
Drift Mapping in Population Isolates
14 Cavalli-Sforza LL, Menozzi P, Piazza A: The History and Geography of
Human Genes. Princeton, Princeton University Press, 1994.
15 Ohta T, Kimura M: Linkage disequilibrium due to random genetic
drift. Genet Res 1969;13:47–55.
16 Ohta T, Kimura M: Linkage disequilibrium at steady state determined by random genetic drift and
recurrent mutation. Genetics 1969;
63:229–238.
17 Slatkin M: Linkage disequilibrium
in growing and stable populations.
Genetics 1994;137:331–336.
18 Chakraborty R, Weiss K: Admixture as a tool for finding linked genes
and detecting that difference from
allelic association between loci. Proc
Natl Acad Sci USA 1988;85:9119–
9123.
19 Weber JL, Wong C: Mutation of
short tandem repeats. Hum Mol
Genet 1993;2:1123–1128.
20 Todd JA: Panning for gold: Genome-wide scanning for linkage in
type I diabetes. Hum Mol Genet
1992;1:663–666.
21 Kaplan NL, Hill WG, Weir BS: Likelihood methods for locating disease genes in nonequilibrium populations. Am J Hum Genet 1995;56:
18–32.
22 Maynard Smith J: Evolutionary Genetics. Oxford, Oxford University
Press, 1989.
23 Hartl DL: A Primer of Population
Genetics. Sunderland, Sinauer,
1987.
24 Franklin I, Lewontin RC: Is the gene
the unit of selection? Genetics 1970;
65:707–734.
25 Felsenstein J: Uncorrelated genetic
drift of gene frequencies and linkage
disequilibrium in some models of
linkage overdominant polymorphisms. Genet Res Camb 1974;24:
281–294.
26 Laan M, Pääbo S: Demographic history and linkage disequilibrium in
human populations. Nat Genet
1997;17:435–438.
27 Terwilliger JD, Shannon WD, Lathrop GM, Nolan JP, Goldin LR,
Chase GA, Weeks DE: True and
false peaks in genome-wide scans:
Applications of length-biased sampling to linkage mapping. Am J
Hum Genet 1997;61:430–438.
28 Terwilliger JD: Mapping genes predisposing to complex traits in extreme population isolates. CSC
News 1997;02/97:23–26.
29 Lander ES, Kruglyak L: Genetic dissection of complex traits: Guidelines
for interpreting and reporting linkage results. Nat Genet 1995;11:241–
247.
30 Terwilliger JD, Ott J: A haplotypebased haplotype relative risk statistic. Hum Hered 1992;42:337–346.
31 Milan FA: The Human Biology of
Circumpolar Populations. Cambridge, Cambridge University Press,
1980.
32 Risch N, Merikangas K: The future
of genetic studies of complex human
diseases. Science 1996;273:1516–
1517.
33 Weiss KM: Genetic Variation and
Human Disease. Cambridge, Cambridge University Press, 1995.
34 Weiss KM: Is there a paradigm shift
in genetics? Lessons from the study
of human diseases. Mol Phylogenet
Evol 1996;5:259–265.
35 Terwilliger JD: Review of ‘Genetic
Variation and Human Disease’ by
Weiss KM. Am J Hum Genet 1997;
60:1565–1566.
36 Goldgar DE, Fields P, Lewis CM,
Tran TD, Cannon-Albright LA,
Ward JH, Swensen J, Skolnick MH:
A large kindred with 17q-linked
breast and ovarian cancer: Genetic,
phenotypic, and genealogical analysis. J Natl Cancer Inst 1994;86:200–
209.
37 Trembath RC, Clough RL, Rosbotham JL, Jones AB, Camp RDR,
Frodsham A, Browne J, Barber R,
Terwilliger JD, Lathrop GM, Barker
JNWN: Identification of a major
susceptibility locus on chromosome
6p and evidence for further disease
loci revealed by a two stage genomewide search in psoriasis. Hum Mol
Genet 1997;6:813–820.
Hum Hered 1998;48:138–154
153
38 Pericak-Vance MA, Bebout JL, Gaskell PC Jr, Yamaoka LH, Hung WY,
Alberts MJ, Walker AP, Bartlett RJ,
Haynes CA, Welsh KA, et al: Linkage studies in familial Alzheimer
disease: Evidence for chromosome
19 linkage. Am J Hum Genet 1991;
48:1034–1050.
39 Tienari PJ, Terwilliger JD, Ott J,
Palo J, Peltonen L: Two-locus linkage analysis in multiple sclerosis.
Genomics 1994;19:320–325.
40 Spielman RS, McGinnis RE, Ewens
WJ: Transmission test for linkage
disequilibrium: The insulin gene region and insulin-dependent diabetes
mellitus (IDDM). Am J Hum Genet
1993;52:506–516.
41 McKenzie CA, Julier C, Forrester T,
McFarlane-Anderson N, Keavney
B, Lathrop GM, Ratcliffe PJ, Farrall
M: Segregation and linkage analysis
of serum angiotensin I-converting
enzyme levels: Evidence for two
quantitative trait loci. Am J Hum
Genet 1996;57:1426–1435.
42 Risch N: Assessing the role of HLAlinked and unlinked determinants of
disease. Am J Hum Genet 1987;40:
1–14.
43 deVries HG, van der Meulen MA,
Rozen R, Halley DJ, Scheffer H, ten
Kate LP, Buys CH, te Meerman GJ:
Haplotype identity between individuals who share a CFTR mutation
allele ‘identical by descent’: Demonstration of the usefulness of the haplotype-sharing concept for gene
mapping in real populations. Hum
Genet 1996;98:304–309.
44 Ajioka RS, Jorde LB, Gruen JR, Yu
P, Dimitrova D, Barrow J, Radisky E, Edwards CQ, Griffen LM,
Kushner JP: Haplotype analysis of
hemochromatosis: Evaluation of
different linkage-disequilibrium approaches and evolution of disease
chromosomes. Am J Hum Genet
1997;60:1439–1447.
154
45 Escamilla MA, Spesny M, Reus VI,
Gallegos A, Meza L, Molina J, Sandkuijl LA, Fournier E, Leon PE,
Smith LB, Freimer NB: Use of linkage disequilibrium approaches to
map genes for bipolar disorder in
the Costa Rican population. Am J
Med Genet 1996;67:244–253.
46 Harvald B: Breakup of an isolate.
Arctic Med Res 1988;47:41–42.
47 Harvald B: The genetic epidemiology of Greenland. Arctic Med Res
1989;48:171–174.
48 Nordic Council for Arctic Medical
Research: Symposium on genetic
diseases in the sparsely populated
areas of the Nordic countries. Oulu,
Report 24, 1979.
49 Terwilliger JD: Genetic epidemiology and circumpolar population isolates – The ‘Finland’ of complex disease? Abstract to Securing Northern
Futures. Canadian Circumpolar Institute, Edmonton 1997.
50 Andersen S: Greenland medical bibliography. Arctic Med Res 1981;
29:1–137.
51 Curtis T, Bjerregaard P: Health Research in Greenland – A Catalogue
of Projects. Danish Institute of Clinical Epidemiology, Copenhagen
1995.
52 Fortuine R: The health of the Inuit
of North America: A bibliography
from the earliest times through
1990. Arctic Med Res 1993;
52(suppl 8):1–353.
53 Kaznacheev VP, Kulikov VJ, Soli E,
Leppäluoto J, Stenbäck F: Bibliography on arctic medical research in the
USSR. Arctic Med Res 1985;39:1–
143.
Hum Hered 1998;48:138–154
54 Kromann N, Green A: Epidemiological studies in the Upernavik District, Greenland: Incidence of some
chronic diseases 1950–74. Acta Med
Scand 1980;208:401–406.
55 Shephard RJ, Rode A: The Health
Consequences of ‘Modernization’.
Cambridge, Cambridge University
Press, 1996.
56 Nielsen NH: Cancer incidence in
Greenland. Arctic Med Res 1986;
43:1–168.
57 Young TK, Schraer CD, Shubnikoff
EV, Szathmary JE, Nikitin YP:
Prevalence of diagnosed diabetes in
circumpolar indigenous populations. Int J Epidemiol 1992;21:730–
736.
58 Nevanlinna HR: The Finnish population structure. A genetic and genealogical study. Hereditas 1972;71:
195–236.
59 de la Chapelle A, Hästbacka J, Lehesjöki AE, Sulisalo T, Kere J, Tahvanainen E, Sistonen P: Kytkentä ja
kytkentäepatasapaino suomalaisessa tautiperinnössä. Duodecim 1994;
110:654–664.
60 Peltonen L, Pekkarinen P, Aaltonen
J: Messages from an isolate: Lessons
from the Finnish gene pool. Biol
Chem Hoppe-Seyler 1995;376:697–
704.
61 Eiberg H, Nielsen IM: Linkage studies of cholestasis familiaris groenlandica/Hyler-like disease with polymorphic protein and blood group
markers. Hum Hered 1993;43:250–
256.
62 Norman RA, Thompson DB, Foroud T, Garvey WT, Bennett PH,
Bogardus C, Ravussin E: Genomewide search for genes influencing
percent body fat in Pima Indians:
Suggestive linkage at chromosome
11q21-q22. Pima Diabetes Gene
Group. Am J Hum Genet 1997;60:
166–173.
Terwilliger/Zöllner/Laan/Pääbo


© Copyright 2026