
Water Footprint and Environmental Impact Assessment of an
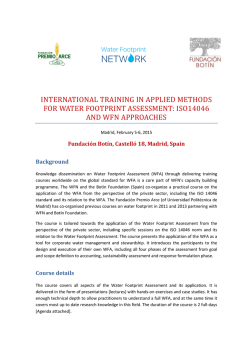
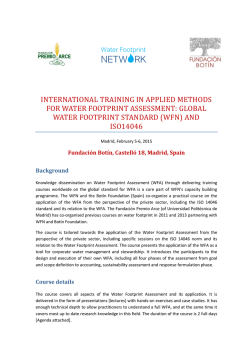
Environmental Impact Assessment of an Industrial Activity based on Life Cycle
Analysis and Water Footprint Concept
V. S. Koutantelia and M. P. Papadopoulou
School of Rural and Surveying Engineering, National Technical University of Athens, Athens, Zografou, 15780,
Greece
Keywords: life cycle analysis, environmental impact assessment, water footprint, vinification
Presenting author email: [email protected], [email protected]
ABSTRACT
Nowadays due to the high consumption of water in agriculture, industry, energy production and domestic use,
an urgent need for water accounting at Life Cycle Analysis level is required. This paper focuses on a vinification
case study applying Life Cycle Analysis (LCA) in Water Footprint (WF) concept. The calculations refer to a
small-size wine production industry in Polydrosos, Greece with a production line of ≈197000 wine bottles
(750ml) per year. The WF estimation and environmental impact assessment are based on the production-chain
diagram presenting inputs and outputs for each process stage. The main processes considered in this case were:
cultivation, vinification, creation of packaging materials and final product whereas the transportation phase was
excluded. The WF of a 750ml bottle of wine was varied between 1565,77lt to 1757,16lt depending upon the
adopted WF approach. The results indicated that 99,6% of the total WF is related to the supply-chain water
consumption and only 0,4% to the operational one. The analysis showed that the selection and origin of raw
materials need to be considered prior in order to achieve an optimal water resources management plan for a
region. Additionally, in the impact assessment phase of LCA, cultivation process appears to be a “hotspot” for
wine production that affects mostly the system. In conclusion, by identifying processes that have potential for
improvement LCA was proved to be an important tool for sustainable development of high water consumption
industries.
1. Introduction
Water is one of the most important natural resources that affect humans’ life both in terms of survival, but also
in their development. However, modern lifestyle, overpopulation and climate change have intensified water
scarcity phenomenon. In various regions around the world occurs noticeable lack of water reserves and as a
result nearby populations are not able to satisfy their daily domestic demands. The largest percentage of
available freshwater worldwide is mainly used in agriculture to produce food therefore these phenomena create
an urgent need for developing control systems to obtain optimal water resources management.
Within the last few years, two new concepts are gaining prominence in the field of optimal water management:
a) Water Footprint, an alternative environmental indicator of freshwater consumption that refers to the total
volume of freshwater consumed in the production of a product or a service and b) Life Cycle Analysis, a tool to
determine the environmental impacts caused by products or services through the production chain.
Over the years there were several applications in terms of total water consumption in almost all sectors of
productive activity (energy, agriculture and industry). Most of the studies focus on agricultural and industrial
products such as food, drinks and beverages. In particular the main applications refer to cotton [1], wheat [2],
rice [3], coffee and tea [4], pasta [5], beverage [6], tea and margarine [7], wine [8]. All these studies showed that
there is still plenty of room for research in order to optimize water consumption in an industrial activity
considering processes from cradle to grave.
The aim of this paper is the estimation of water footprint indicator for a small-size wine industry. This product
was chosen since the raw material “grapes” is one of the most widespread crop in Greece and its production
with respect to water consumption could be improved considering the various processing stages of cultivation,
vinification and bottling.
2. Methodological Approaches
2.1. Water Footprint (WF)
The WF concept was first introduced by Α.Υ. Hoekstra in 2002, at the University of Twente, Netherlands. This
is an alternative indicator that measures the freshwater consumption and refers to the total volume of freshwater
consumed in the production of a product or a service. The water footprint may also be calculated for a
consumer, a country, a company or a particular geographical region. In particular, in case of products WF is
calculated as the sum of the total volume of freshwater (direct or indirect) consumed during the different process
steps. The main goal of WF is to find ways of connecting human consumption with water use and world trade
with water resources management. The WF is usually expressed in units of water per unit of product (m3/ton) or
in units of water per unit of time (m3/yr) and refers exclusively to the use of freshwater. The calculation may be
based on two methodologies that have been proposed respectively by Hoekstra & Chapagain [9] and Ridoutt &
Pfister [10]. According to Hoekstra et al. (2011) [11] WF has three components [volume/time]:
−
Blue WF (WFproc, blue) is defined as the consumption of blue water which refers to fresh surface or
groundwater resources. By consumption meant the loss of water as evaporation, incorporation into a
product, transfer to another basin, or return to the same basin in a different time period.
WFproc, blue = BlueWaterEvaporation + BlueWaterIncorporation + LostReturnflow
−
Green WF (WFproc, green) is defined as the consumption of green water which refers to the volume of
rainwater during the production process that does not run off or recharges the groundwater but it is
stored in the soil or temporarily stays on top of the soil or vegetation.
WFproc, green = GreenWaterEvaporation + GreenWaterIncorporation
−
(1)
(2)
Grey WF (WFproc,grey) is defined as the consumption of grey water which refers to the volume of
freshwater that is required to assimilate the load of pollutants based on natural background
concentrations and existing ambient water quality standards.
WFproc, grey = L / (cmax –cnat)
(3)
2.2. Life Cycle Analysis
LCA is a methodological approach used to estimate the environmental aspects and potential impacts associated
with a product or a process through an inventory analysis (inputs and outputs of the system), an impact
assessment (evaluation of the environmental impacts of inputs and outputs) and an interpretation (interpreting
the results of the inventory and impact assessment in relation to the objectives of the study). The environmental
impacts refer specifically to general categories such as climate change, eutrophication, acidification, human
health, ecosystem quality, resources etc [12].
The LCA studies include all life cycle stages for a product or service. Briefly these stages can be summarized as
follows [12]:
−
−
−
−
−
Design of the product
Production and processing of raw materials
Production of packaging materials
Product manufacturing
Transportation
2
−
−
Consumption
Waste management
LCA has been proved to be a useful tool for industries to obtain a sustainable development. LCA studies not
only measure the various environmental impacts but also identify activities within the life cycle of a product that
have a significant contribution to the system and the final product. By identifying these activities named
“hotspots”, industries could make the necessary adjustments with respect to infrastructure facilities, location,
materials and even technological alternatives in order to improve their environmental performance.
3. Estimation process
3.1. WF Estimation
Primarily, a water footprint assessment has been conducted in order to estimate the freshwater consumption
through the operational and supply-chain stages of the production. The following method was the one proposed
by Ridoutt and Pfister (2009) [10] that excludes the green component of WF from the calculations.
Initially supply-chain WF (WFS-C) was calculated including WF of primary crops, WF of glass bottles and WF
of paper packaging products. The WF of primary crops was calculated with the respect to the distinction
between blue and grey components and the location of the vineyard (choice of the typical WSI according to
Pfister et al. [13]). As far as the other two WFs data from the literature were used [14, 15].
Then, operational WF (WFOP) was calculated including business WF that refers to the total volume of
freshwater consumed or polluted due to its own operations. In order to estimate grey component, literature data
were used [16].
3.2. Impact Assessment
Thereafter the results from the above mentioned water footprint assessment were inserted in the LCA, with
additional data concerning land use, pollutants concentrations etc, in order to carry out the impact assessment
for the industry. Via this process the grey component of WF was estimated. The used LCA software was
“OpenLCA” created by GreenDelta, 2006. The main structural components of the program are [17-20]:
−
−
−
−
−
−
−
−
−
Sources are references to literature and databases.
Actors can be persons or organizations, the users of the system that edit and modify the data.
Unit groups comprise units of similar types (e.g. length-related units).
Flows are streams of substances and there are three flow types: elementary, product, waste.
Flow properties are characteristics of the flows (mass, length, time, volume).
Processes comprise flows as inputs and outputs.
LCIA methods are needed for the impact calculation.
Product systems are networks of processes that model and calculate case studies.
Projects give the opportunity to the user to compare different systems.
4. Case study
4.1. General data
This study focuses on the estimation of water footprint through LCA for the production of wine. The analyzed
vineyard and wine producer is a small-size industry in Polydrosos, Greece whose yearly production is 147560lt
of wine or ≈197000 bottles (750ml). The total area under vines is around 280 hectares, which is enough to meet
the annual demand for wine exclusively from private vineyards, with an average yield 850kg per hectare.
Thanks to the ideal soil and climate conditions in the region both indigenous (Mavroudi Arachovis, the local
variety Asprouda, the classic variety of Santorini Assyrtiko and aromatic Malagouzia) and international
(Sauvignon Blanc, Chardonnay, Merlot, Cabernet Sauvignon and Pinot Noir) varieties of vine are growing. The
location of the vineyard is important for the calculation of WF due to the strong association between location
3
and water scarcity. Local scarcity is described by the Water Stress Index (WSI) whose value for the area of
interest corresponds to WSIloc = 0,451 and the average national WSI for Greece is calculated equal to 0,319 [18].
Figure 1. Representation of the water stress index [13]
4.2. Assumptions and limitationsIn this study due to lack of information critical assumptions and limitations in
the analysis were considered such as [18]:
−
−
−
−
−
−
The analysis stops at the level of industrial processing (bottling and packaging) of the product. It does
not take into account the transportation and distribution phases of final product.
No WF account was taken associated to industry’s’ infrastructure.
No WF account was taken for raw materials such as cork, glue, paper for the label and some additional
products used for filtering in the winemaking process (NaOH, SO2) due to lack of data.
The use of pesticides was not taken into account.
The energy consumption of the industry is not considered.
The data for water consumption through the production of glass bottles and cartons were obtained from
the literature and they do not refer to the exact products used in the small wine industry under study.
4.3. Procedures
The integration of LCA into this study was obtained through a product system that includes all procedures and
materials. The main procedures for this analysis are the following:
−
−
−
−
Cultivation
Vinification
Creation of packaging materials
Final product
The qualitative and quantitative data of the analysis are grouped by process and are presented in Figure 2 and
Table 1.
4
Table 1. Input and Output flows grouped by process [18]
INPUT
OUTPUT
FLOW
VALUE
UNIT
FLOW
VALUE
UNIT
Occupation,
arable
279740
m2*a
Grapes
238370
Kg
Phosphorus
2758
Kg
Water,
ground
344275230
Kg
Potassium
3349
Kg
Grapes
238370
Kg
Wine
147,75
m3
Water,
ground
1440070
Kg
Nitrogen
5,23035
Kg
Sulfur
dioxide
11,08125
Kg
Phosphorus
5,23035
Kg
Sodium
hydroxide
240,34
Kg
BOD5
3,31157
Kg
Glass
104410
Kg
Total
packaging
197000
Item(s)
Paper
15760
Kg
Water,
ground
451130
Kg
Total
packaging
197000
Item(s)
Final
Product
197000
Item(s)
Wine
147,75
m3
CULTIVATION
VINIFICATION
CREATION OF
PACKAGING
MATERIALS
FINAL
PRODUCT
5
Figure 2. Final system grouped by processes
5. Results Analysis
Considering the Ridoutt & Pfister approach [10] the WF for a full production line of the winery was calculated
as shown in Τable 2.
Table 2. WF calculation for a full production line [18]
BLUE
WFS-C (m3)
GREY
WFS-C
(m3)
141583,076
101930,69
BLUE
WFOP
(m3)
59,02
GREY
WFOP
(m3)
958,16
TOTAL
VOLUME
(m3)
244530,94
WSIloc
0,451
WSInat
0,319
WFEQUIVELANT
(m3)
345716,16
The results from the water footprint assessment indicated the huge difference amongst the values of the
operational and supply-chain water footprint. Most of the water used during production (99,6% of the total WF)
is related to the supply-chain water consumption and only 0,4% to the operational one. The analysis showed that
the selection and origin of raw materials need to be considered prior in order to achieve an optimal water
resources management plan of a region.
Thereafter the above mentioned results were used as primary data in LCA. For the purposes of this paper LCIA
method of Eco-Indicator 99 was chosen which is adequate and appropriate for product development applications
and specifically in this case for the winery as it provides a clear and simple approach to different environmental
effects. The Eco-Indicator 99 method groups the results in three key impact categories: a) human health, b)
ecosystem quality and c) resources. The unit of measurement of the impact is the «point» or as otherwise stated
in the literature «eco-point». In order to estimate the ultimate effect that Eco-Indicator 99 gives for each product
in each impact category, the weight of each raw material has to be multiplied to the value of the Eco-Indicator
99 and thus leads to the corresponding «eco-points». The more «eco-points» are calculated for a process the
more negative impact for the environment is estimated. The value of each «eco-point» represents one
thousandth (1/1000) of the annual environmental load caused by an average European citizen. The
characterization results grouped by process are shown in Table 3.
6
PROCESSES/IMPACTS
Table 3. Characterization results [18]
FULL PRODUCTION
HUMAN
HEALTH
ECOSYSTEM QUALITY
Respiratory
effects
Acidification &
Eutrophication
Land
occupation
CULTIVATION
0
0
25110
25110
VINIFICATION
PRODUCTION
OF
PACKAGING
MATERIALS
FINAL
PRODUCT
15,699
0,899
0
16,598
0
0
0
0
0
0
0
0
TOTAL
The characterization results showed that:
−
−
−
−
−
−
−
−
−
The vinification affects the categories of “human health” and “ecosystem quality” and specifically to
the sub categories of “respiratory effects” and “acidification & Eutrophication”.
As regards the ecosystem quality, the overall effects are mainly due to the cultivation (“land
occupation” = 25110).
With regard to human health, the product impacts on respiratory effects only through the vinification
process.
The total impact assessment showed that the cultivation process is the one that affects the system the
most.
The production affects more negatively on land occupation (25110 points). This is expected since the
wine production requires a large area for the cultivation of vineyards.
The small negative effect calculated in category “acidification and eutrophication” (0,899 points) is
explained due to limited use of fertilizers and also the analysis research did not considered pesticides
application.
The effects on human health is also limited (15,699 points) and only refer to the respiratory effects.
These results are justified because the study took into account only some additives in winemaking that
negatively impact. Also the transportation phase was excluded that may significantly contribute in air
emissions and energy consumption.
The processes “production of packaging materials” and “final product” seemingly do not have impacts
on any of the above mentioned categories. This is happening due to the lack of data and the small
amount of water that is being used through the production of paper and glass and through bottling
phase.
Finally, the overall effect is estimated equal to 25126,598 points corresponding to approximately
25,127 times the total annual environmental load of an average European citizen. This is an
approximately small impact regarding the lack of information mainly about the pesticides and energy
consumption that limit the research.
7
6. Conclusions
In conclusion, LCA application could be used to identify potential risks and hotspots in production which should
be investigated further. Nowadays a large number of industries and companies that are interested in optimal
production management and sustainable development use LCA as a tool in order to achieve their goals. The
LCA applications can be used not only in case of water management but also in every aspect of the production
process. Specifically this case study showed through the calculations of the supply-chain WF and operational
WF that the identification of crop and other raw materials origin such as glass, paper and fertilizers is really
important in order to develop strategies to optimize impacts on water management. However it is crucial for
researchers to include all available data and as far as cultivation is concerned (the process that affects most the
system) the use of pesticides has to be considered due to their high impact on water and soil quality. Precisely,
for the wine production the amount of water used for the full production is mainly consumed in the cultivation
phase and to a very small percentage in the creation of packaging materials and during vinification phase.
Therefore the phase of cultivation is a “hotspot” for water in the production process and this underlines the
importance of formulating new rural policies.
References
1.
2.
3.
4.
5.
6.
7.
8.
9.
10.
11.
12.
13.
14.
Chapagain A.K., Hoekstra A.Y., Savenije H.H.G., Gautam R., The water footprint of cotton
consumption: An assessment of the impact of worldwide consumption of cotton products on the water
resources in the cotton producing countries, Ecological Economics, 60 (2006) 186-203.
Mekonnen M.M., Hoekstra A.Y., A global and high-resolution assessment of the green, blue and grey
water footprint of wheat, Hydrology and Earth System Sciences, 14 (2010) 1259-1276.
Chapagain A.K., Hoekstra A.Y., The blue, green and grey water footprint of rice from production and
consumption perspectives, Ecological Economics, 70 (2011) 749-758.
Chapagain A.K., Hoekstra A.Y., The water footprint of coffee and tea consumption in the Netherlands,
Ecological Economics, 64 (2007) 109-118.
Aldaya M.M., Hoekstra A.Y., The water needed for Italians to eat pasta and pizza, Agricultural
Systems, 103 (2010) 351-360.
Ercin A.E., Aldaya M.M., Hoekstra A.Y., Corporate Water Footprint Accounting and Impact
Assessment: The Case of the Water footprint of a Sugar – Containing Carbonated Beverage, Water
Resource Manage, 25 (2011) 721-741.
Jefferies D., Munoz I., Hodges J., King V.J., Aldaya M., Ercin A.E., Mila I Canals L., Hoekstra A.Y.,
Water Footprint and Life Cycle Assessment as approaches to assess potential impacts of products on
water consumption. Key learning points from pilot studies on tea and margarine, Journal of Cleaner
Production, 33 (2012) 155-166.
Ene S.A., Teodosiu C., Robu B., Volf I., Water footprint assessment in the wine making industry: A
case study for a Romanian medium size production plant, Journal of Cleaner Production, 43 (2012) 122135.
Hoekstra A.Y., Chapagain A. K., Water footprints of nations: Water used by people as a function of
their consumption patterns, Water Resources Management, 21 (2007) 35-48.
Ridoutt B.G., Pfister S., A revised approach to water footprint to make transparent the impacts of
consumption and production on global freshwater scarcity, Global Environmental Change, 20 (2009)
113-120.
Hoekstra A.Y., Chapagain A.K., Aldaya M.M., Mekonnen M.M., The Water Footprint Assessment
Manual - Setting the Global Standard, Erthscan Publications, London, Washington DC, 2011.
Ampeliotis Κ., Environmental life cycle assessment of a bottle of wine, Agriculture Livestock, 10
(2010) 67-69, (in greek).
Pfister S., Koehler A., Hellweg S., Assessing the Environmental Impacts of Freshwater Consumption in
LCA, Environ. Sci. Technol., 43 (2009) 4098-4104
Papadakis G., Stefanoudakis M, Fatta D: Life cycle assessment (LCA) as a decision support tool (DST)
for the ecoproduction of olive oil. Research program Ecoil, University of Crete, University of Cyprus,
8
15.
16.
17.
18.
19.
20.
LEIA Foundation. http://www.ecoil.tuc.gr/Task%201_ReportLCA%20SUMMARYgreek.pdf (2005)
(last accessed 20/03/2013).
Tsatsis D.E., Environmental impact analysis of recycled packaging papers (and energy and waste
management), Master Diploma Thesis, National Technical University of Athens, (2008) 247. (in greek)
Bustamenre M.A., Paredes C., Moral R., Moreno-Caselles J., Perez-Espinosa A., Perez-Murcia M.D.,
Uses of winery and distillery effluents in agriculture: characterisation of nutrient and hazardous
components, Water science and Technology, 51 (2005) 145-151.
Rebitzer G., Ekvall T., Frischknecht R., Hunkeler D., Norris G., Rydberg T., Schmidt W.-P., Suh S.,
Weidema B.P., Pennington D.W., Life cycle assessment – Part 1: Framework, goal and scope definition,
inventory analysis, and applications, Environment International, 30 (2004) 701-720.
Koutantelia S.V., Life Cycle Assessment as a Calculation Method for Water Footprint of Industrial
Activity: The Case of Vinification, Diploma Thesis, School of Rural and Surveying Engineering
National Technical University of Athens, (2013) 106. (in greek)
Xatzikuriakou T., Impact Assessment of eco-industrial park via Life Cycle Analysis, Diploma Thesis,
School of Rural and Surveying Engineering National Technical University of Athens, (2013) 120. (in
greek)
GreenDelta: OpenLCA Help. http://www.openlca.org/documentation/index.php/OpenLCA_Help (2011)
(last accessed 20/05/2013).
9


© Copyright 2026