
Download PDF
SUDAN Rural Livelihood Profiles for Eastern, Central, and Northern Sudan January 2015 MAP OF LIVELIHOOD ZONES IN SUDAN FEWS NET Washington [email protected] www.fews.net FEWS NET is a USAID-funded activity. The content of this report does not necessarily reflect the view of the United States Agency for International Development or the United States government. i January 2015 SUDAN Livelihood Profiles TABLE OF CONTENTS Map of Livelihood Zones in Sudan ................................................................................................................................................ i Acknowledgments ....................................................................................................................................................................... v Acronyms and Abbreviations ....................................................................................................................................................... v A Summary of the Household Economy Approach ...................................................................................................................... 1 The Household Economy Approach in Sudan .............................................................................................................................. 2 Overview of Rural livelihoods in Eastern, Central, and Northern Sudan ..................................................................................... 4 Northern Riverine Small‐scale Cultivation (Zone 1) ..................................................................................................................... 8 Determinants of wealth ........................................................................................................................................................... 9 Sources of food and cash and expenditures ............................................................................................................................ 9 Primary food, cash, and expenditure cycle for poor households .......................................................................................... 11 Hazards and coping ............................................................................................................................................................... 11 Southern Riverine Small/Medium‐scale Cultivation (Zone 2) .................................................................................................... 12 Determinants of wealth ......................................................................................................................................................... 13 Sources of food and cash and expenditures .......................................................................................................................... 13 Primary food, cash, and expenditure cycle for poor households .......................................................................................... 14 Hazards and coping ............................................................................................................................................................... 15 Eastern Pastoral (Zone 3) ........................................................................................................................................................... 16 Determinants of wealth ......................................................................................................................................................... 16 Sources of food and cash and expenditures .......................................................................................................................... 17 Primary food, cash, and expenditure cycle for poor households .......................................................................................... 18 Hazards and coping ............................................................................................................................................................... 18 Eastern Khors Agropastoral (Zone 5) ......................................................................................................................................... 20 Determinants of wealth ......................................................................................................................................................... 21 Sources of food and cash and expenditures .......................................................................................................................... 21 Primary food, cash, and expenditure cycle for poor households .......................................................................................... 22 Hazards and coping ............................................................................................................................................................... 22 Coastal Fishing (Zone 6) ............................................................................................................................................................. 24 Determinants of wealth ......................................................................................................................................................... 25 Sources of food and cash and expenditures .......................................................................................................................... 25 Primary food, cash, and expenditure cycle for poor households .......................................................................................... 26 Hazards and coping ............................................................................................................................................................... 26 Eastern Agropastoral Sorghum (Zone 7) .................................................................................................................................... 28 Determinants of wealth ......................................................................................................................................................... 29 Sources of food and cash and expenditures .......................................................................................................................... 29 Primary food, cash, and expenditure cycle for poor households .......................................................................................... 30 Hazards and coping ............................................................................................................................................................... 30 Flood‐retreat Cultivation (Zone 8) ............................................................................................................................................. 32 Determinants of wealth ......................................................................................................................................................... 33 Sources of food and cash and expenditures .......................................................................................................................... 33 Primary food, cash, and expenditure cycle for poor households .......................................................................................... 35 Hazards and coping ............................................................................................................................................................... 35 Central Irrigated Schemes (Zone 9) ........................................................................................................................................... 36 Determinants of wealth ......................................................................................................................................................... 37 Sources of food and cash and expenditures .......................................................................................................................... 37 Primary food, cash, and expenditure cycle for poor households .......................................................................................... 38 Hazards and coping ............................................................................................................................................................... 39 Southeast Rainfed Semi‐mechanized Agriculture (Zone 10) ..................................................................................................... 40 Determinants of wealth ......................................................................................................................................................... 41 Sources of food and cash and expenditures .......................................................................................................................... 41 Primary food, cash, and expenditure cycle for poor households .......................................................................................... 42 Hazards and coping ............................................................................................................................................................... 43 Famine Early Warning Systems Network ii January 2015 SUDAN Livelihood Profiles Annex 1: Cost Structure for Agriculture ..................................................................................................................................... 45 Annex 2: List of Fieldwork Participants ...................................................................................................................................... 46 LIST OF FIGURES Figure 1 Map of population density in Sudan .............................................................................................................................. 4 Figure 2 Seasonal calendar for the Northern Riverine Small‐scale Cultivation Zone .................................................................. 8 Figure 3 Food sources by wealth group, Northern Riverine Small‐scale Cultivation Zone ........................................................ 10 Figure 4 Cash income sources by wealth group, Northern Riverine Small‐scale Cultivation Zone ........................................... 10 Figure 5 Allocation of expenditures by wealth group, Northern Riverine Small‐scale Cultivation Zone ................................... 10 Figure 6 Food access calendar for poor households in the Northern Riverine Small‐scale Cultivation Zone ........................... 11 Figure 7 Seasonal calendar for the Southern Riverine Small/Medium‐scale Cultivation Zone ................................................. 12 Figure 8 Food sources by wealth group, Southern Riverine Small/Medium‐scale Cultivation Zone ......................................... 14 Figure 9 Cash income sources by wealth group, Southern Riverine Small/Medium‐scale Cultivation Zone ............................ 14 Figure 10 Allocation of expenditures by wealth group, Southern Riverine Small/ Medium‐scale Cultivation Zone ................. 14 Figure 11 Food access calendar for poor households in the Southern Riverine Small/Medium‐scale Cultivation Zone .......... 15 Figure 12 Seasonal calendar for the Eastern Pastoral Zone ...................................................................................................... 16 Figure 13 Food sources by wealth group, Eastern Pastoral Zone .............................................................................................. 17 Figure 14 Cash sources by wealth group, Eastern Pastoral Zone .............................................................................................. 17 Figure 15 Allocation of expenditures by wealth group, Eastern Pastoral Zone ......................................................................... 18 Figure 16 Food access calendar for poor households in the Eastern Pastoral Zone ................................................................. 18 Figure 17 Seasonal calendar for the Eastern Khors Agropastoral Zone ..................................................................................... 20 Figure 18 Food sources by wealth group, Eastern Khors Agropastoral Zone ............................................................................ 21 Figure 19 Cash sources by wealth group, Eastern Khors Agropastoral Zone ............................................................................. 21 Figure 20 Allocation of expenditures by wealth group, Eastern Khors Agropastoral Zone ....................................................... 22 Figure 21 Food access calendar for poor households in the Eastern Khors Agropastoral Zone ................................................ 23 Figure 22 Seasonal calendar for the Coastal Fishing Zone ......................................................................................................... 24 Figure 23 Food sources by wealth group, Coastal Fishing Zone ................................................................................................ 25 Figure 24 Cash sources by wealth group, Coastal Fishing Zone................................................................................................. 25 Figure 25 Allocation of expenditures by wealth group, Coastal Fishing Zone .......................................................................... 26 Figure 26 Food access calendar for poor households in the Coastal Fishing Zone .................................................................... 26 Figure 27 Seasonal calendar for the Eastern Agropastoral Sorghum Zone ............................................................................... 28 Figure 28 Food sources by wealth group, Eastern Agropastoral Sorghum Zone ....................................................................... 30 Figure 29 Cash sources by wealth group, Eastern Agropastoral Sorghum Zone ....................................................................... 30 Figure 30 Allocation of expenditures by wealth group, Eastern Agropastoral Sorghum Zone .................................................. 30 Figure 31 Food access calendar for poor households in the Eastern Agropastoral Sorghum Zone .......................................... 31 Figure 32 Seasonal calendar for the Flood‐retreat Cultivation Zone ......................................................................................... 32 Figure 33 Food sources by wealth group, Flood‐retreat Cultivation Zone ................................................................................ 34 Figure 34 Cash sources by wealth group, Flood‐retreat Cultivation Zone ................................................................................. 34 Figure 35 Allocation of expenditures by wealth group, Flood‐retreat Cultivation Zone ........................................................... 34 Figure 36 Food access calendar for poor households in the Flood‐retreat Cultivation Zone .................................................... 35 Figure 37 Seasonal calendar for the Central Irrigated Schemes Zone ....................................................................................... 36 Figure 38 Food sources by wealth group, Central Irrigated Schemes Zone .............................................................................. 38 Figure 39 Cash sources by wealth group, Central Irrigated Schemes Zone ............................................................................... 38 Figure 40 Allocation of expenditures by wealth group, Central Irrigated Schemes Zone ......................................................... 38 Figure 41 Food access calendar for poor households in the Central Irrigated Schemes Zone .................................................. 39 Figure 42 Seasonal calendar for the Southeast Rainfed Semi‐mechanized Agriculture Zone ................................................... 40 Figure 43 Food sources by wealth group, Southeast Rainfed Semi‐mechanized Agriculture Zone .......................................... 42 Figure 44 Cash sources by wealth group, Southeast Rainfed Semi‐mechanized Agriculture Zone ........................................... 42 Figure 45 Allocation of expenditures by wealth group, Southeast Rainfed Semi‐mechanized Agriculture Zone ..................... 42 Figure 46 Food access calendar for poor households in the Southeast Rainfed Semi‐mechanized Agriculture Zone .............. 43 LIST OF TABLES Table 1 Determinants of wealth in the Northern Riverine Small‐scale Cultivation Zone ............................................................ 9 Famine Early Warning Systems Network iii January 2015 SUDAN Livelihood Profiles Table 2 Determinants of wealth in the Southern Riverine Small/Medium‐scale Cultivation Zone ........................................... 13 Table 3 Determinants of wealth in the Eastern Pastoral Zone .................................................................................................. 17 Table 4 Determinants of wealth in the Eastern Khors Agropastoral Zone ................................................................................ 21 Table 5 Determinants of wealth in the Coastal Fishing Zone .................................................................................................... 25 Table 6 Determinants of wealth in the Eastern Agropastoral Sorghum Zone ........................................................................... 29 Table 7 Determinants of wealth in the Flood‐retreat Cultivation Zone .................................................................................... 33 Table 8 Determinants of wealth in the Central Irrigated Schemes Zone ................................................................................... 37 Table 9 Determinants of wealth in the Southeast Rainfed Semi‐mechanized Agriculture Zone ............................................... 41 Famine Early Warning Systems Network iv SUDAN Livelihood Profiles January 2015 ACKNOWLEDGMENTS The livelihood profiling and assessment and this report were led by James Acidri of Evidence for Development (EfD), with technical support from Abdulrahim Norein of the Famine Early Warning Systems Network (FEWS NET) in collaboration with its partners; the Food Security Technical Secretariat (FSTS) of Sudan’s Federal Ministry of Agriculture and Irrigation (FMoAI), the United States Agency for International Development (USAID) Office of Food for Peace (Food Aid) (FFP), the Ministry of Agriculture and Animal Resources of Al Qadarif, Kassala, Red Sea, Gazeira, Blue Nile, White Nile, Sinnar, River Nile, and Northern states and state‐level staff of FSTS and the Food Security Policy and Strategy (FSPS) project. Special thanks are extended to team members Fatima Elhassan Eltahir, Wafaa Badawi, Salma Rashid, Lemia M. Elhag, Aziza Eltayeb Osman, and Suheir Khalafalla, whose support and contributions made possible the development of the livelihood profiles in Sudan. Finally, we thank all community members who participated in the fieldwork and data collection, which made it possible to produce this livelihood profile analysis. This product will form part of the knowledge base for the Government of Sudan (GoS), FMoAI/FSTS, and FEWS NET’s food security monitoring activities in Sudan. ACRONYMS AND ABBREVIATIONS EfD Feddan FEWS NET FFP FMoAI FSTS FSWG GoS Ha HAC HEA Hh IDP NGO SCF (UK) SDG USAID Evidence for Development Unit of land area equivalent to approximately 1 acre or 0.42 hectares Famine Early Warning Systems Network Office of Food for Peace Federal Ministry of Agriculture and Irrigation Food Security Technical Secretariat Food Security Working Group Government of Sudan Hectare Humanitarian Aid Commission Household Economy Approach Household Internally displaced person Nongovernmental organization Save the Children Fund United Kingdom Sudanese Pound United States Agency for International Development Famine Early Warning Systems Network v January 2015 SUDAN Livelihood Profiles A SUMMARY OF THE HOUSEHOLD ECONOMY APPROACH The standard Household Economy Assessment (HEA) is a livelihood‐based framework for analyzing the ways people access the things they need to survive and maintain their livelihood. It helps to determine people’s food and nonfood needs and to identify appropriate means of assistance, whether short‐term emergency assistance or longer‐term development programs or policy changes. It is important to note that the HEA is an analytical framework, not a specific method of data collection. It defines the data that need to be collected and the way in which they should be analyzed to answer a particular set of questions. It is a framework for organizing a vast array of information – some of which is local knowledge, some of which is census data, some of which is crop production data, and so on. The HEA functions as a powerful way to make practical use of both existing secondary sources of information and primary information. The HEA defines a livelihood zone as a geographic area in which households obtain their basic survival needs, notably food and cash income, in relatively similar ways. This means that within a livelihood zone, socioeconomic groupings and asset bases tend to be similar, as are consumption patterns. These similarities apply to both good and bad years, in that household groups’ coping strategies in response to shocks are also relatively similar within the same livelihood zone. The livelihood profiles presented herein for Sudan explore key characteristics of the socioeconomic status and livelihood strategies of three wealth groups (the poor, middle, and better‐off) for each livelihood zone within Al Jazirah, Al Qadarif, Kassala, Sinnar, Blue Nile, White Nile, Red Sea, Northern, and River Nile states. The profiles provide detailed, quantitative information about livelihood strategies, including food and income sources and expenditures, for each of the three wealth groups, with particular attention to the poor. In addition, the livelihood zones most at risk of food insecurity are identified in the “Overview of Rural Livelihoods in Eastern, Central, and Northern Sudan.” Livelihood profiles facilitate analysis and monitoring of livelihood and food security. They provide a geographic context for establishing monitoring systems (a sampling frame) and for interpreting the relative importance of existing monitoring data on production, prices, and other indicators. They are points of reference against which conditions observed during monitoring may be compared. They also describe how livelihood and food security may be affected by production and other shocks. For more information about HEA principles and analysis, visit the livelihood pages at http://www.fews.net or download “Application of the Livelihood Zone Maps and Profiles for Food Security Analysis and Early Warning.” Famine Early Warning Systems Network 1 SUDAN Livelihood Profiles January 2015 THE HOUSEHOLD ECONOMY APPROACH IN SUDAN In the late 1990s, Save the Children Fund (SCF) United Kingdom (UK) in association with the Government of Sudan (GoS) Humanitarian Aid Commission (HAC) used the HEA in North Darfur for drought assessment and estimation of food needs. This generated considerable support for livelihood‐based food security analysis within Sudan, and, between 2006‐2009, the HAC conducted livelihood zoning and profiling in the states of North Kordofan, some parts of West Darfur, Kassala, and Red Sea. In 2011, FEWS NET organized a national livelihood zoning workshop in Khartoum. The result was an updated national livelihood zone map that divided Sudan into 19 zones, with a limited amount of additional information broadly describing seasonality and key sources of food and income. The livelihood zones identified were very large, and their boundaries were not verified as a part of the exercise. Following the 2011 Khartoum livelihood zoning workshop, the GoS Food Security Technical Secretariat (FSTS) conducted more livelihood zoning work, identifying additional zones in North Kordofan, Red Sea, and Kassala states. In December 2012, FEWS NET hosted a one‐day workshop in Khartoum to assess the perceived usefulness of livelihood zone maps and livelihood profiles to the Sudanese food security community. FEWS NET consulted with a wide range of technical partners, including the government, donors, UN agencies, and nongovernmental organizations (NGOs). Partners expressed demand for these products to inform food security early warning, as a sampling frame for surveys, for the assessment of Internally Displaced Persons (IDPs) and resettlement options, and for other developmental applications. Several protracted displacements in Sudan necessitated more detailed livelihood information for effective resilience programming. Partners also identified the need for verification of current 2011 livelihood zone boundaries. In 2014, FEWS NET and partners continued the rapid livelihood profiling method in nine additional livelihood zones of eastern, central, and northern Sudan. Unfortunately, complete national coverage with this method was not possible due to civil insecurity at the time. The development of the profiles described here used the following approach: FEWS NET and partners divided into two field teams to carry out the fieldwork and analysis over a period of approximately 23 working days. The field teams met with a small group of key informants in each state, drawn mainly from the state‐level Food Security Working Group (FSWG). With this group, the teams arranged security and logistics permissions, verified livelihood boundaries, identified any potential variations in the household economy within each zone, and identified the most “typical” and accessible districts and villages within the zone for village‐level interviews. In each locality (mahaliyah), the field team (FEWSNET and partners) met with two to four key informants, including the locality’s agricultural officer. The key informants further verified the boundaries of the livelihood zones obtained at the state level and directed teams to villages meeting security and “typicalness” criteria. They also helped to mobilize village‐level key informants for interviews. In 2014, FEWS NET visited the following localities: o Al Qadarif, Wasat (rural), Al Gurresha, Galaa Alnahal, Elhawata, Wad Alhelew, Alrawat, Al Tadamon, and Abu Hogar localities in the Southeast Rainfed Semi‐mechanized Agriculture Zone; o Al Butana, Talkuk, Al Girab, and Rufaa localities in the Eastern Agropastoral Sorghum Zone; o Halfa‐ Elgadida, River Atbara (rural), Umalgora, Sinnar, and Al Mangil localities in the Central Irrigated Schemes Zone; o Aroma (rural), North Delta (rural), and Dordiab localities in the Eastern Pastoral Zone; o Aroma (rural), North Delta (rural), Agig, and Tokar localities in the Flood‐retreat Cultivation Zone; o Haya and Sinkat localities in the Eastern Khors Agropastoral Zone; o Swakin and Gabiet Elmaadin localities in the Coastal Fishing Zone; o Golli, Aldeesa, Abuhujar, Aljabalain, Medani, and Kosti localities in the Southern Riverine Small/Medium‐ scale Cultivation Zone; and o Al Damir, Barbar, Wadi Halfa, Dongola, and Marawi localities in the Northern Riverine Small‐scale Cultivation Zone. Famine Early Warning Systems Network 2 January 2015 SUDAN Livelihood Profiles Field teams quantified food and income sources and expenditures by wealth group during the village‐level interviews. Two to eight villages were interviewed per livelihood zone. The number of villages interviewed per livelihood zone depended on time available, as well as the size of the zone and its population; more villages were sampled in larger zones and fewer in smaller or less populous zones. However, FEWS NET aimed for a minimum standard of four villages per livelihood zone. All information was collected from key informant interviews. Teams did not have time for key informants to assemble for focus groups and insufficient experienced interviewers were available per team to conduct wealth group focus groups. As such, roughly ten village‐level key informants comprising the chairperson of the popular village committee, local community leaders, and members of farmers’ and women’s groups were asked to: o Describe living conditions during the reference year across all livelihood zones (October to September 2011/12 for the 2013 North Kordofan exercise and 2012/13 for the 2014 exercise in other states; for some states, the start and end months varied due to differences in consumption years); o Identify and define wealth group characteristics (proportion of households, number of people per household, and assets of each wealth group); o Quantify income and food sources and typical expenditures for each wealth group; o Describe market flows for key commodities relevant to the zone; o Define seasonal and consumption calendars; and o Identify common hazards and coping strategies. Data collected in the field were entered into Excel spreadsheets and analyzed by the field teams with the support of livelihood experts. Finally, FEWS NET prepared draft livelihood profiles, submitted them for review to field teams and other key informants in Sudan, incorporated comments, and published the documents. A number of clarifications and caveats apply to the livelihood profiles that follow. Field teams used the previous consumption year as the reference year. While the 2013 North Kordofan assessments reference 2011/12, a somewhat typical year, the 2014 assessments reference the 2012/13 consumption year, during which rainfall, agricultural production, and pasture/browse and water availability were significantly above average. As a result, it is likely that agriculture appears more important than usual, and some typical income‐generating activities may appear less important in the 2014 profiles than might usually be the case. The 2012/13 reference year was chosen despite its unusual characteristics to facilitate communication and recall for key informants. Similarly, most interviews referenced an October to September consumption year. However, some zones, such as Coastal Fishing, had a different start and end month of the reference year. The percent of total kilocalorie requirements presented in this report is based on the international standard average kilocalorie requirement for a population, or 2,100 kilocalories per person per day. The annual cash income is presented per typical household per consumption year in Sudanese Pounds (SDG). Meals consumed outside the home by a household member were not considered in the analysis. The rapid nature of the interviews puts emphasis on the most significant food and income sources. This de‐emphasizes relatively smaller sources of food and income, such as wild food consumption, which may be more important in some zones than the profiles suggest. Due to their close proximity and strong infrastructure connections, markets referencing Khartoum may refer simultaneously to Khartoum and Omdurman. Famine Early Warning Systems Network 3 SUDAN Livelihood Profiles January 2015 OVERVIEW OF RURAL LIVELIHOODS IN EASTERN, CENTRAL, AND NORTHERN SUDAN The majority of the eastern, central, and northern regions of Sudan are vast plains traversed by the northward‐flowing Nile River and its tributaries. Widely separated mountain chains and many hilly areas often reach altitudes of more than 2,000 meters (6,500 feet), with the highest altitudes in eastern Red Sea state. The northern region is mainly a desert, with rock at or near the surface covered by thin soils of low fertility. The undulating, sandy wastes of the western and central desert merge into the Red Sea Hills to the east. Natural harbors exist at Port Sudan (Bur Sudan) and Swakin in the Red Sea. The eastern part of Sudan is characterized by clay plains, divided between desert, semidesert, and light savannah, inclusive of the famous Al Butanah, an undulating pastureland between Khartoum and Kassala states that provides good seasonal grazing for cattle, sheep, and goats. East of Al Butanah is a peculiar geological formation known as the Qash Delta. Three main geographical factors influence livelihoods in the eastern, central, and northern regions of Sudan: The central and eastern clay plains around the Blue Nile River and flanked by the White Nile River are the backbone of Sudan's agricultural economy because they are highly productive. At the heartland of these clay plains is the Gezira Irrigation Scheme known for high‐quality cotton production. This area is characterized by large‐scale irrigated agriculture. Mechanized, rainfed agriculture dominates the banks of the Blue Nile. Meanwhile, west of the White Nile, most crops are cultivated manually. Rainfall patterns as well as winter and summer seasons provide a variety of production systems. Rainfall is generally highly variable between years. With some variation by zone, rain generally falls between June and October, with higher rainfall totals and more reliable rainfall in the south and progressively lower totals with more interannual variability moving northward. Blue Nile state in the south receives the most rainfall at approximately 600‐800 mm per year, sufficient to rely primarily on rainfed agriculture. Rainfall is 400‐600 mm per year in the most easterly agropastoral areas and 100‐400 mm or less per year in the northerly desert areas of Red Figure 1 Map of population density in Sudan Sea and Northern states. Though insufficient for heavy reliance on rainfed agriculture, these rains support sufficient grass and browse for large‐scale, extensive production of sheep and goats suitable to a pastoral livelihood. The dominating Nile River formed near Khartoum by the confluence of the Blue Nile and White Nile Rivers provides riverine cultivation, especially in the central part of the country and along River Nile state to the border with Egypt. The presence of surface water, whether in the form of rivers, flood waters, “khors,” or springs issuing from underground aquifers, provides the opportunity for cultivation in the eastern and central regions of Sudan. Water is the most limited natural resource in Sudan. As such, these areas, being nearest to water, tend to provide sufficient livelihood options Source: Population Explorer. to support relatively larger population densities (Figure 1). The combination of rainfed, irrigated, and flood‐retreat cultivation allows large‐scale sorghum, millet, wheat, sesame, and animal fodder production in most years. Agricultural production in eastern, central, and parts of northern Sudan meets a Famine Early Warning Systems Network 4 January 2015 SUDAN Livelihood Profiles significant part of domestic cereal consumption requirements for both people and livestock, with significant surpluses in most years. This is particularly true of sorghum, sold in regional markets across the country. Cereal production is supplemented by vegetable and fruit production, mainly for commercial purposes. Although the eastern and central regions are considered surplus cereal‐production areas, even in years of good production, the majority of the population in these areas is poor and not self‐sufficient in food production. Poor households typically rely on markets for food for at least four to five months of the year, and sometimes longer. Significant pastoral and fishing populations in the Eastern Pastoral and Coastal Fishing zones are also net purchasers of food across all wealth groups, even in a good year. Access to cash or credit for production inputs is the primary constraint for poor households in agricultural and agropastoral areas. As such, poor households rely on seasonal agricultural employment in rainfed areas and irrigation schemes, in major urban areas (Port Sudan, Khartoum or Omdurman, Kassala, Medani, and Al Qadarif, among others), in artisanal gold mines, and among pastoralists. These employment opportunities provide cash for food purchases, which are usually greatest between May and August/September. Poorer people have few livestock, mostly small ruminants, due to their easy liquidity in times of pressing cash needs. Livelihood zones in Red Sea and parts of Kassala states have particularly limited options for income generation, and, in some cases, unpredictable incomes. As a result, the risk of food insecurity among poor households is relatively greater there than in other areas, even in years of favorable rainfall conditions. Conflict is a significant constraint to normal market and production functioning in parts of White Nile, Blue Nile, South Kordofan, and Darfur states, raising the risk of food insecurity. However, these areas were not covered during this livelihood profiling exercise. Additional modification of rapid baseline profiling techniques with logistical support from FEWS NET’s local partners will be required to cover these areas. Parts of 13 livelihood zones fall into the eastern, central, and northern regions of Sudan. Note that fieldwork for Zones 4, 13, 14, and 18, identified with an asterisk (*), was limited to villages in North Kordofan state. Profiles for North Kordofan zones, incorporated here by reference, are located in the 2013 North Kordofan Livelihood Profiles document. Key characteristics of these 13 zones follow: In the Northern Riverine Small‐scale Cultivation (Zone 1), wheat, sorghum, vegetables, and fruits are produced for consumption and sale. Large‐scale, mechanized, commercial farming of animal fodder is conducted, mainly for export. Though most households have some livestock, this is a secondary activity; cropping is most important. In the Southern Riverine Small/Medium‐scale Cultivation (Zone 2), sorghum is mainly grown for household consumption. It has dependable cash crop production, consisting mainly of fruits and vegetables such as banana, mango, lemon, and guava. Livestock raising is a secondary activity in this zone. Livestock are predominant with no cropping in the Eastern Pastoral (Zone 3). All households are heavily dependent on markets for food. Livestock holdings and sales are relatively inequitable, favoring wealthier households. The West and Central Pastoral (Zone 4)* zone is the largest, northernmost livelihood zone, spanning from Chad to the White Nile and Nile Rivers. The semidesert zone depends chiefly on livestock production; crop production is very low. The better‐off group derives almost all of its cash income from livestock sales and trade, while the middle and poor groups obtain most of their income from gold extraction, migrant labor, trade (for the middle group), and herding (for the poor group). This zone also has highly unequal incomes between wealth groups. Eastern Khors Agropastoral (Zone 5) comprises the substantial series of khors mostly on the eastern side of Red Sea and parts of River Nile states. Sorghum is the predominant crop, but most households also own relatively large herds of sheep and goats. Famine Early Warning Systems Network 5 January 2015 SUDAN Livelihood Profiles Fishing is the predominant livelihood activity in Coastal Fishing (Zone 6) along the Red Sea. Most households also earn income from livestock sales or through labor or trade outside the zone. Sorghum production and sheep and goat sales are the most important sources of food and income in the Eastern Agropastoral Sorghum (Zone 7). The fertile alluvial soils of Flood‐retreat Cultivation (Zone 8) allow for heavy reliance on sorghum and vegetable production. Cultivation is mainly determined by flooding of Tokar and El Gash Deltas, Atbara River, and Al Rahad areas, straddling the common border of Northern and Southern Kordofan states. Livestock production and sale is a common secondary activity in the zone. Central Irrigated Schemes (Zone 9) comprises Gezira, Al Rahad, and New Halfa in central and eastern Sudan. With strong water management, farmers tend to produce higher‐value crops in surplus, such as sorghum, wheat, and groundnuts, as well as cotton. The GoS regulates production in this zone. Livestock holdings are limited by the high proportion of land used for high‐value agriculture. Southeast Rainfed Semi‐mechanized Agriculture (Zone 10) is a very large and highly populated zone. Rainfed cultivation of sorghum and millet predominates, with additional production of sesame, groundnuts, and cotton as cash crops. Despite being a cereal‐surplus area, poor households rely on market purchases between May and August. Income variability in nonagricultural sectors (that is, gold mining) may occasionally limit individual households’ food access. The Western Agropastoral Millet (Zone 13)* zone is a marginal agricultural zone in which only drought‐resistant millet is reliably produced. Households also grow watermelon, hibiscus, and okra in low‐lying areas. Given limited agricultural productivity, livestock sales account for the majority of the better‐off and middle groups’ cash income, while the incomes of the poor group mainly come from labor and trade. The Central Rainfed Millet and Sesame (Zone 14)* shares a relatively similar rainfall pattern as Zone 13, with slightly greater access to water and significantly better access to major markets (Khartoum, Gezira, Gedaref, and El Obeid). Millet is the main crop produced for consumption, while sesame is the main cash crop. Livestock sales (camels, goats, and sheep) are a significant source of income for most households, although poor households obtain the largest share of their income from agricultural labor. The North Kordofan Gum Arabic Belt (Zone 18)* is an agropastoral area similar to Zone 13. However, being further south, this zone benefits from additional rainfall amounts and reliability that allows for sorghum and groundnut production in addition to millet. Furthermore, this zone has a large concentration of both wild and cultivated gum Arabic trees. Income inequality in the zone is high. The following zones are considered to be at greatest risk of acute food insecurity in the eastern, central, and northern regions of Sudan: Eastern Pastoral (Zone 3) has high rainfall variability. When rainfall is low, people sell more livestock than usual, lowering purchasing power for food. High prices and occasional market failures are also common shocks in the zone. Most importantly, field information suggests that common coping mechanisms are often inadequate to mitigate the impact of these shocks. Flood‐retreat Cultivation (Zone 8) is heavily reliant on agriculture for food and income. Unfortunately, the high frequency of both drought and flooding due to the proximity of watercourses often poses a threat to crop production. The Eastern Khors Agropastoral (Zone 5) is a remote zone with low cereal production potential that is completely dependent on highly variable water flows from the Red Sea Hills into the khors. The isolation of villages and difficult Famine Early Warning Systems Network 6 January 2015 SUDAN Livelihood Profiles communication with main cereal and labor markets contribute to limited income‐earning opportunities, making the zone one of the poorest among the livelihood zones studied. Famine Early Warning Systems Network 7 January 2015 SUDAN Livelihood Profiles NORTHERN RIVERINE SMALL‐SCALE CULTIVATION (ZONE 1) This zone consists of irrigable land on both sides of a very long stretch of the Nile River and the Atbara River, the only major tributary of the Blue Nile, passing through the length of two states, Northern and Nile. As a recent development, Atbara River now flows throughout the year with increased water volume due to construction of a new dam on the Blue Nile River in Ethiopia. The desert rainfall regime may offer virtually no precipitation during the whole year, or else a few showers amounting to 50 mm per annum, which are not sufficient to support rainfed crops but may regenerate local temporary pastures and browse from July to October. Rainfall in this zone is insufficient to support rainfed agriculture. Rather, livelihoods in this zone rely predominantly on irrigated agriculture. For example, while poor groups in most parts of Sudan consume their own production for about four to five months in a good year, poor groups in the Northern Riverine Small‐scale Cultivation Zone rely on their own crop harvest for about nine months in a good year. Agricultural activity peaks in the cooler, winter months of November to April both for the main cereals, wheat and sorghum, as well as for fruits, dates, and vegetables. Fodder production is mainly commercial and carried out by foreign investors for export. Dependence on the river and nearby water table for irrigation water is near absolute. Livestock are kept in modest numbers locally and hence are not helpful for animal traction in the zone. They are mainly grazed on crop residues and grass fodder from the margins of cultivated land and river banks. There are two kidding and lambing periods in August and February; as such, milk production is almost an all‐year‐round activity. Local availability of milk only reduces due to seasonal livestock migration (August to November, returning home in December) to the region’s famous Al Butanah grazing grounds. The Al Butanah grazing grounds are a traditional grazing area, covering the states of Khartoum, Gezira, Al Qadarif, Kassala, and River Nile. While in Al Butanah, local people who migrate as a family and employ livestock herders process some of the milk as ghee, some of which is sold on returning home. This livelihood zone is characterized by two agricultural seasons, with some farmers commencing winter cropping immediately after the end of floods, which coincides with the recession of river water. This is locally known as “Juruf” farming. The second season, mainly known for production of watermelon and vegetables, starts in April the following year. The harvesting and marketing of second season watermelon crops takes place in August (Figure 2). Figure 2 Seasonal calendar for the Northern Riverine Small-scale Cultivation Zone Jan Feb Mar Apr May Jun Jul Aug Sep Oct Nov Dec Seasons Rainy season (river flooding) Dry season Winter Summer Winter Lean season Cropping Wheat Sorghum Livestock Lambing/kidding/calving Milking Other Irrigation Seasonal livestock movement Hazards High temperatures Strong winds and sand dunes Legend p p Land preparation s s Sowing w w Weeding h h Harvest Source: FEWS NET. Famine Early Warning Systems Network 8 January 2015 SUDAN Livelihood Profiles Ed Damer and Atbara are the primary markets for all goods bought and sold in the zone. Dongla/Marawi are alternative markets, rather more important for marketing of watermelon and onions; Atbara is particularly notable for its importance linking animal fodder to export markets; and Kassala is a key assembly market for watermelon during the harvest/marketing seasons of February/March and July/August. Within the larger market system, these commodity flows tend to link through Khartoum for domestic markets (foodstuffs, goats, and cattle) or Port Sudan for the international market, primarily through the Middle East (wheat imports and exports of onions, watermelon, animal fodder, sheep, and gold). This zone produces over 95 percent of the dry dates in Sudan; dates are an important source of cash, particularly for middle and better‐off households. Access to strategic markets of Khartoum, Omdurman, Port Sudan, and Gulf states is relatively good, though constrained by long distances, which limits the frequency of movement of goods and services and broader economic linkages between this zone and the national economy. Though roads may be impassable for a few days after a heavy rain, rainfall is so scarce that it does not constitute a significant seasonal impediment to market access. Physical market access is broadly similar year‐ round. However, trade in foodstuffs tends to be greatest during the peak marketing and lean seasons between February and August. Relatively good physical and economic access to strategic markets has enhanced the marketing of agricultural produce, the main source of household income in this zone. Determinants of wealth The poor constitute the majority (50‐60 percent) of households in this zone, compared with 25‐35 Table 1 Determinants of wealth in the Northern Riverine percent and 10‐20 percent for the middle and Small-scale Cultivation Zone Poor Middle Better-off Determinants of wealth better‐off groups, respectively (Table 1). Although 50-60 25-35 10-20 Percentage of households polygamy is practiced in this zone, it is not a key (%) determinant of wealth. Generally, wealth status is Household size (#) 8-10 7-9 6-8 determined by the land area owned and cultivated Land holding and the livestock owned. No excess land is left to Land area owned (ha) 0-2 2-6 10-12 fallow in a particular year; as such, inputs are Land area cultivated (ha) 0-2 2-6 10-12 sometimes required for higher productivity. Typical livestock holding (#) Sheep 0-2 5-7 75-125 Overall land area cultivated is determined by Goats 0-4 0-4 7-9 households’ economic ability to afford the Cattle 0 0-2 8-10 production cost (for example, seeds, fertilizers, Camels 0 0 0-8 diesel, labor cost, and tractor services). Significant Donkeys 0-2 0-2 1-3 variations exist in the size of land owned among all Other productive assets (#) three wealth groups. The skewed land ownership in Irrigation pump 0 0-1 0-4 favor of the middle and better‐off groups is Tractor 0 0 0-2 hereditary and in some cases due to increased land Motor vehicle 0 0 0-2 fragmentation. Livestock, consisting of sheep, Source: FEWS NET. goats, cattle, and camels, consume crop residues and natural fodder from the margins of cultivated and riverbank land. Small ruminants are kept by all wealth groups. Cattle and camels are only kept by better‐off groups and nomadic herders who have settled in the localities within the zone but do not own land. Households in the poor and middle groups generally do not have the financial capital to purchase and maintain cattle or camels in this environment. Sources of food and cash and expenditures All wealth groups cultivate wheat or sorghum, broad beans, okra, and other vegetables such as tomatoes for consumption. In the 2012/13 reference year, a good year, all wealth groups had sufficient access to food to meet 2,100 kilocalories per person per day (Figure 3). Own‐produced cereals (wheat and sorghum) contribute a significant part of the minimum annual food requirement. However, the poor group purchases more wheat, usually between May and August, compared to the wealthier groups. All wealth groups purchase substantial quantities of nonstaples, including cooking oil, sugar, meat, lentils, and okra, especially during the dry season when neither fresh nor dry okra is available in the household. The middle and better‐off groups also consume their own cow and goat milk, with some own‐produced meat consumption. Famine Early Warning Systems Network 9 January 2015 SUDAN Livelihood Profiles The poor group receives various food gifts, such as sorghum or wheat. Poor households may also receive gifts of milk or temporary guardianship of a few milk animals during the milking season from some middle and better‐off groups. However, milk consumption is not a significant source of energy among the poor. Figure 3 Food sources by wealth group, Northern Riverine Small-scale Cultivation Zone Source: FEWS NET. Figure 4 Cash income sources by wealth group, Northern Riverine Small-scale Cultivation Zone Source: FEWS NET. The better‐off group obtains most of its income from the sale of its own crops, including onions, tomatoes, garlic, watermelon, dates, and animal fodder. The middle and poor groups derive less income from the sale of crops compared with the better‐ off group due to their limited land and lack of cash for production inputs (seeds, pesticides, and hired labor) (Figure 4). Given the high price of gold in recent years, gold extraction activities have skyrocketed in and around this zone. The benefits of gold extraction vary among the wealth groups based on their associated role Figure 5 Allocation of expenditures in the mining system. The poor mainly provide labor, households in the middle by wealth group, Northern Riverine group provide labor and/or equipment, and the better‐off, who employ Small-scale Cultivation Zone households in the other two groups, obtain cash income by selling extracted gold. Overall, employment in gold extraction is almost 100 percent of the total labor income for the poor (as casual labor), dwarfing the relative importance of the sale of agricultural labor for planting, weeding, and harvesting in irrigated and flood‐retreat cultivated areas of the zone, which is a more traditional source of income. All wealth groups obtain a significant proportion of their cash income from self‐ employment, particularly for gold extraction within the zone. Gold extraction represents 40 percent and 82 percent of self‐employment income among the middle and better‐off groups, respectively. Other forms of self‐employment practiced by the middle and better‐off groups are petty trade, retail shops, bakeries, and livestock sales outside the zone. Although not included in the analysis for this zone, some cash remittances from other parts of Sudan and the Gulf states are also common here. The distinguishing characteristic between wealth groups is the requirement for significant (60‐80 percent) expenditures on agricultural inputs to maintain incomes typical for the middle or better‐off groups (Figure 5). Source: FEWS NET. Famine Early Warning Systems Network 10 January 2015 SUDAN Livelihood Profiles Primary food, cash, and expenditure cycle for poor households Wheat and sorghum are staple cereals of the poor group in this zone. In the reference year, the poor group consumes their own crop for nine months of the year. In the remaining three months, staples are purchased from the market. Milk consumption among the poor group is very limited and not an important source of food. The main income option available to the poor group during the lean season is gold extraction, supplemented with limited agricultural employment in the second season (Figure 6). Major expenditure items among the poor group include some agricultural inputs, education, especially school fees for basic education, and health care‐related expenses, particularly during the months of July to October due to mosquito‐borne illness in the rainy season. Figure 6 Food access calendar for poor households in the Northern Riverine Small-scale Cultivation Zone Jan Feb Mar Apr May Jun Jul Aug Sep Oct Nov Dec Staple foods Wheat Sorghum Milk Income Sale of labor (gold extraction) Sale of crops Sale of agricultural labor Expenditures Agricultural inputs Education Health care Legend op op Own production mp mp Market purchase ik ik In-kind c c Gathering Source: FEWS NET. Hazards and coping Given the reliance on agriculture, the particularly arid environment, and distance to markets, the most common hazards are related to agriculture and marketing of agricultural products. They include: • High temperatures between November and March during the vegetative and flowering stages may reduce productivity of crops, particularly wheat, vegetables, and watermelon. • Late rains (starting after July) or late floods (after mid‐August) may delay green harvests, resulting in an extended lean season. • Watermelon plants are vulnerable to strong winds and storms, particularly during the summer (May‐August) season. In addition, wind and storms may create sand dunes, limiting livestock movement. • High sorghum, wheat, and agricultural input prices are likely to have a disproportionately large impact on poorer households, who rely more heavily on the market for food and who spend nearly 10 percent of their income on inputs to ensure only meager agricultural production. • Crop pests are a concern; sorghum and wheat are particularly vulnerable to birds during the pre‐harvest season. Desertification and global warming are likely to increase the frequency or severity of some of these hazards in the long run. Coping strategies for all wealth groups rely primarily on intensification of cash remittances and local kinship support. Famine Early Warning Systems Network 11 January 2015 SUDAN Livelihood Profiles SOUTHERN RIVERINE SMALL/MEDIUM‐SCALE CULTIVATION (ZONE 2) This zone lies along the White Nile and Blue Nile Rivers, along the Nile River north of Khartoum, and along a short stretch of River Gash near Kassala town and the Eritrean border. This riverine zone has fertile alluvial soils, with limited land area, and is surrounded by the vast rainfed semi‐mechanized and irrigated cereal production areas. The average annual rainfall of the zone is between 300‐500 mm per annum (from mid‐July to the end of October), but is highly variable (+/‐ 30 percent compared to the average in any given year). Rainfall is higher in the southern part of the zone. As a result, significant variations exist in areas planted to rainfed crops and yields from one year to another. However, irrigated agriculture using river water predominates in this zone, with some flood‐retreat cultivation. As a result, agricultural activities are year‐round. In addition to cereals, this zone produces vegetables and orchard fruits. Cash crops, notably onions and tomatoes, are the most profitable use of the land in areas where market access has been enhanced by asphalt roads. Land preparation is mainly carried out using tractors. As such, livestock are mainly kept for household cash income rather than animal traction, though animal manure for crop production and some milk production for household consumption are also desirable. As such, there are relatively fewer cattle in this zone compared with sheep and goats. As with the Northern Riverine Small‐scale Cultivation Zone, there are two kidding and lambing periods in August and February, and milk production is almost a year‐round activity (Figure 7). Local availability of milk is only interrupted by seasonal livestock migration to the Al Butanah grazing ground from August to November, reducing the risk of livestock interfering with cropping. The livestock are returned in December and graze mainly on crop residue and other fodder along the river banks. Figure 7 Seasonal calendar for the Southern Riverine Small/Medium-scale Cultivation Zone Jan Feb Mar Apr May Jun Jul Aug Sep Oct Nov Dec Seasons Rainy season Dry season Winter Summer Winter Lean season Cropping Sorghum (rainfed) Sorghum (irrigated) Livestock Lambing/kidding/calving Milking Other Irrigation Seasonal livestock movement Hazards Crop pests/diseases Fluctuating level of the River Nile Legend p p Land preparation s s Sowing w w Weeding h h Harvest Source: FEWS NET. Markets in the Southern Riverine Cultivation Zone are relatively more diversified than in the north, with Rabak, Wad Madnai, El Kamlin, Singah and Sinar, and El Damzin playing key roles in the market flows for the zone. Fruits (banana, mango, lemon) are primarily marketed between February and April from El Kamlin to domestic markets. Vegetables are sold year‐round along the same routes. These perishable crops are sold as they are harvested to avoid losses due to poor storage facilities in the zone. Famine Early Warning Systems Network 12 January 2015 SUDAN Livelihood Profiles Sorghum is usually sold from February through April via Rabak to Khartoum/El Obeid, but it is purchased via Al Qadarif and Al Rahad between May and August. Wheat purchases are year‐round and are sourced from Europe via Port Sudan. Livestock are primarily marketed through El Damazin and Rabak or Sinar year‐round. Sheep and fodder are exported to the Gulf states via Port Sudan, whereas other livestock primarily meet domestic demand in Khartoum. Access to strategic markets for goods and services and skilled and unskilled labor (such as El Damazin, Sennar, Wad Medani, Omdurman, and Kosti to Khartoum as well as Port Sudan and Gulf states) is relatively good due to the well‐tarmacked national highway road network. However, the main constraint is the long distance of over 1,000 km, especially to Port Sudan, the main export route out of the country. This increases the overall cost of movement of goods and services and economic interaction with the national economy and neighboring countries such as Eritrea and South Sudan, where most of local fruits (orange and banana) are mainly sold. Determinants of wealth Table 2 Determinants of wealth in the Southern Riverine Wealth in this zone is chiefly determined by land Small/Medium-scale Cultivation Zone area owned and cultivated and livestock Middle Better-off Determinants of wealth Poor ownership (Table 2). No excess land is left for Household percentage (%) 55-65 25-35 5-15 fallow in a particular year. Area cultivated is Household size (#) 9-11 8-10 8-10 normally determined by households’ land Land holding ownership, land availability, and economic ability 1-3 Land area owned 3-5 10-12 to afford the cost of production inputs (seeds, (ha) fertilizers, labor, herbicides, insecticides, and 1-3 Land area cultivated 3-5 10-12 tractors). Because of limited availability of oxen (ha) and ox in the zone, land preparation and plowing Typical livestock holding (#) are mainly carried out using tractors. Significant Sheep 0-2 40-46 90-100 variation exists in the amount of land owned Goats 0-4 15-25 30-50 among wealth groups. These differences are Cattle 0 2-4 20-40 mainly hereditary, and are coupled with continued Camels 0 0 0 land fragmentation, especially among the poor Donkeys 0-2 0-2 0-2 group, and greater acquisition of land by some Other productive assets (#) middle and better‐off groups. Donkey cart 0-2 0 0 Tractor 0 0 0 Sheep, goats, and cattle are the main livestock Motor vehicle 0 0 0-2 types; they consume crop residues and grass Source: FEWS NET. fodder from the margins of cultivated and riverbank land. Small ruminants are kept by all wealth groups, unlike cattle, which remain the domain of the middle and better‐off groups. This is mainly due to the high cost of livestock inputs (fodder, water, drugs, and veterinary services), especially during the dry season. Sources of food and cash and expenditures As in the Northern Riverine Small‐scale Cultivation Zone, own‐produced crops are a significant component of the minimum household food energy requirement (Figure 8). Household food consumption is mainly based on own staple cereal production, comprising sorghum supplemented with purchased cereals (that is, imported wheat). The main locally produced staple food is sorghum, consumed both as green and dry grain. For the better‐off group, own crop production is sufficient to meet the minimum annual food requirement, but this group prefers selling most cereal harvest in exchange for processed wheat purchased in the market. The middle and poor groups derive about 40 percent and 50 percent, respectively, of the minimum annual food requirement from their own crop consumption. Unlike the better‐off group, the middle and poor groups mainly purchase sorghum once their own harvest is exhausted. However, the poor group has a longer period (May‐December) of market purchase than the middle group. Famine Early Warning Systems Network 13 January 2015 SUDAN Livelihood Profiles All nonstaple foods are purchased by all wealth groups; however, the main difference is the variation in quantities purchased. These nonstaples include sugar, cooking oil, lentils, dry meat, and vegetables, including dry okra. Goat and cattle milk contribute to part of the food consumed and add to local diet diversity, which mainly comprises cereals, especially among the middle and better‐off groups. The poor derive some additional energy from gifts provided by the better‐off group. All wealth groups in this zone met their minimum annual food requirement in the 2012/13 reference year. Figure 8 Food sources by wealth group, Southern Riverine Small/Medium-scale Cultivation Zone 120% Figure 9 Cash income sources by wealth group, Southern Riverine Small/Medium-scale Cultivation Zone 120,000 SDG/Hh in reference year Percent of 2,100 kcal/person/day 140,000 100% 80% 60% 40% 20% 80,000 60,000 40,000 20,000 0% Poor Gifts/remittances Staple purchase Crops 100,000 0 Middle Better-off Non-staple purchase Livestock products Poor Self - employment Livestock sales Crop sales Middle Better-off Labour - casual Livestock product sales Source: FEWS NET. Source: FEWS NET. The main cash crops produced include vegetables (onions and tomatoes) and orchard fruits (mango, lemon, and guava). The sale of crops, particularly surplus sorghum and fruits (banana, mango, and lemon), is an important source of income among the middle and better‐off groups (Figure 9). The poor group benefits through provision of agricultural labor (land preparation, planting, weeding, and harvesting) since most garden production is labor intensive, and the poor group, which owns little land, earns an important part of its living working for wealthier neighbors, especially from May to September. The local demand for labor is high, such that few people need to venture into the rainfed semi‐mechanized or irrigation schemes or towns to find seasonal employment. Better‐off and middle groups supplement their cash income through the sale of livestock (sheep, goats, and cattle), and the poor and middle groups earn additional income through self‐ employment, especially in gold extraction in neighboring areas. This zone is characterized by acute disparities in the level of cash income among all wealth groups compared with neighboring zones, attributable to significant variations in factors of production such as land and the level of access to agricultural inputs. The exceptional characteristic of expenditures in this zone is the proportion of income spent on water, which ranges from about 7 percent of expenditures among the better‐off group to more than 20 percent of expenditures among the poor. Again, as in other zones, the expenditures that poor households must make on food preclude significant investment in inputs (Figure 10). Figure 10 Allocation of expenditures by wealth group, Southern Riverine Small/ Medium-scale Cultivation Zone 100% 90% 80% 70% 60% 50% 40% 30% 20% 10% 0% Poor Staple food Hh items Inputs Clothes Middle Better-off Non-staple food Water Social services Other Source: FEWS NET. Primary food, cash, and expenditure cycle for poor households Sorghum and wheat are staple cereals in this zone. The reference year shows the poor group consumes its own sorghum harvest for about four months (January‐April). Sorghum purchases run from May until December, while some of the poor 14 Famine Early Warning Systems Network January 2015 SUDAN Livelihood Profiles group, who prefer a mixture of sorghum and wheat, purchase wheat for at least eight months of the year. Livestock are sold throughout the year, with the peak season between August and October due to high demand during the religious festive season, which pushes up market prices in the zone. The main income options available to the poor during the lean season are gold extraction, sale of livestock, and agricultural employment (Figure 11Figure 11). The major expenditure items among the poor group are agricultural inputs from September to December, education, especially payment of school fees in June‐July, and seasonal health care‐related expenses, which pick up from June to August due to the seasonal increase in malaria prevalence and other water‐borne diseases. Figure 11 Food access calendar for poor households in the Southern Riverine Small/Medium-scale Cultivation Zone Jan Feb Mar Apr May Jun Jul Aug Sep Oct Nov Dec Staple foods Sorghum Wheat Income Sale of livestock Sale of crops Sale of agricultural labor Sale of gold or gold mining labor Expenditures Agricultural inputs Education Health care Legend op op Own production mp mp Market purchase ik ik In-kind c c Gathering Source: FEWS NET. Hazards and coping The main hazards in this zone are: • Crop pests and diseases can affect normal crop production, especially vegetables. • Floods associated with the fluctuating level of the Nile River can directly affect seasonal crop performance. • Late rains (starting after July) or late floods (after mid‐August) may delay green harvests, resulting in an extended lean season. • High temperatures between November‐March during the vegetative and flowering stages may reduce crop productivity, particularly that of wheat and vegetables. • Watermelon plants are vulnerable to strong winds and storms, particularly during the summer (May‐August) season. In addition, wind and storms may create sand dunes, limiting livestock movement. • The intensification of laborers choosing to work in gold mines rather than in agricultural labor tends to raise the cost of agricultural labor and production. A key coping strategy for all wealth groups is the purchase of pesticides for spraying crops. Poor households likely intensify their search for casual labor either in nearby gold mines or in urban areas. Famine Early Warning Systems Network 15 January 2015 SUDAN Livelihood Profiles EASTERN PASTORAL (ZONE 3) This zone covers parts of the Red Sea, River Nile, Kassala, and Khartoum states. Topography in the zone varies from mountain to hill to inland and coastal plains. However, the zone has a common rainfall regime of less than 150 mm per annum on average between August‐October and an associated arid ecology insufficient to support rainfed agriculture or even transhumant cattle. Rather, the rugged environment is suitable for grazing; goats and sheep, together with some camels and donkeys for transportation, are the mainstay of the inhabitants. Even small ruminants and camels migrate annually between February and July in search of browse and pasture. Calving, kidding, and lambing take place around July when livestock return from seasonal migration for water, grazing, and fodder in neighboring flood‐retreat areas of Kassala and Red Sea states. Milking takes place from August until April the following year, with peak production between September and December, and low production (combined with low physical access as many animals migrate) between May to July, which coincides with the lean season, when cash sources for food purchases are also limited (Figure 12). Figure 12 Seasonal calendar for the Eastern Pastoral Zone Jan Feb Mar Apr May Jun Jul Aug Sep Oct Nov Dec Seasons Rainy season Dry season Lean season Livestock Lambing/kidding/calving Milking Other Seasonal livestock migration Hazards Animal diseases Drought Legend p p Land preparation s s Sowing w w Weeding h h Harvest Source: FEWS NET. Physical access to key markets of Khartoum, Omdurman, Port Sudan, Gulf states and Egypt is relatively good due to the well‐ developed national road network. However, the sale of livestock and other local commodities is constrained by high costs of transportation due to long distances of about 400‐800 km, especially from central parts of the zone to Port Sudan. The long distances also constrain the number of traders visiting the zone and the effective integration and economic linkage of this livelihood zone with the national economy. Al Qadarif and Kassala are the main markets for sheep exports and for harvest and marketing season domestic sorghum sales (December to June). Goats, camels, and cattle are sold primarily for domestic markets toward Khartoum, though camels are also commonly exported to Egypt between September and February. As in other zones, wheat is a key staple, imported from Asia/Europe via Port Sudan and Khartoum. Determinants of wealth Wealth is chiefly determined by livestock holdings and management of a sustainable herd of animals (Table 3). Livestock holdings and sales are skewed towards wealthier households, while poorer households keep animals for milk rather than sale. There is no shortage of grazing land or water for livestock in the zone, and all wealth groups have equal access to grazing land and water resources. Livestock holding is skewed in favor of the better‐off and middle groups. The poor group, on the other hand, mainly depends on the sale of labor. The low livestock ownership among the poor group is attributed to lack of recovery Famine Early Warning Systems Network 16 SUDAN Livelihood Profiles from the long‐term impact of the 1984 drought and subsequent famine in East and West Africa. The main livestock owned by the better‐off group are sheep, goats, and cattle, and smaller numbers of goats and sheep are owned by the middle and poor groups. Camels are also mainly owned by the better‐off group, because the cost of purchasing and maintaining camels is relatively high compared to that of small ruminants. Sources of food and cash and expenditures January 2015 Table 3 Determinants of wealth in the Eastern Pastoral Zone Middle Better-off Determinants of wealth Poor Household percentage (%) 68-72 18-22 8-12 Household size (#) 6-8 5-7 5-7 Land holding 0 Land area owned 0 0 (ha) 0 Land area cultivated 0 0 (ha) Typical livestock holding (#) Sheep 4-6 12-20 40-46 Goats 4-6 8-12 40-60 Cattle 0-2 17-20 0-55 Camels 0-1 5-7 22-24 Donkeys 1-3 2-4 3-5 Other productive assets (#) Donkey cart 0-2 0-2 0-2 This zone is purely pastoral; in contrast to the Eastern Khors Agropastoral Zone interspersed throughout Red Sea and River Nile states, none of the wealth groups in this livelihood zone obtain any food or income from crop cultivation. Milk consumption, though significant across all wealth groups, varies most widely between wealth Source: FEWS NET. groups, with poor households consuming significantly less milk and significantly more purchased cereals, chiefly sorghum. All wealth groups consume sheep and goat milk, but the better‐off and middle groups also obtain cattle and camel milk seasonally. Poor households receive some milk through gifts in the form of borrowed milking animals, mainly from the better‐off group. Other nonstaple foods purchased by all wealth groups include sugar, cooking oil, meat, lentils, and dry okra. In the 2012/13 reference year, all wealth groups were able to meet their minimum annual food requirement, though the poor met this requirement with difficulty (Figure 13). Figure 14 Cash sources by wealth group, Eastern Pastoral Zone 160% 80,000 140% 70,000 SDG/Hh in reference year Percent of 2100 kcal/person/day Figure 13 Food sources by wealth group, Eastern Pastoral Zone 120% 100% 80% 60% 40% 60,000 50,000 40,000 30,000 20,000 10,000 20% 0 0% Poor Gifts/remittances Staple purchase Middle Better-off Non-staple purchase Livestock products Source: FEWS NET. Poor Self - employment Livestock sales Middle Better-off Labour - casual Livestock product sales Source: FEWS NET. Acute income inequality is common in pastoral livelihoods, and this zone is no exception (Figure 14). This is mainly because livestock ownership, and, therefore livestock and livestock product sales, is skewed heavily in favor of the better‐off group; poor households, on the other hand, rely mainly on local casual labor as herders and self‐employment for income. Since the supply of herders available from poor households exceeds local demand, poor households also engage in self‐employment (sale of charcoal and firewood) or gold mining and provide seasonal migratory labor to urban areas or neighboring agricultural zones. Petty trade is an additional source of income among better‐off households. Famine Early Warning Systems Network 17 SUDAN Livelihood Profiles Interestingly, the middle group bears the largest burden to sustain its livelihood with inputs, while the better‐off group has a larger share of discretionary spending. Contrary to expectations, poor households tend to spend less than half of their income on food (Figure 15). This economic structure suggests that while high rates of livestock mortality due to drought or disease may disproportionately affect the middle and better‐off groups, the risk of food insecurity is likely to be greatest in the zone in the event of shocks: to casual labor demand, including gold mining; to self‐employment activities among poor households (charcoal and firewood sales or wild foods); or to cereal prices. This is because the poor rely almost entirely on markets for food and because these are the main sources of income for poor households. Long distances from villages to main roads and the small number of traders working in the zone contribute to a thin market, inelastic for essential purchases and elastic for key income sources. Primary food, cash, and expenditure cycle for poor households January 2015 Figure 15 Allocation of expenditures by wealth group, Eastern Pastoral Zone 100% 90% 80% 70% 60% 50% 40% 30% 20% 10% 0% Sorghum is the main staple in this zone (Figure 16). The reference year shows that Poor Middle Better-off the poor group relies entirely on market purchases of sorghum from August to July. Staple food Non-staple food Milk production from own goats and sheep, as well as milk given to herders as in‐ Hh items Water kind gifts, is available from mid‐August until the following April. No milk is Inputs Social services Clothes Other produced from May to July due to the seasonal movement of livestock away from Source: FEWS NET. the homesteads, and in some cases, the zone. The main sources of income available during the lean season (May‐August) are urban migratory work and sales of charcoal. The major expenditure items among the poor group are education, especially payment of school fees in June, July, and October in Red Sea state, and seasonal health care‐related expenses from August to November in other states, and particularly from December to February in Red Sea state. Figure 16 Food access calendar for poor households in the Eastern Pastoral Zone Jan Feb Mar Apr May Jun Jul Aug Sep Oct Nov Dec Staple foods Sorghum Milk Okra, lentils Income Herding camels Sale of charcoal Sale of migrant labor (urban) Expenditures Education Health care Legend op op Own production mp mp Market purchase ik ik In-kind c c Gathering Source: FEWS NET. Hazards and coping The main chronic hazards in this zone are: • Livestock disease, particularly at the peak of the milking season (July‐September), reduces milk production with impacts on both household milk consumption and household income. Famine Early Warning Systems Network 18 January 2015 SUDAN Livelihood Profiles • If local pasture, fodder, and/or fodder availability are low, fodder and water prices will be higher than usual, particularly between August and October. Livestock sales are likely to be above average and prices below average as more animals than usual must be sold to maintain the remaining herd at a higher cost than usual. • Frequent drought and extremely dry winds affect grazing conditions for livestock. • Staple food price spikes reduce access to food, particularly for poor households that do not have enough livestock to sell to cope. Price spikes are most likely due to poor harvests in surplus‐producing, semi‐mechanized rainfed areas, mainly in Al Qadarif and Kassala states. • Late rains (starting later than August) may reduce or delay milk production. In this pastoral zone, the poor group normally copes with crisis by increased migration in search of employment; reduced availability of herding labor may increase the price. The main strategy among the middle and better‐off groups is to increase livestock sales, especially of cattle, which are less drought‐resistant than small ruminants. This strategy reduces the risk of significant loss of livestock due to lack of pasture and water, and increases the income needed to purchase water and animal feed for remaining livestock and/or to purchase staple foods at higher prices than usual for household consumption. These groups may also migrate long distances with their livestock toward southern Sudan, unlike normal years when they move to the Al Butanah pastures and flood‐retreat areas of Kassala and Red Sea states. This strategy, however, requires more herding labor than does migration to Al Butanah in a typical year. Famine Early Warning Systems Network 19 January 2015 SUDAN Livelihood Profiles EASTERN KHORS AGROPASTORAL (ZONE 5) This zone comprises the substantial series of khors in Red Sea state, overlapping somewhat into River Nile state. The khors are a form of wadi; they are small valleys or ravines, usually bounded by relatively steep, wooded banks and hilltops. In the rainy season, the khors become a watercourse fed by rainfall runoff. In Red Sea state, the khors are located on either side of Red Sea Hills. The khors with eastward flow on the east side of the hills tend to form deltas such as Khor Arbaat before entering the Red Sea. Meanwhile, the khors to the western side of the hills, such as Khor Arab, Amor, and Agwampt, spread into plains and drain into the Nile River. This is a truly agropastoral livelihood zone, where crops are grown more or less entirely for home consumption, and livestock, primarily goats, provide milk and, more importantly, cash for cereal purchases and other essentials. Rainfall is only some 50‐ 100 mm per annum, falling sparsely between mid‐July and mid‐October to the west and slightly later between October‐ December to the east. Rainfall is insufficient to support rainfed cropping or even grazing for transhumant cattle. Instead, water from the khors is harvested and used for irrigation between July and December, so that cereals and garden crops, notably okra, and even some fodder can be cultivated on the relatively fertile sedimentary soil. Planting is mainly determined by the amount of surface water flow in the khors. The consumption year commences with green sorghum consumption from late November to mid‐December. Dry sorghum grain is harvested from January to March. There is no substantial off‐season (cool, dry season) cultivation. The sides of the khors and the nearby hillsides are wooded, providing browse for goats and camels. Households move livestock seasonally to the grass pastures on the plains to the west, which also allows modest numbers of sheep to be kept. Calving, kidding, and lambing take place in September and October when animals are grazed within the zone. During the seasonal livestock movement, some milking animals are kept near the homesteads. No milk is produced from May to August (Figure 17). Figure 17 Seasonal calendar for the Eastern Khors Agropastoral Zone Jan Feb Mar Apr May Jun Jul Aug Sep Oct Nov Dec Seasons Surface water flows Rains r Dry season winter r r r r r r r r r r r r r r summer winter Lean season Cropping Sorghum dry harvest green Livestock Lambing/kidding Milking Other Seasonal livestock movement Hazards Excessive surface water Wind storms Legend p p Land preparation s s Sowing w w Weeding h h Harvest Source: FEWS NET. Despite well‐tarmacked roads along the Red Sea coast and between Kassala, Kartoum, and Port Sudan (including Aroma, Hamash Koreib, Talkuk, Twawait, and Wager), the mountainous topography essential to livelihoods in this zone poses significant infrastructure challenges and contributes to relative isolation from markets, particularly west of the Red Sea Hills. Topography and infrastructure therefore limit poor households’ access to labor opportunities in larger labor markets and constrain transportation of food and other commodities into the most rural parts of the zone. Famine Early Warning Systems Network 20 January 2015 SUDAN Livelihood Profiles The market fabric of the zone is thin, with few items of significance to be sold or purchased. Households tend to sell sorghum to markets in Al Qadarif and Kassala during the December‐June harvest and marketing season. Sheep, again, are primarily destined for export via Kassala and Port Sudan, particularly between September and February, while goats feed the domestic market locally and toward Khartoum. Wheat is imported year‐round from Europe via Port Sudan. Table 4 Determinants of wealth in the Eastern Khors Determinants of wealth Wealth is chiefly determined by livestock holdings, Agropastoral Zone Poor Middle Better-off Determinants of wealth the management of a sustainable herd of animals, Household percentage (%) 60‐70 20‐30 5‐15 and access to cultivable land in the khors (Table 4). Household size (#) 6‐8 6‐8 6‐8 The main livestock owned by all wealth groups are Land holding sheep and goats. Smaller numbers of camels are Land owned (ha) 1‐3 2‐4 20‐26 owned by the poor and middle groups compared Land cultivated (ha) 1‐3 2‐4 >20‐26 with the better‐off group. Livestock holdings are Typical livestock holding (#) skewed in favor of the better‐off and middle Sheep 0‐2 4‐8 40‐50 groups, who benefit from livestock products for Goats 4‐6 8‐14 18‐20 food and cash income as well as actual sale of Cattle livestock, unlike the poor, who mainly depend on 0 0 0 Camels sale of casual labor. The better‐off group, which 0‐1 2‐4 8‐16 has excess milk production, will often lend three or Donkeys 0‐2 0‐2 0‐2 four milking animals in a season to poor relatives Other productive assets (#) who do not own any milking animals. Donkey cart 0‐2 0‐2 0‐2 Source: FEWS NET. To some extent, access and ownership of productive land in the khors also has an influence on wealth status in the zone. This is mainly through own food production, which relieves a household from staple food purchase in the market. The area cultivated depends on availability of water harvesting systems and access to plowing services, which are extremely limited in this zone. The poor lack the cash to invest significantly in agricultural production inputs. The typical household size among all wealth groups is six to eight people, suggesting that household size may not be a major determinant of wealth among the local population. Sources of food and cash and expenditures Figure 18 Food sources by wealth group, Eastern Khors Agropastoral Zone Figure 19 Cash sources by wealth group, Eastern Khors Agropastoral Zone 45,000 40,000 SDG/Hh in reference year Percent of 2,100 kcal/person/day 200% 150% 100% 50% 35,000 30,000 25,000 20,000 15,000 10,000 5,000 0% Poor Gifts/remittances Staple purchase Crops Middle Better-off Non-staple purchase Livestock products Source: FEWS NET. 0 Poor Livestock sales Self - employment Middle Better-off Labour - casual Source: FEWS NET. All wealth groups were able to meet their minimum annual food requirement in the 2012/13 reference year (Figure 18). Own crops contribute a significant portion of household food among all three wealth groups. Sorghum is the primary crop, grown mainly for home consumption. Other garden produce includes okra, cucumber, and watermelon, which are mainly available Famine Early Warning Systems Network 21 January 2015 SUDAN Livelihood Profiles from June until December. Livestock, largely goats and limited sheep, Figure 20 Allocation of expenditures by provide milk and some meat. Camel milk is mainly produced by the wealth group, Eastern Khors better‐off group. Agropastoral Zone 100% Other All wealth groups purchase some sorghum, milk, and wheat flour, 90% especially between May and August. The poor group relies on markets Clothes for almost seven months of the year, more than twice as long as 80% households in the middle and better‐off groups. Poor households also Social acquire some cereal (sorghum or wheat) and milk in the form of gifts, 70% services mainly provided by the better‐off group. As of recent years, wild foods 60% Inputs are no longer a significant source of food due to recurring drought and environmental degradation associated with climate change. 50% Water 40% Compared with neighboring zones, this zone has limited income‐earning Hh items opportunities including: livestock sales (all groups), self‐employment 30% (mainly households in the middle group doing retail trade), and casual Non-staple 20% labor in urban areas or in gold mines (poor households) (Figure 19). Poor food households have recently relied more heavily on self‐employment 10% Staple food activities such as firewood and charcoal sales than in the past. However, exploitation is restricted (and strictly enforced) to the use of dry trees 0% Poor Middle Better-off and logs, which are difficult to find in nearby areas. Another major Source: FEWS NET. constraint is the lack of ready markets in most rural localities within the zone. The striking feature of expenditures in this zone is the unusually large purchases of nonstaple foods among the poor and middle groups. The better‐off group spends the lion’s share of their income on livelihood inputs (Figure 20). Incomes in this zone are nearly half those of the surrounding Eastern Pastoral (Zone 3). Purchasing power is, therefore, relatively more limited and income may be relatively more irregular. The broad implication of this economy is that while livestock‐related diseases and changes in livestock prices may disproportionally affect the better‐off and middle groups, this does not necessarily result in food insecurity, as both have enough livestock to sell to cope. Rather, the risk of food insecurity is greater among poor households as a result of crop, livestock, and casual agricultural labor income losses due to wind storms and heavy water flow in the khors. Primary food, cash, and expenditure cycle for poor households Poor households consume own‐produced (November to April) and purchased (May to November) sorghum as the staple cereal, complemented with purchased wheat and/or bread (Figure 21). Milk production (own livestock as well as access as herders) is available from September until April. No milk production occurs between May and August. The main sources of income available during the May‐August lean season are urban migratory work and firewood and charcoal sales. Other than food purchases, school fees in June/July and October and health care‐related expenses between July and September are particularly challenging, as they tend to fall during the lean season. Hazards and coping The main chronic hazards in this zone are: • Excessive flooding in the khors may destroy recently sown or germinating seeds; replanting, if possible, increases the cost of production and the risk of insufficient water toward the end of plants’ maturation cycle. • A late onset of rains (late July/early August) or below‐average rainfall in July/August may result in late flow of khors waters or low flow levels. In this event, green crop consumption is likely to be delayed and/or yields are likely to be poor. • If local pasture, fodder, and/or fodder availability are low due to drought, fodder and water prices will be higher than usual, particularly between August and October. Livestock sales (April‐November) are likely to be above average Famine Early Warning Systems Network 22 January 2015 SUDAN Livelihood Profiles and prices below average as more animals than usual must be sold to maintain the remaining herd at a higher cost than usual. • Excessive wind storms may result in both crop destruction and loss of livestock. • Significantly above‐average retail sorghum prices, particularly between May and September, may pose a threat to food access, especially for the poor group. • Crop pest and diseases, such as sorghum wilt, are common and may dampen yields. • The intensification of labor migration to gold mines lowers labor available for agriculture. Though agricultural labor wages may increase, if insufficient labor is available for harvest, some crops may be lost. Figure 21 Food access calendar for poor households in the Eastern Khors Agropastoral Zone Jan Feb Mar Apr May Jun Jul Aug Sep Oct Nov Dec Staple foods Sorghum Bread Milk Income Sale of goats and sheep Sale of firewood Sale of charcoal Sale of migrant labor (urban) Expenditures Education Health care Legend op op Own production mp mp Market purchase ik ik In-kind c c Gathering Source: FEWS NET. Poor households in this zone cope with crisis by migrating to urban areas (that is, Port Sudan) in search of labor opportunities earlier than usual, beginning in December/January instead of February. Intensification of charcoal and firewood sales is also common. The middle and better‐off groups tend to increase livestock sales, especially of less drought‐resistant livestock, such as cattle, sheep, and eventually goats. This reduces the chance of significant loss of livestock due to lack of pasture and water, and increases the income needed for purchase of water, animal feed for remaining livestock, and/or food. These groups may also purchase fodder or migrate longer distances with their livestock than to the usual Al Butanah grazing grounds toward southern Sudan. Famine Early Warning Systems Network 23 January 2015 SUDAN Livelihood Profiles COASTAL FISHING (ZONE 6) This zone comprises the settlements along the Red Sea coast, where fishing is the basis of livelihoods. This semidesert environment with sandy soils receives only 50‐100 mm of coastal winter rainfall between November and January each year. Rainfed cultivation is impossible. Even where there is some groundwater, the soil is too salty for successful garden crops. Despite these challenges, all wealth groups cultivate small plots of vegetables in the coastal plains, mainly cucumber and watermelon, using rain water runoff from the Red Sea Hills. No sheep and cattle live in this zone as adequate grazing land is not available or within migration distance; however, goats and camels thrive browsing the coastal scrub. Fish production is low from January‐March due to rough seas. April to June is the peak fish production period, both in terms of quantity and quality. Fish prices pick up from November to February, when demand increases due to annual events such as festivals, attracting many people in Red Sea state and other parts of Sudan including Khartoum. During the hot months of the “dead season” in July and August, fish move to deeper, cooler waters, and fishermen are required to stop fishing to allow the fish to breed (Figure 22). During this period, local inhabitants frequently sell shells to tourists or wealthy Sudanese for cash. Though fish is available, it is a less preferred food for the majority of this culturally mixed population. Fish is primarily for sale, collected by traders along the coast and sold in towns, notably Port Sudan and also Khartoum. Fish is mainly transported and delivered in privately‐owned refrigerated vehicles to ensure that it is fresh for consumption. Fish is, therefore, a valuable commodity, as long as it can be brought to market. Port Sudan and Suwakin are the chief collection markets of the zone. The fish are bought from villages by middlemen, who then obtain far higher prices at the collection markets. The main limiting factor for poor households in this value chain is the limited resources among the majority of the poor group to invest in rental or purchase of refrigeration facilities for purposes of earning more cash income. Significant losses occur due to poor refrigeration, which affects the quality of fresh fish to be sold in more distant markets such as Kassala, Al Qadarif, and Khartoum. As a result, fishing offers a marginal livelihood for much of the population, and very few other local options exist for wealth generation. Figure 22 Seasonal calendar for the Coastal Fishing Zone Jan Feb Mar Apr May Jun Jul Aug Sep Oct Nov Dec Seasons Rainy season Dry season Lean season Fishing Fishing high quality peak season High fish prices Closed season Livestock Lambing/kidding Milking Hazards Excessive winds and waves Legend p p Land preparation s s Sowing w w Weeding h h Harvest Source: FEWS NET. Physical access to the key markets of Al Qadarif, Kassala, Port Sudan, Khartoum, and Omdurman are relatively good due to the well‐developed road network. Most households consume sorghum sourced from Al Qadarif via Port Sudan and European wheat also via Port Sudan. Goats are a common asset sold year‐round on local markets for eventual consumption in Port Sudan. Famine Early Warning Systems Network 24 January 2015 Table 5 Determinants of wealth in the Coastal Fishing Zone Determinants of wealth Poor Middle Better-off Household percentage (%) 70‐80 10‐20 5‐15 Household size (#) 8‐10 6‐8 6‐8 Land holding Land area owned and 1‐2 1‐3 2‐4 cultivated (ha) Typical livestock holding (#) Goats 2‐4 8‐10 23‐25 Camels 0‐1 1‐11 3‐35 Donkeys 0‐1 0‐1 0 Other productive assets (#) Fishing boats 0 0-1 2-4 Fishing nets and hooks 0-2 0-2 1-3 Refrigeration facilities 0 0-2 0-4 SUDAN Livelihood Profiles Determinants of wealth The poor group has larger household sizes compared with other wealth groups (Table 5). The additional members provide them with much‐ needed casual labor resources to earn income upon which their livelihoods primarily rely. Wealth, on the other hand, is chiefly determined by livestock holdings and access to fishing equipment. Livestock holdings are skewed in favor of the middle and better‐off groups. All wealth groups own at least a few goats, but the majority of camels are owned by the middle and better‐off groups. These are mainly grazed on the small Source: FEWS NET. hectares of land owned by the different wealth groups. The other major determinant of wealth is ownership of and access to fishing equipment such as boats, refrigeration facilities, nets and hooks, etc. The equipment facilitates larger fish catches, the main source of income for the middle and better‐off groups. The poor group is normally hired by the middle and better‐off groups to use their fishing equipment. Although proceeds from fishing benefit individuals, established fishing groups exist mainly for purposes of regulation and marketing, among others. Sources of food and cash and expenditures With low rainfall and salty soils limiting agriculture, the bulk of energy for all wealth groups is derived from market purchases of sorghum, wheat flour, rice, sugar, cooking oil, meat, lentils, and okra. Purchased cereals contribute about 75 percent of kilocalories, as they are relatively cheap compared with nonstaple foods. Though all wealth groups obtain a small proportion of their food from fish consumption, it is considered a less preferred food. Fish is something of a “cash crop” in the zone. Own livestock products, especially camel and goat milk, provide varying levels of much‐needed protein among this coastal population. Figure 23 Food sources by wealth group, Coastal Fishing Zone Figure 24 Cash sources by wealth group, Coastal Fishing Zone 250,000 160% 200,000 140% SDG/Hh in reference year Percent of 2,100 kcal/person/day 180% 120% 100% 80% 60% 40% 20% 150,000 100,000 50,000 0% Poor Fish Staple purchase School feeding Middle Better-off 0 Poor Payment in kind Other Source: FEWS NET. Labor - casual Livestock product sales Middle Better-off Livestock sales Fish sales Source: FEWS NET. In the reference year, the poor group barely met the minimum kilocalorie requirements, which were supplemented by food assistance (school feeding) (Figure 23). Due to the rapid nature of the assessment method, it is possible that other minor, seasonal food sources were excluded from this analysis. Famine Early Warning Systems Network 25 SUDAN Livelihood Profiles Fish sales represent the largest share of income for all wealth groups (Figure 24). Fish are therefore a valuable commodity as long as they can be safely transported to the market. Again, poor households’ primary role in the economy of this zone is to supply casual labor. Casual labor markets include fishing labor, net making, serving in restaurants, and camel or goat herding, among others. Though the poor may sell shells, firewood, and water transport, particularly during the lean season, these do not appear to be meaningful options for income generation. The middle and better‐off groups have enough livestock to earn some income from livestock and livestock product sales, especially camel milk, in key urban areas such as Port Sudan. Poor households’ spending on food and household items consumes nearly all of the household budget, leaving little for investment in agriculture or fishing. The large livelihood investments by middle and better‐off households suggest that access to capital is a significant determinant of wealth in this zone (Figure 25). January 2015 Figure 25 Allocation of expenditures by wealth group, Coastal Fishing Zone Source: FEWS NET. Primary food, cash, and expenditure cycle for poor households Poor households primarily consume purchased sorghum, bread, and some milk. They also access milk from their own goats, as well from goats or camels they herd on behalf of the middle or better‐off groups from October until April (Figure 26). During the May‐August lean season when cereal prices are highest, some poor households have access to the sale of labor in restaurants; most attempt to sell shells and fish scales during the shutdown of fishing activities in July and August. Other than food purchases, major expenditures among the poor are school fees in October, specifically for inhabitants of Red Sea state, and higher health care‐related expenses from November to April due to increased incidence of malaria and diarrhea. Figure 26 Food access calendar for poor households in the Coastal Fishing Zone Jan Feb Mar Apr May Jun Jul Aug Sep Oct Nov Dec Staple foods Sorghum Bread Milk Income Sale of labor Sale of fish Sale of sea shells Expenditures Education Health care Legend op op Own production mp mp Market purchase ik ik In-kind c c Gathering Source: FEWS NET. Hazards and coping The main chronic hazards in this zone are: • • High winds and waves are a hazard between November and March. These conditions limit the distance that fishermen can search for fish, thereby reducing catches. Between November and January, unusually high turbidity may also reduce catches. Famine Early Warning Systems Network 26 January 2015 SUDAN Livelihood Profiles • Fish prices are usually highest between April to June, and this extra income is important for sustaining particularly poor households during the July/August dead season. As such, low fish prices during this season may pose a food security risk for poor households in July/August. • High temperatures cause fish to move to cooler, deeper water. This is a risk between April and October and may result in lower catches or lower demand for labor. • Significant changes in refrigeration or transportation costs or in underlying fuel costs may constitute a hazard to the fish marketing system, altering production costs and profit margins. To mitigate the impacts of hazards, poor households commonly intensify the sale of shells for additional income. They also migrate to urban areas such as Port Sudan for additional employment opportunities in restaurants, warehouses, and other port‐related activities. The middle and better‐off groups increase livestock sales, especially of older goats, and, in rare cases, of camels, to obtain extra income if needed. Famine Early Warning Systems Network 27 January 2015 SUDAN Livelihood Profiles EASTERN AGROPASTORAL SORGHUM (ZONE 7) The grassy plains of the Eastern Agropastoral Sorghum Zone stretch across Kassala and Al Qadarif states and to the western side of the Jazeera irrigation schemes to the White Nile River. Mean annual rainfall of 230‐240 mm (mid‐July through end October) is low for rainfed cropping, but the light, clay soils retain sufficient moisture for short‐cycle sorghum and some okra and are relatively fertile. Therefore, in two years out of three, rainfall totals and distribution are sufficient to support a modest cereal harvest. The land area cultivated by all wealth groups is significantly greater in this zone than in other agropastoral zones (for example, Eastern Khors Agropastoral) and own production represents a significant portion of household food sources for most groups, at least in two years out of three. The dense grasslands, crop residues, water pits (hafeers), and wells outside of cropping areas include the Al Butanah grazing area and not only provide good grazing for local livestock but are also sufficient to support livestock on seasonal migration from other northern and eastern pastoral and agropastoral zones. Thus livestock in this zone are kept primarily for milk, though significant income from livestock sales is also available to better‐off households. Livestock sales peak in the three months after the rains, when the animals are in the best condition. The availability of pasture favors sheep production, which is particularly remunerative given the export value of sheep in the Middle East. Calving, kidding, and lambing occur in July. However, most local people do not have access to milk between July/August and October during the rainy season due to livestock migration to grazing lands away from the homestead and cropping areas. Livestock return to the homestead to feed on crop residues after the harvest from November until the following July (Figure 27). Figure 27 Seasonal calendar for the Eastern Agropastoral Sorghum Zone Jan Feb Mar Apr May Jun Jul Aug Sep Oct Nov Dec Seasons Rainy season Dry season Lean season Cropping Sorghum Okra h h h h h Livestock Lambing/kidding/calving Milking Other Seasonal livestock movement Hazards Crop pest & diseases Livestock diseases Legend p p Land preparation s s Sowing w w Weeding h h Harvest Source: FEWS NET. Despite long distances (600‐1,000 km), physical access between the key markets of Al Qadarif, New Halfa, Kassala, Port Sudan, and Saudi Arabia is relatively good due to well‐developed road and railway networks and good ports. However, as with other zones, the challenge is the link between villages and the network of major markets. Two years out of three, most households sell some sorghum between December and June, though the majority of sorghum traded comes from surpluses produced by households in the better‐off group. Sorghum from local markets is often moved to the assembly and wholesale markets of in Al Qadarif to supply New Halfa, Kassala, and northeastern Sudan. 28 Famine Early Warning Systems Network January 2015 SUDAN Livelihood Profiles Sheep and camel sales are primarily directed toward export markets, either Egypt (camels) or the Gulf states (camels and sheep). Though camels may be marketed at any time of year, sheep sales peak between September and February. Goats tend to fill domestic demand in the direction of Khartoum. Determinants of wealth Wealth is chiefly determined by land area owned, Table 6 Determinants of wealth in the Eastern Agropastoral access to mechanization/transportation, and Sorghum Zone Poor Middle Better-off Determinants of wealth livestock ownership (Table 6). Household percentage (%) 55-65 25-35 10-20 Household size (#) 10-12 7-9 7-9 Middle and better‐off groups are able to cultivate Land holding large areas through access to mechanization for 6-10 10-14 140-180 Land owned and cultivated plowing and planting. In addition, they have access (ha) to vehicles to transport production to the main Typical livestock holding (#) markets, enabling them to capture a larger share Sheep 0 63-67 100-300 of the value chain. Poor households’ larger Goats 4-6 14-18 34-38 household sizes are better suited for providing Cattle 0 6-8 16-20 agricultural labor, especially weeding and Camels 0 2-4 5-7 harvesting. However, they lack the capital for Donkeys 0-2 0-2 0-2 mechanization and sufficient household labor to Other productive assets (#) cultivate larger expanses without mechanization. Donkey cart 0-2 0-2 0-2 Therefore, the poor cultivate smaller areas than Tractor 0 0 0-2 the middle or better‐off groups. They also market Motor vehicle 0 0-2 1-2 their products on local markets. They tend to lack Source: FEWS NET. cash to transport goods to higher‐value markets, and they sell in quantities too small to be of interest to higher‐value markets. Households in the middle and better‐off groups invest heavily in sheep production and hold a few camels and/or cattle primarily for milk and transportation. Poor households invest in low‐value livestock (goats) for milk and sale on domestic markets and, if possible, donkeys for transportation/burden. The poor tend to hold goats rather than sheep due to their higher risk aversion and need for income at shorter intervals than is possible to achieve with sheep. Goats are more tolerant of drought, and reproduce more quickly, kidding twice per year with a high chance of twins. Sources of food and cash and expenditures Own‐produced sorghum is the primary source of food in the zone, particularly among the middle and better‐off groups (Figure 28). Despite producing enough sorghum for household consumption, poor households typically sell part of the harvest to repay debts related to input purchases. They later purchase sorghum for consumption between May and October. All wealth groups purchase nonstaples such as bread, cooking oil, sugar, meat, okra, and onions. Wild foods do not contribute significantly to the minimum annual food requirement. Despite the large number of sheep in the zone, cows and goats are the main sources of milk, particularly among the middle and better‐off groups. All wealth groups met their minimum annual food requirement in the 2012/13 reference year, during which sorghum production was very good and sorghum prices relatively low. All wealth groups sell sorghum between December and February, possibly later for the middle and better‐off groups. However, sorghum sales among the poor group do not represent a significant portion of annual income. Rather, casual labor and self‐employment are the most important sources of income, capitalizing on poor households’ greatest asset, their unskilled labor (Figure 29). Livestock represent a significant source of income for the middle and better‐off groups. Sales of livestock, particularly sheep, peak during the three months after the rains, when animals are in good condition from new pastures and crop residues. Famine Early Warning Systems Network 29 January 2015 SUDAN Livelihood Profiles Figure 28 Food sources by wealth group, Eastern Agropastoral Sorghum Zone Figure 29 Cash sources by wealth group, Eastern Agropastoral Sorghum Zone 350,000 140% 300,000 120% SDG/Hh in reference year Percent of 2,100 kcal/person/day 160% 100% 80% 60% 40% 20% 250,000 200,000 150,000 100,000 50,000 0% Poor Nonstaple purchase Livestock products Middle 0 Better-off Staple purchase Own crops Poor Crop sales Labor - casual Source: FEWS NET. Poorer people have far fewer livestock and depend more on low‐value cash‐earning opportunities such as agricultural labor (weeding and harvesting) and herding. All wealth groups earn additional income from self‐employment activities, including brick making, wood collection, and gold extraction, among others. In terms of expenditure, spending on livelihood inputs tends to increase as reliance on food purchases decreases (Figure 30Figure 30). Middle Better-off Livestock sales Self-employment Source: FEWS NET. Figure 30 Allocation of expenditures by wealth group, Eastern Agropastoral Sorghum Zone Primary food, cash, and expenditure cycle for poor households Sorghum is the staple cereal of local inhabitants in the zone. In the reference year 2012/13, own sorghum harvest covers six months (November‐April) of annual food consumption for the poor group. The remaining six months (May‐October) are covered through market purchase of sorghum grain (Figure 31). Another important food in the zone is okra. Own okra harvest is consumed from August until January of the following year. The rest of the okra consumed is purchased from the market during the dry season and is sometimes collected in the bush as wild food. Source: FEWS NET. The most important sources of income during the lean season are the sale of goats, charcoal, and firewood and urban migratory labor. The major expenditure items among the poor group include school fees and other associated costs of education, especially in June and July, the high cost of health care from September to December and June to September, especially for malaria and diarrhea, respectively. Other seasonal diseases are also closely linked to the rainy season. Hazards and coping The main chronic hazards in this zone are: • A late onset of rains after the end of July will delay green harvests. A late start also increases the risk that rains will cease before crops are close enough to maturity, thereby potentially reducing crop yields. Famine Early Warning Systems Network 30 January 2015 SUDAN Livelihood Profiles • Even if the start of rains is normal, erratic rainfall in September, the main flowering and heading period for sorghum, may result in similar developmental delays and yield reductions. • Drought during the rainy season may result in simultaneously below‐average pastures and crop residues. Low fodder and water availability would likely result in poor animal body conditions as of February/March and low livestock prices (due to poor condition and above‐average sales) until pastures regenerate in August of the following year. • Given the almost total reliance on sorghum, sorghum wilt is a significant concern in this zone between August and January, and high sorghum prices weigh heavily on poor households, particularly between June‐August. • Livestock diseases may occur at any time of year, but those during the early part of the rainy season between July and October are most problematic as they occur during the peak milking period, resulting in losses of food and income from milk and above‐average neonatal mortality rates. Disease also increases the risk of livestock mortality. Figure 31 Food access calendar for poor households in the Eastern Agropastoral Sorghum Zone Jan Feb Mar Apr May Jun Jul Aug Sep Oct Nov Dec Staple foods Sorghum Okra Income Sale of goats Sale of agricultural labor Sale of firewood and charcoal Sale of migrant labor (urban) Expenditures Education Health care Legend op op Own production mp mp Market purchase ik ik In-kind c c Gathering Source: FEWS NET. To mitigate the impacts of shocks on household food consumption, poor households tend to capitalize on their greatest asset, their labor availability, by increasing migration to urban areas in search of employment. Other wealth groups intensify livestock sales and, to some extent, remittances from the Gulf states. Livestock sales help mitigate the increased risk of livestock mortality and simultaneously provide additional income for above‐average water and animal feed expenses. Migration to the Al Butanah grazing grounds for water and pasture remains a significant coping strategy. Famine Early Warning Systems Network 31 January 2015 SUDAN Livelihood Profiles FLOOD‐RETREAT CULTIVATION (ZONE 8) This zone is composed of several discontinuous areas of flood‐retreat cultivation: Tokar Delta in Red Sea state, the El Gash in Kassala state, the Sundus Project on the White Nile just south of Khartoum, and the Khor Abu Habil in the Al Rahad area straddling the boundary of Northern and Southern Kordofan states. Despite the geographical distance, these zones share a similar rainfall regime, insufficient alone for rainfed cultivation, but with sufficiently similar reliable access to regular floodplains and fertile alluvial soils to specialize in flood‐retreat cultivation. Agricultural activities occur year‐round and most importantly start with rehabilitation of earth embankments and opening and de‐silting of canals in March to June. Rainfall and retreating river and other surface water flow in this zone start in July/August, allowing progressive sowing of sorghum in mid‐August to early October for a harvest between December and January. There is also ongoing irrigation. The weeding period is quite prolonged, lasting from mid‐October to early March the following year due to the proliferation of mesquite (prosopis) shrubs, which compete with crops for groundwater but also constitute a key input for charcoal production. The dry season is from October until June with two major subseasons: winter (November to February) and summer (March to June) (Figure 32). Sorghum is the food crop of choice on these fertile alluvial soils; in recent years, it supplanted cotton as the most‐planted crop. Some production of vegetables occurs, notably tomatoes and watermelons but also cucumber, spinach, and okra, for home consumption and sale. Farmers intercrop pigeon pea for household consumption. Vegetables cultivated primarily for sale and primarily in the eastern segment of the zone around the Tokar Delta include hot and sweet peppers, eggplant, cucumber, and pumpkin. Though the zone offers some pasture and browse and most households own at least a few small ruminants, livestock is not a major economic driver in the zone. Most livestock in the zone are held by households in the middle and better‐off groups. Though households with a few small ruminants may keep them at or near the homestead, large herds typically migrate to the Al Butanah grazing area for water and pasture from July to mid‐October. Figure 32 Seasonal calendar for the Flood-retreat Cultivation Zone Jan Feb Mar Apr May Jun Jul Aug Sep Oct Nov Dec Seasons Surface water: Delta Al Gash Surface water: Delta Tokar Dry season winter summer winter Lean season Cropping Sorghum Okra Livestock Lambing/kidding/calving Milking Other Irrigation Seasonal livestock movement Hazards Silting of water canals Crop pests & diseases Legend p p Land preparation s s Sowing w w Weeding h h Harvest Source: FEWS NET. Famine Early Warning Systems Network 32 January 2015 SUDAN Livelihood Profiles Most households sell their produce, particularly cereals (November‐June) and goats (year‐round), and purchase wheat on local markets, including Sedon, Ed Damer, Atbara, Aroma, Wager, Tendelti, and Matateib. Links between these and Kassala, Khartoum, Omdurman, and Port Sudan (where wheat is imported from Asia/Europe) are fairly good year‐round due to the established road network. However, the distance to the biggest markets in Khartoum and Port Sudan limits access to these major demand centers. Furthermore, the same floods that make this zone so productive for recessional sorghum cultivation make roads impassable for days or weeks at a time, particularly between July and August. As with other zones in the center and east, sheep flow toward Port Sudan for export to the Gulf states, while goats remain within local markets or, possibly, move toward Khartoum for domestic consumption. Cattle may be moved along either chain, and camels tend to be exported toward Egypt via Ed Damer. Sunflower seeds are sold on local markets moving toward Khartoum and Gezira, particularly between December and April. Fresh vegetables are harvested mainly between November and April. Most vegetables flow from village markets toward Port Sudan or Khartoum, but some flow north toward Atbara or Ed Damer or south toward Gadaref. Determinants of wealth All wealth groups have similar household sizes in this zone, suggesting that household size is not a key determinant of wealth (Table 7). Rather, wealth is chiefly determined by land area owned and cultivated, access to mechanization, and, to a lesser extent, livestock ownership. All wealth groups cultivated fewer hectares than they owned in 2012/13, reportedly due to inadequate flooding (poor maintenance of canals). Wealthier households tend to own more livestock and to earn a relatively larger proportion of their income from livestock sales in a typical year. Given variability in flooding, livestock also constitute a source of resilience through savings for these households, allowing them to maintain investments in agricultural inputs key to their primary source of food and income, even after a bad year. Table 7 Determinants of wealth in the Flood-retreat Cultivation Zone Poor Middle Better-off Determinants of wealth Household percentage (%) 60-70 20-30 5-15 Household size (#) 6-10 6-10 6-10 Land holding Land area owned (ha) 0-2 8-12 35-40 Land area cultivated (ha) 0-1 4-6 15-20 Typical livestock holding (#) Sheep 0-2 10-20 20-200 Goats 0-9 5-20 0-7 Cattle 0-1 0-8 0-50 Camels 0 0-18 0-23 Donkeys 0-2 0-2 0-2 Other productive assets (#) Donkey cart 0 0-2 0-2 Tractor 0 0-2 0-4 Motor vehicle 0 0-2 1-3 Source: FEWS NET. Sources of food and cash and expenditures All wealth groups met the minimum annual food requirement in the 2012/13 reference year, during which own production in this agricultural zone contributed only about a quarter of the minimum average annual food requirement for each of the wealth groups (Figure 33). This decision to rely heavily on market purchases is a preference, as better‐off households could be self‐sufficient in sorghum production; instead they prefer to sell sorghum to purchase higher‐value or preferred staple and nonstaple foods. All wealth groups supplement own cereal production with market purchase of bread and often of sorghum, as well as sugar, cooking oil, meat, and vegetables, particularly okra. Poor households, on the other hand, sell sorghum and other agricultural products at harvest time to pay debts and purchase sorghum between January and September. Milk, primarily from camels, cows, and goats, is available from July until February the following year, while pasture and browse within the zone permit; a few milking animals may be kept near the homestead at this time while others may be sent to migrate away from cultivation areas between July and October. Annual household income and diversity are relatively greater among all three wealth groups than in many other zones, with the exception of the Central Irrigated Schemes (Figure 34). The middle and better‐off groups earn most of their income from sorghum and vegetable sales, particularly tomato and okra. In Tokar Delta, which is part of this zone, a wider variety of Famine Early Warning Systems Network 33 January 2015 SUDAN Livelihood Profiles vegetables (tomato, watermelon, hot and sweet peppers, eggplant, okra, cucumber, and pumpkin) is produced for cash income. Figure 34 Cash sources by wealth group, Floodretreat Cultivation Zone 140% 140,000 120% 120,000 SDG/Hh in reference year Percent of 2,100 kcal/person/day Figure 33 Food sources by wealth group, Flood-retreat Cultivation Zone 100% 80% 60% 40% 100,000 80,000 60,000 40,000 20,000 20% 0 Poor 0% Poor Payment in kind Other Middle Better-off Staple purchase Food aid Source: FEWS NET. Self-employment Livestock sales Crop sales Middle Better-off Labor - casual Livestock product sales Source: FEWS NET. Livestock equally offer greater earnings among the middle and better‐off groups compared with the poor group. The availability of pastures favors production of sheep and cattle. Livestock marketing is concentrated during the festive season from October to February. The poor earn the largest share of their cash income from casual agricultural labor: land clearing, planting, weeding, and cutting fodder. Though the varieties of sorghum and millet used in this zone are not suitable for mechanization, harvest labor represents a relatively small share of casual labor income. Poor households typically migrate to nearby urban markets in search of Figure 35 Allocation of expenditures by labor opportunities, particularly during the dead part of the agricultural wealth group, Flood-retreat Cultivation season in July/August. This is also the time when strong delta winds in the Zone Tokar Delta limit agricultural activity and agricultural labor demand. Despite this, the local demand for their labor from the middle and better‐ off groups who practice flood‐retreat agriculture is relatively stable most of the year. Charcoal production and sale is a key self‐employment activity that links wealth groups. The middle and better‐off groups engage in the sale of charcoal produced by the poor. Charcoal production and sale is lucrative year‐round among all wealth groups, particularly in the Tokar and Gash Deltas, due to the widespread availability of mesquite. Other forms of self‐employment include petty trade (retail shops and restaurants) as a primary income activity among some middle and better‐off households. The expenditure structure in this zone is agriculture‐based. Poor households, lacking sufficient land and investment capital for inputs to produce agricultural goods, spend more than half of their income on food. In order to grow food for sale, middle and better‐off households must spend heavily on agricultural inputs to meet their livelihood needs (Figure Source: FEWS NET. 35). Famine Early Warning Systems Network 34 January 2015 SUDAN Livelihood Profiles Primary food, cash, and expenditure cycle for poor households Poor households consume primarily sorghum and vegetables, particularly okra, from own production and purchase, as well as purchased bread. The most important sources of income available during the lean season are the sale of firewood, charcoal production, and domestic water sales. The major expenditures among the poor group include school fees in June and July, and increased health care‐related expenses during the rainy season due to the high prevalence of malaria (Figure 36). Figure 36 Food access calendar for poor households in the Flood-retreat Cultivation Zone Jan Feb Mar Apr May Jun Jul Aug Sep Oct Nov Dec Staple foods Sorghum Bread Okra Income Sale of firewood Sale of charcoal Sale of domestic water high prices low prices Sale of animal fodder Expenditures Education Health care Legend op op Own production mp mp Market purchase ik ik In-kind c c Gathering Source: FEWS NET. Hazards and coping The main chronic hazards in this zone are: • Sorghum wilt is the most common crop affliction important in the zone. Crop pests and diseases have the greatest impact between August and January. • The heavy reliance on, and therefore close proximity to, rivers leaves households vulnerable to excess flooding, resulting in delayed planting and delayed green harvests, as well as insufficient flooding, which reduces water available for irrigation and thereby constrains area planted or yields, particularly between June and December. • Heavy silting in canals requires more labor to remove; poor households without access to sufficient labor to de‐silt their canals may lose area accessible to flood irrigation or suffer low yields. • Given the relatively high reliance on markets among all wealth groups in this zone, high food prices between May and October without comparable increases in revenues may constrain food access. • January to May is the peak period for livestock diseases, which may increase livestock mortality, reduce milk yields, and worsen animal body conditions. In the case of highly contagious diseases or those detrimental to humans, reports of disease may even reduce demand and thereby prices for livestock. The poor group in this zone copes with crisis by increased urban migration in search of employment, especially during the lean period. The middle and better‐off groups primarily increase livestock sales. They may also request additional remittances from the Gulf states. Famine Early Warning Systems Network 35 January 2015 SUDAN Livelihood Profiles CENTRAL IRRIGATED SCHEMES (ZONE 9) This zone comprises the Gezira Irrigation Scheme in Al Gezira state, the New Halfa scheme in Kassala state, the Al Rahad scheme in Gezira and Gadaref states, and the Al Suki and Sinar irrigated schemes in Sinar state. The huge Gezira Irrigation Scheme, initiated more than 100 years ago, uses the Blue Nile River to feed a canal irrigation system. The New Halfa scheme dates from 1964, when Khashm el Girba Dam was created on Atbara River for a scheme on which to resettle some 50,000 people from Wadi Halfa displaced by the submergence of their home town under Lake Nasser behind Aswan Dam. The zone’s population is dense and includes both the original inhabitants of the area and migrants from other parts of Sudan who have settled into the economy and have small areas of land to cultivate. Rains in this zone are approximately 250 mm per annum between June/July and October. November to February are the cool, dry winter months, while the hot, dry months are from March to May/June. Though rains are insufficiently reliable for rainfed agriculture, they are an important supplement to irrigation between July and October. The Gezira (which means "island") is topographically unusual in that the soil slopes away from the Blue Nile in this area. Canals from the river, therefore, may naturally run away from the river due to gravity. The moderately fertile soil also has a high clay content, which reduces losses from seepage. This area, therefore, has high‐potential for irrigated agriculture. Agricultural activities are year‐round, and irrigation is critical between August and February (Figure 37). Most households in this zone produce sorghum and cotton. Wheat is also a food and cash crop for wealthier farmers. Some households also produce groundnuts, horticultural products, and orchards. Vegetable production is a year‐round activity for household consumption and sale. Cotton is common in the zone, though less so now than in the past. Government intervention in nationalized irrigation schemes was prominent in the 1960s and 1970s, and beginning at that time, the government mandated cotton production as a part of crop rotations in the irrigated schemes. Since the late 1980s and increasingly in the 1990s, privatization of irrigation schemes and liberalization of regulations resulted in greater choice in crop rotation and declining cotton production. Though the government attempts to incentivize cotton production through credit mechanisms, the low purchasing price from the government results in low returns. Consequently, only poor and middle group households tend to grow cotton. Figure 37 Seasonal calendar for the Central Irrigated Schemes Zone Jan Feb Mar Apr May Jun Jul Aug Sep Oct Nov Dec Seasons Rainy season Dry season Lean season Cropping Main season sorghum, wheat h h Off season sorghum, wheat h h h h h h h h p p p p p p s s s s w w w w p p s s w w h h h h w w h h Harvest Livestock Lambing/kidding/calving b b Milking Other Irrigation of crops Hazards Crop pests and diseases Livestock diseases Legend p p Land preparation s s Sowing w w Weeding Source: FEWS NET. Famine Early Warning Systems Network 36 January 2015 SUDAN Livelihood Profiles Rains are sufficient to support both browse and pasture in and around the zone, though most grazing livestock (cattle, sheep) spend part of the year in the Al Butanah grazing areas, in part to keep them away from crops. The main livestock activities (such as lambing, kidding, and calving) mainly occur in July, and milking starts around August until April, although generally in small quantities. Road, rail, and river networks between the key local markets of Wad Madani or Sennar, New Halfa, and Rabak are well connected to Khartoum for access to River Nile state (Addamir or Atbara) and Northern state (Dongola), to Kassala, or even to southern Sudan and South Sudan. These strong market connections facilitate marketing of agricultural commodities, notably sorghum, wheat, and groundnuts, particularly during the peak marketing period of December to April. The government‐owned Sudanese Cotton Company purchases cotton directly and exports it via Port Sudan to Europe, with domestic trade and transport taking place primarily between January and April. Determinants of wealth Significant differences between land area owned Table 8 Determinants of wealth in the Central Irrigated and cultivated indicate that access to income to Schemes Zone Poor Middle Better-off Determinants of wealth plow large land areas, either using own or hired Household percentage (%) 50-60 25-35 10-20 tractors, is a key determinant of wealth in this zone Household size (#) 7-9 6-8 6-8 (Table 8). Instead of assuming the high cost of Land holding mechanized production to cultivate all of their own Land area owned (ha) 5-7 8-10 8-10 land, poor and many middle group households Land area cultivated (ha) 2.5-3.5 4-5 60-75 rent up to half of their land to better‐off Typical livestock holding (#) households. Whereas poor households require Sheep 0 30-50 120-140 cash to purchase food, they are more inclined to Goats 2-4 8-10 15-25 rent their land for a fixed price in cash in advance Cattle 0 6-8 35-39 at the time of planting, which is near the lean Camels 0 0 0-12 season. Middle group households, however, are Donkeys 1-2 1-2 1-2 more likely to enter into a sharecropping Other productive assets (#) arrangement in the hopes of benefitting from the Donkey cart 0-2 0-2 0-2 higher yields available to the better‐off households Motor vehicle/tractors 0 0-1 1-2 able to invest in adequate inputs. Source: FEWS NET. Better‐off households have greater access to income to purchase, maintain, and market substantial sheep herds, as well as some cattle or camels. Livestock and livestock byproduct sales represent a lesser, though significant, source of income in the reference year for the middle and better‐off groups. In addition to this minor support during good years, the sale of livestock is a key source of livelihood resilience in the event of poor agricultural production, low producer prices, or individual household calamity. The cost of keeping livestock away from crops is a luxury most poor households cannot afford. Instead, poor households typically own a handful of goats to meet unexpected expenses, a donkey for transportation of goods, and no other significant livestock. They tend to have larger household sizes, better suited to meet large demands for unskilled labor in the agriculture, construction, and transportation sectors within the zone, as well as in nearby urban markets. Overall, an acute income inequality gap exists between the poor and middle group households, which comprise most (80‐90 percent) of the population, and the better‐off households. Income inequality may be due to economies of scale made possible by those who manage to afford high input costs (land rental and mechanized production, as well as seeds, fertilizer, pesticides, and water). On average, households in the better‐off group may cultivate more than ten times more land area and own three to four times the number of sheep compared to households in the middle group. Sources of food and cash and expenditures With the excellent production in the reference year 2012/13, all wealth groups met their minimum annual food requirement, and the middle and better‐off groups could have fed themselves entirely from own production (Figure 38). Many opted to buy preferred staples such as wheat, rice, and some millet, particularly during Ramadan festivities. Poor households were substantially, but not fully, self‐sufficient in sorghum. Poor households were unable to rely fully on own production due to debts for input purchases repaid by selling sorghum at harvest time. Poor households also sold sorghum to purchase wheat to vary their diet. Famine Early Warning Systems Network 37 January 2015 SUDAN Livelihood Profiles Figure 38 Food sources by wealth group, Central Irrigated Schemes Zone Figure 39 Cash sources by wealth group, Central Irrigated Schemes Zone 400,000 350,000 150% SDG/Hh in reference year Percent of 2,100 kcal/person//day 200% 100% 50% 0% Poor Nonstaple purchase Livestock products Middle 250,000 200,000 150,000 100,000 50,000 0 Better-off Staple purchase Own crops 300,000 Source: FEWS NET. Poor Crop sales Labor - casual Middle Better-off Livestock sales Self-employment Source: FEWS NET. In contrast to neighboring zones, crops make a significant Figure 40 Allocation of expenditures by contribution to both household food and cash income. Overall, own wealth group, Central Irrigated Schemes crops contribute about 50 percent of the minimum annual food Zone requirement among all wealth groups. Millet and sorghum are 100% harvested in October/November and consumed through May/June. Other 90% Poor households purchase sorghum between May and September. Clothes Nonstaple food items purchased include sugar, cooking oil, lentils, 80% dry meat, and vegetables, including dry okra. Goat meat and milk also 70% Social contribute to part of the food consumed by all wealth groups and services 60% camel milk among the better‐off. Livelihood 50% inputs All wealth groups obtain a significant share of their income from sales 40% Hh items of wheat, sorghum, sunflower, onion, and among the middle and 30% better‐off groups, cotton. In addition, livestock sales, particularly Nonstaple 20% food sheep, cattle, and goats, represent a significant source of income for the two wealthier groups. Supplementary sources of income include Staple food 10% self‐employment such as plowing services and livestock trade (Figure 0% 39). Poor Middle Better-off Source: FEWS NET. Input purchases are important for all wealth groups in this zone, with the major distinctions between wealth groups being the decline in the share of expenditure on food between the poor and middle groups (and the increase in discretionary expenditures) and the significant increase in input expenditures between the middle and better‐off groups (Figure 40). Primary food, cash, and expenditure cycle for poor households Sorghum is the main food of the poor group in the zone. In the 2012/13 reference year, own sorghum harvest covers seven months (October‐April) of annual food consumption for the poor group. The remaining five months (May‐September) are covered through market purchase of sorghum grain and bread or wheat. Okra and milk, either from own production or purchased, are also common in the local diet (Figure 41). The poor group relies on three main sources of income, in the following order of importance: the sale of crops (sorghum, vegetables, and animal fodder), agricultural labor (planting, weeding, harvesting, and herding), and seasonal urban labor migration, coupled with self‐employment (gold extraction and land rental). The most important income sources available during the lean season include the sale of construction labor, fodder, and agricultural labor (weeding). Part of the self‐ employment income noted for poor households includes a moderate amount of income either as cash or in kind through Famine Early Warning Systems Network 38 January 2015 SUDAN Livelihood Profiles sharecropping arrangements during the lean season or harvest, respectively, as payment for rental of their land by better‐off households. Figure 41 Food access calendar for poor households in the Central Irrigated Schemes Zone Jan Feb Mar Apr May Jun Jul Aug Sep Oct Nov Dec Staple foods Sorghum Wheat Income Agricultural labor Construction work Sale of animal fodder Expenditures Education Health care Legend op op Own production mp mp Market purchase ik ik In-kind c c Gathering Source: FEWS NET. Cash flow management is perhaps the greatest concern for poor households in this zone. The greatest challenge for expenditures among poor households is that reliance on markets for food (May‐September) coincides somewhat with peak social services expenditures (school fees in June and health care expenditures between June and September) and agricultural and other livelihood input expenditures (July‐October). Hazards and coping Whereas drought is a major hazard in other parts of Sudan, the reliance on river‐fed irrigation mitigates to a certain extent drought impacts on most livelihood activities in this zone. The main chronic hazards are: • Given the strength of the irrigation system, excessive floods tend to have a disproportionately greater negative impact on crop development than insufficient rainfall, though either may result in below‐average yields and, possibly, delayed green crop consumption. Rainfall and flood levels should be monitored, particularly between August and September/October. • Though irrigation is sufficient to stabilize agricultural production even in years with below‐average rainfall, rainfall is an important supplement to irrigation and surface water for livestock. Low rainfall is likely to result in some yield reduction and difficulty supporting livestock. • An unusually high prevalence of crop pests and diseases, particularly sorghum wilt, may also lower yields and/or delay the green harvest. • Livestock diseases or parasites may occur throughout the year, but are particularly common at the start of the rainy season. Above‐average livestock disease prevalence may result in poor animal body conditions, increased livestock mortality risk, reduced demand (particularly in the case of highly contagious diseases or those with possible impacts on human health), and reduced milk production. • Timely credit availability is important for poor and middle group households; delayed credit cycles may delay planting, resulting in lower potential yields. • Unusually heavy silting of the canals likely either increases production costs for de‐silting or reduces the flow of irrigation water to crops. The poor group in this zone copes with crisis by increasing the search for employment on local farms and in urban centers, as well as by providing casual labor to gold mining sites, especially between February and June. The main strategy among the middle and better‐off groups is to increase livestock sales and, if possible, remittances from the Gulf states. Increased livestock sales and new sources of income increase access to water and animal fodder/animal feed and facilitate migration farther and longer than usual if needed. Famine Early Warning Systems Network 39 January 2015 SUDAN Livelihood Profiles SOUTHEAST RAINFED SEMI‐MECHANIZED AGRICULTURE (ZONE 10) This large, highly populated zone spreads from the southern corner of Kassala state across Al Qadarif, Sennar, Blue Nile, White Nile, and parts of South Kordofan states, including some parts of the Nuba Mountains area and the Habila mechanized scheme. The mean annual rainfall ranges from 400 mm at the northern limit up to 900 mm towards the south between mid‐ June until the end of October, with greater length and lesser variability in rainfall towards the southern part of the zone. The dry season is from November until early July. The clay soils are fertile. Natural vegetation cover is grassland as well as bush and tree species that become forest towards the south. Combined with clay soils suited for holding water, the rains are generally sufficient in quantity and regularity to support rainfed agriculture. The main food crops grown are sorghum and, to a lesser extent, millet in the northern areas of the zone. Sesame is the main cash crop, followed by cotton and sunflower seed grown by wealthier farmers. Sorghum grown on large‐ scale, mechanized plots must also be seen as a cash crop. Small‐scale, pump‐irrigated, rainfed, and riverine vegetable production are year‐round activities and provide food and cash income (Figure 42). The bulk of crop production in terms of volume comes from a number of large‐scale concessions (60‐500 ha), where tilling is done mechanically. However, most of the rest of the agricultural cycle on these commercial plots is usually done by hand so long as human labor is cheaper than mechanical weeding, insecticide spraying, or mechanical harvesting. Poor households, however, who account for 60 percent of the population, cultivate small plots of 4‐6 ha. Agricultural labor is in high demand in this zone. Field reports suggest that soil fertility has declined over the past ten years, reducing crop productivity. The use of fertilizer is now inevitable despite the risks of runoff, since it is believed to increase crop yields, especially of sesame. Some households, on the other hand, have increased pesticide use as a strategy to reduce labor demand in the face of labor supply constraints due to competition from gold mining. The grass pastures, together with crop residues and purchased fodder, allow wealthier households to keep large herds of sheep and/or a significant herd of cattle. Seasonal livestock migration to the Al Butanah grazing areas takes place from place from July until October, so as to avoid disruption of cropping. Lambing, kidding, and calving mainly occur in January and July, and milking lasts from August until April. Milk availability between January and April is significantly lower than between August and December because conditions are drier and because of competition with calves. Similar to human diseases, the incidence of livestock diseases normally increases during the rainy season. Figure 42 Seasonal calendar for the Southeast Rainfed Semi-mechanized Agriculture Zone Jan Feb Mar Apr May Jun Jul Aug Sep Oct Nov Dec Seasons Rainy season Dry season Lean season Cropping Sorghum Sesame Livestock Lambing/kidding/calving Milking Other Seasonal livestock movement Hazards Crop pests & diseases Livestock diseases Drought and dry spells Legend p p Land preparation s s Sowing w w Weeding h h Harvest Source: FEWS NET. Famine Early Warning Systems Network 40 January 2015 SUDAN Livelihood Profiles Access between key markets within and outside of this zone by road, rail, and river is very good. Key markets include: (assembly/retail) Al Qadarif, El Damazin, Sennar, and El Obeid; and (wholesale/retail) Wad Medani, Khartoum/Omdurman, Rabak, and Port Sudan. In addition, feeder roads between commercial farms in the zone and the main transportation networks are fair during the dry season, resulting in relatively good market access, though heavy rainfall may occasionally damage or block roads and bridges. The peak marketing season for sorghum is during the main harvest between January and March. El Damazin and El Obeid are the main assembly markets for the zone, flowing through Sennar or Rabak to Khartoum. Formal and informal exports of sorghum and oil crops (for example, sesame) to Ethiopia and Eritrea are also significant. Smaller quantities of Sudanese sesame are also exported to Japan and Europe. Otherwise, sesame usually follows similar market flows as sorghum but between November and March and with an additional significant flow from Wadel Helw to Kassala or Al Qadarif states. Sheep are marketed mainly towards the Gulf states via Port Sudan between September and February, whereas year‐round cattle and goat market flows, destined primarily for domestic consumption, move towards Khartoum. Determinants of wealth Compared to the other zones assessed, wealth and Table 9 Determinants of wealth in the Southeast Rainfed income are the most inequitably distributed in this Semi-mechanized Agriculture Zone zone (Table 9). Wealth in this zone is chiefly Poor Middle Better-off Determinants of wealth determined by land area owned and cultivated, as Household percentage (%) 50-60 20-30 10-20 well as by access to key markets outside of the Household size (#) 8-10 8-10 8-10 zone for marketing agricultural produce or, more Land holding importantly, livestock. Land area owned (ha) 4-6 60-70 500-520 Land area cultivated (ha) 4-6 60-70 500-520 The majority of poor households are either Typical livestock holding (#) migrants settled from other parts of Sudan or Sheep 0 43-47 240-300 those living off of portions of formerly larger Goats 1-3 6-10 6-10 familial landholdings fragmented through Cattle 0 0-3 52-60 inheritance and population growth. They cultivate Camels 0 0 0 by hand, or, if possible, using rented tractors. Donkeys 0-2 0-2 0-2 However, better‐off households may cultivate up Other productive assets (#) to 100 times the land area of poor households. Donkey cart 0-2 0-2 0-2 Most large‐scale landowners live in major urban Tractor 0 0-1 1-4 areas rather than within the rural livelihood zone. Motor vehicle 0 0-1 1-2 Source: FEWS NET. This does, however, reinforce the significance of the economic links between the urban and rural areas. A significant proportion of the land “owned” by the better‐off group has been acquired directly from the government either via purchase or long‐term lease as a part of the government’s plan to increase agricultural productivity in Sudan. Access to government officials for negotiating land transactions, therefore, may be or may have been a determinant of wealth in the zone. Other distinguishing productive assets among all three wealth groups are tractor and motor vehicles, mainly owned by the better‐off group. These assets are critical to cultivating large land areas and accessing the higher‐value markets of Khartoum and Port Sudan necessary to maintain and increase wealth. Similarly, the majority of the poor group sells its livestock on local markets within the zone. However, households in the middle and better‐off groups market their sheep in Kassala or Port Sudan (for export to the Gulf states) and their cattle in Kassala or Qadarif, Rabak, Damazine, or Sinar Sinjah, and sometimes even directly in Khartoum. Sources of food and cash and expenditures All wealth groups met their annual food requirement during the 2012/2013 reference year, with 35‐45 percent of kilocalories derived from own production (Figure 43). Sorghum is consumed year‐round, both as a green crop during the end of the lean season and as dried grain over the rest of the year. Households also consume small quantities of millet and vegetables such as okra for accompanying sauces. Most households, though particularly the better‐off group, could have met their annual minimum food requirements from own‐produced sorghum and milk production; however, they tended to sell the majority of their production to purchase preferred foods such as wheat flour and rice. It is worth noting that poor households spend Famine Early Warning Systems Network 41 January 2015 SUDAN Livelihood Profiles a share of their income nearly twice as large as middle and better‐off households on staple food purchase. Other nonstaples purchased by all wealth groups in varying quantities are sugar, cooking oil, lentils, dry meat, and vegetables, including okra (fresh or dry). Figure 44 Cash sources by wealth group, Southeast Rainfed Semi-mechanized Agriculture Zone 140% 800,000 120% 700,000 100% 600,000 SDG/Hh in reference year Percent of 2,100 kcal/person/day Figure 43 Food sources by wealth group, Southeast Rainfed Semi-mechanized Agriculture Zone 80% 60% 40% 20% 500,000 400,000 300,000 200,000 100,000 0% Poor Gifts/remittances Staple purchase Own crops Middle Better-off 0 Nonstaple purchase Livestock products Source: FEWS NET. Poor Crop sales Labor - casual Middle Better-off Livestock sales Self-employment Source: FEWS NET. Dairy production in the zone relies predominantly on cows and goats. Though poor households may get some milk from their own animals, they tend to rely heavily on in‐kind payments in milk from middle and better‐off groups in exchange for livestock‐related labor, through shared milking animals, or through gifts and religious tithe (zakat) systems. Crop sales represent a significant source of cash, even among poor Figure 45 Allocation of expenditures by households (~20 percent of annual cash income as compared to 60‐80 wealth group, Southeast Rainfed Semipercent of income among the middle and better‐off groups) (Figure mechanized Agriculture Zone 44). Sesame was the primary cash crop, though sorghum and millet are 100% Other also sold by all groups. The poor cannot grow sesame due to lack of 90% cash for agricultural inputs, particularly fertilizer. Clothes 80% 70% Social Households in the middle and better‐off groups earn the remainder of services 60% their income from livestock sales and self‐employment, primarily trade Cost of 50% (retail or agricultural commodities) and equipment rental. Poor production 40% households, on the other hand, rely on casual labor opportunities for Water about 70 percent of their annual income, primarily in the agriculture 30% Hh items sector (weeding, harvesting, and threshing, and herding), but also in 20% nearby towns as porters or as transporters using donkey carts, in 10% Nonstaple construction as general labor, or in brick making. Some poor food 0% Staple food households also earn income through self‐employment, such as Poor Middle Better-off firewood collection and sale, water vending, and working in gold Source: FEWS NET. mines, though this represents less than 10 percent of annual income. Here again, the share of expenditure required for food and household items constrains poor households’ ability to spend on agricultural inputs, which are critical to producing the dramatic income gains observed among middle and better‐off households (Figure 45). Primary food, cash, and expenditure cycle for poor households In the 2012/13 reference year, households consumed own‐produced sorghum for about six months, between mid‐October and April. Poor households consumed purchased sorghum between May and early October and purchased wheat year‐round. 42 Famine Early Warning Systems Network January 2015 SUDAN Livelihood Profiles Milk and okra are also key foods. Own livestock milk, in addition to milk derived from herding livestock of the better‐off group is usually available from August to April, and poor households often purchase milk (powdered) between May and July (Figure 46). The most important source of income available during the May to July lean season is primarily self‐employment, though the revenues from these activities are usually small (firewood or charcoal sales) or unreliable (working in gold mines). As such, many households choose to send at least one able‐bodied member of the household, usually male, to look for work in nearby urban markets. Poor households face cash flow constraints during the lean season, when they rely almost entirely on markets for food and when social services expenditures are concentrated. School fees must be paid in June/July, and health care costs tend to be higher during the June‐October wet season. Figure 46 Food access calendar for poor households in the Southeast Rainfed Semi-mechanized Agriculture Zone Jan Feb Mar Apr May Jun Jul Aug Sep Oct Nov Dec Staple foods Sorghum Wheat Milk Okra Income Agricultural labor Herding Sale of firewood & charcoal Sale of migrant labor (urban) & gold extraction Expenditures Education Health care Legend op op Own production mp mp Market purchase ik ik In-kind c c Gathering Source: FEWS NET. Hazards and coping The main chronic hazards in this zone are: • Sorghum wilt is the most common crop ailment. Crop pests and diseases are particularly problematic between August and October. • Livestock diseases occur throughout the year, but particularly after rains, and cause poor livestock conditions, increasing mortality among animal herds. While households in middle and better‐off groups can afford vaccinations and have enough livestock to sustain some loss without significant impact on livelihoods, diseases affecting goats are most problematic as goats are the primary livestock asset of poor households. • Below‐average or poorly distributed rainfall between August and October may result in slow crop development and below‐average crop yields. • Given the significant proportion of income from crop sales across all wealth groups (and from agricultural labor by the poor), this zone is particularly vulnerable to the low producer prices that commonly result from exceptionally good agricultural production. Depending on the quantity of produce sold by households, low producer prices for sorghum, wheat, and groundnuts between November and July could signal below‐average incomes in the zone. • Flooding, a risk between August and October, may also contribute to slow maturation or below‐average crop yields. The poor group in this agropastoral zone copes with shocks by intensifying self‐employment activities and the search for labor opportunities, particularly in urban areas. In general, the middle and better‐off groups increase livestock sales. This mitigates Famine Early Warning Systems Network 43 January 2015 SUDAN Livelihood Profiles loss of livestock due to lack of pasture and water and simultaneously reduces feeding and watering expenses while increasing income for the same. Famine Early Warning Systems Network 44 January 2015 SUDAN Livelihood Profiles ANNEX 1: COST STRUCTURE FOR AGRICULTURE No. 1. 2. 3. 4. 5. 6. 7. 8. Total Table A1.1 Average cost of production for rainfed crops per feddan Items Unit Cost (SDG) Land rent and taxes 1 feddan 45 Plowing 1 feddan 35 Weeding 1 feddan 200 Seeds 1 feddan 20 Harvesting 1 feddan 100 Threshing 1 feddan 30-37 Empty sack 12 sacks 36 Transport Per sack 6 448 SDG/feddan No. 1. 2. 3. 4. 5. 6. 7. 8. 9. 10. 11. 12. 13. Total Table A1.2 Average cost of production for irrigated agriculture per feddan Items Unit Cost (SDG) Irrigation fees 1 feddan 115 Land preparation 1 feddan 150 Planting 1 feddan 60 Weeding 1 feddan 60 Seeds 1 feddan 20 Herbicide 1 feddan 90 Tools 1 feddan 15 Pesticide 1 feddan 275 Fertilizer 1 feddan 250 Harvesting 1 feddan 100 Threshing 1 feddan 30-37 Empty sack 12 sacks 60 Transport Per sack 6 1,130 SDG/feddan Famine Early Warning Systems Network 45 January 2015 SUDAN Livelihood Profiles ANNEX 2: LIST OF FIELDWORK PARTICIPANTS No. 1. Name of Participant Fatima Elhassan Eltahir Title Assistant National Coordinator 2. Wafaa Badawi Nutrition Specialist 3 4. 5. 6. Salma Rashid Abdul Rahim Norein Lemia M. Elhag Aziza Eltayeb Osman Food Security Specialist National Technical Manager Food Security Specialist Director of Food Security 7. Suheir Khalafalla Food Security Officer 8. James Acidri Livelihood Consultant Institution Food Security Technical Secretariat, Federal Ministry of Agriculture and Irrigation Federal Ministry of Health Nutrition Program USAID, Office of Food for Peace FEWS NET USAID, Office of Food for Peace Department of Planning and Agricultural Economics, Federal Ministry of Agriculture and Irrigation Department of Planning and Agricultural Economics, Federal Ministry of Agriculture and Irrigation Evidence for Development on behalf of FEWS NET Famine Early Warning Systems Network 46
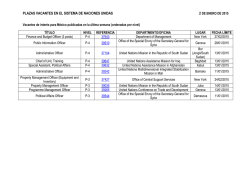
© Copyright 2026