
High Pressure 0-17 Longitudinal Relaxation Time Studies in
High Pressure 0-17 Longitudinal Relaxation Time Studies
in Supercooled H 0 and D 0
2
2
E . W. Lang and H . - D . Lüdemann
Institut für Biophysik und Physikalische Biochemie, Universität Regensburg, Postfach 397, D-8400 Regensburg
Flüssigkeiten
/ Hohe Drücke
/ Magnetische Kernresonanz
/ Transporterscheinungen
/ Zwischenmolekulare
Wechselwirkungen
The spin-lattice relaxation times 7j of the oxygen-17 isotope in light and heavy water have been measured at 13.56 MHz in the temperature range
457 K to 238 K and up to pressures of 250 MPa. Below 300 K all isotherms exhibit maxima of 7j which become most pronounced at the lowest temperatures measured. A marked isotope effect is seen in going from light to heavy water. The ratio [7i ( H 0 ) / 7 i (0 0)}
is temperature
dependent and increases with decreasing temperature. Furthermore the isotherms in D 0 exhibit a stronger pressure dependence than the
isotherms in H 0 . The correlation times r derived from H-T and 0-7~j in heavy water are identical at all pressures and temperatures and
demonstrate the isotropic nature of the orientational fluctuations of the molecules in liquid water. The temperature dependence of T can at low
pressures {p < 150 MPa) be described by a fractional power law with a singular temperature 7~, whereas at high pressure (p > 150 MPa) the
isobars can only be fitted by the VTF-equation with the ideal glass transition temperature T . T as well as T are found to be higher in heavy water
compared to light water.
17
]1
2
2
Tp
l 7
2
1 7
2
2
17
0
X
0
s
0
Introduction
physical properties, which in their combination are found in
this liquid only. Some examples for these anomalies are
MD
= 277 K in H 0
2
the
resp.
284 K in D 0) and the compressibility minimum around 320 K .
2
Application of hydrostatic presssure leads at
as the temperature dependence of the correlation
times. In
order to study this isotope effect more quantitatively,
oxygen-
17 studies in H 0 and D 0 enriched with this isotope were
2
2
performed.
Experimental
temperatures
< 300 K to an initial increase of the mobility of liquid water. A
minimum in the viscosity-isotherms and a maximum in the selfdiffusion coefficient-isotherms
0
from light to heavy water must influence the pressure - as well
Liquid water at temperatures T < 300 K has many unusual
temperature of maximum density ( r
s
is observed in the pressure range
set ween 0.1 and 200 M P a [1]. Since all these anomalies are
most pronounced in the vicinity of the melting pressure curve it
appears desirable to extend the study o f the properties o f liquid
water into the metastable supercooled range. In the last years a
/ariety of physical properties of supercooled water has been
studied by Angell and collaborators [1]. The experimental diffix i t i e s in studying supercooled water are significantly reduced
The spin-lattice relaxation times of the oxygen-17 nucleus were obtained at 13.56 M H z on a Varian XL-100-15 F T NMR-spectrometer
equipped with a high power pulse amplifier and interfaced to a 16 K
Varian 620-1-100 computer by a y - T - n - r - y pulse sequence.
The emulsions were contained in a high pressure glass capillary with
i.d. 1.2 mm and o.d. 7 mm. Details of the high pressure equipment
have been described elsewhere [5,6]. The pressures extend to 250 MPa.
They were measured by a precision Bourdon gauge (Heise, Newton,
C T , USA) to ± 0 . 5 MPa and generated with standard (-*-)" equipment
(HIP, Erie P A , USA). The temperatures were determined to ± 0 . 5 K by
a chromel-alumel thermocouple. The temperature has been varied from
457 K to 238 K into the supercooled region. Due to electronic limitations of the spectrometer we have not been able to measure T at lower
temperatures. The emulsions were prepared from triply destilled light
and heavy water enriched to 25% with 0 (GFK-Isotopenstelle, Karlsruhe, BRD) and emulgated in a mixture of 50% w/w methylcyclohexane and 50% w/w methylcyclopentane (E. Merck, Darmstadt,
BRD). In order to stabilize the emulsions 4% w/w of an emulgator
(Span 65, Serva, Heidelberg, BRD) were added to the cycloalkanes.
The components were degassed carefully in the sample container (Fig.
1 A) on a high vacuum line by at least five freeze-pump-thaw cycles to a
final pressure of 7 mPa. The emulsions were prepared after flame
sealing the neck of the sample container by rigorously slashing the
mixture through a stainless steel net (635 mesh, Spörl & C o . ,
Sigmaringendorf, BRD). In order to fill the high pressure cell, the
sealed container with the emulsion was mounted on the filling
x
when it is possible to apply the measurements to water emul-
1 7
;ions [2].
NMR-measurements can take full advantage of this emulsion
echnique and thus the spin-lattice relaxation times T o f the
{
protons in light water and the deuterons in heavy water are to
)ur knowledge the only properties that could be measured at
pressures up to 300 M P a down to the homogeneous nucleation
emperature [3, 4]. These studies revealed that the anomalous
)ressure dependence of the T -isotherms becomes much more
x
)ronounced in the supercooled region and showed qualitatively
hat the substitution of the protons by the deuterons in going
Ber. Bunsenges. Phys. Chem. 85, 603-611 (1981) - © Verlag Chemie GmbH, D-6940 Weinheim, 1981.
0005-9021/81/0707-0603 $ 02.50/0
- Sample Container
Vacuum
Line
o
-o
~o
"
~°
t
457K
A23K
Z.03K
393K
353K
Neck for Flame
" Sealing
258K
.. Taper Joint
= Epoxy-Resin
a, Ai
- Taper Joint NS32
Stainless Steel
Stainless
Steel Net
200
250
—_/?(MPa)
-High Pressure Glass Cell
A) Filling Apparatus
B) Sample Container
l E 4873 1j
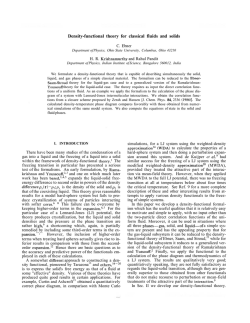
Fig. 1A
Glass apparatus for the filling of the high pressure cells with oxygen
free water cycloalkane emulsion
Fig. 2
Pressure and temperature dependence of the longitudinal relaxation
times T of the oxygen-17 in H 0
s
2
Fig. IB
Glass ampoule for the preparation oxygen free water cycloalkane
emulsions.
During operation the parts given here are connected to a high vacuum
line by taper joints. Final pressure: 7 mPa
o 457K
423K
o A03K
o 383K
apparatus (Fig. 1 B). After degassing the whole apparatus carefully for
at least 24 hours the connections to the vacuum line were closed and the
neck of the sample container broken off by winding up of the fishing
line. About 1 cm of the emulsion was then allowed to flow into the
filling funnel. After the emulsion had filled the pressure cell completely
the lower part of the filling apparatus was taken apart and the neck of
the filling funnel flame sealed.
278K
3
268K
Theoretical
The spin-lattice relaxation of the oxygen-17 nucleus is entirely due to
its intramolecular quadrupole interaction [7]. The time-dependence of
this interaction is caused by the rotational motion of the water molecules. For a nucleus with / > 1 ( 0: / = 5/2) the decay of the resulting
spin magnetization does not neccessarily obey the Bloch-equations [8],
However in the fast motional limit the measured spin-lattice relaxation
rate T{~ of the 0-nucleus is given by
17
1
TT
1
=
200
250
~/}(MPa)
17
3
e QQ\
125
h
2
1
2
1+
n
X
(1)
)
with r : = J(0) = ] G(t) d/ an effective microscopic time constant
o
characterizing the decay of the relevant orientational fluctuations of
e
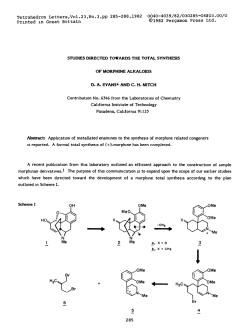
Fig. 3
Pressure and temperature dependence of the longitudinal relaxation
times T] of the oxygen-17 in D 0
2
in water has not been reported in the literature. At normal pressure,
however, several authors measured the temperature dependence of the
0 - T in light water [9-13). Especially Hindman et al. reported 7J in
H O to temperatures as low as 242 K [13]. Extrapolation of the data
given here at p - 5 MPa to p = OA MPa and comparison with the
older data shows good agreement in the whole temperature range
(Table 1). The only older measurement of 0 - 7 in D 0 [10] found at
302 K identical 7j-values in light and heavy water. This results is in
marked disagreement with the results reported in this paper. In the
whole pressure- and temperature range studied the ^O-T^ values are
17
1
n
2
the molecules.
and rf are the quadrupole coupling constant
h
°f
O-nucleus respectively the asymmetry parameter of the
electric field gradient q at the nucleus.
CI7 .QC
t
n
e
a
v
n
0
Results
17
]
17
Figs. 2 and 3 contain the spin-lattice relaxation times 7j of the 0 nucleus between 457 K and 238 K and pressures up to 250 M P a in
H 0 and D O . The data are also compiled in Tables 1 and 2. To the
best of our knowledge the pressure dependence of T of the 0-nucleus
, 7
2
n
2
17
x
longer in H
1 7
2
0 than in D
, 7
7
0 . The ratio (
2
' T (H
•'
x x
17
2
0)
X
1
is tem-
'r,p
perature dependent and increases with decreasing temperatures.
Furthermore the pressure dependence of the low temperature 7j-iso-
Table 1
Spin-lattice relaxation times T (ms) o f the oxygen-17 nucleus in H
x
p(MPa)
7"(K)
457
423
403
383
353
323
309
299
283
273
268
263
258
253
248
243
238
a
b
50
59
44.9
36
30.3
21.2
12.3
9.29
7.38
4.84
3.52
2.51
2.08
1.67
1.27
0.88
0.60
0.42
100
59
44.5
36
31.4
21.2
13.2
9.65
8.16
4.84
3.95
2.89
2.50
2.10
1.54
1.12
0.86
0.66
59.3
44.1
35.9
30.6
21.6
13.7
10.6
8.59
5.46
4.09
3.33
2.83
2.29
1.82
1.40
1.17
0.80
150
200
60.7
44.5
37.4
31.2
21.9
13.9
10.2
8.49
5.62
4.33
3.39
2.93
2.39
1.99
1.59
1.26
0.87
0.1
(extrapolated) )
250
59.5
44.7
35.9
29.70
21.6
13.8
10.2
8.62
5.72
4.43
3.83
3.48
2.75
2.11
1.71
1.35
1.00
3
59
44.7
37.4
31.6
22.5
14.2
10.4
8.49
6.08
4.22
3.74
3.16
2.62
2.18
1.73
1.41
0.99
, 7
0.
2
0.1
(Ref. [12]) )
0.1
(Ref. [ l l ] ) )
OA
(Ref. f!3]) )
21
12.3
9.0
7.0
4.4
3.1
2.6
2.1
1.7
60
45
37
29.2
20
12
9
7.1
4.5
3.2
2.6
2.1
1.6
6'
45
3o
2S.7
R l
1-..6
8.8
\0
b
59
45
36
30.5
21
12.5
9.2
7.4
4.6
3.4
2.4
1.93
1.55
1.23
0.83
0.57
0.40
b
b
iA
}.0
:A
1.91
'.44
:.05
0.74
0.5
0.32
) Data obtained by extrapolation o f the isotherms measured from 5 M P a to 0.1 M P a .
) Data calculated with the resp. fit-equations published by Hindman et a l . (Ref. [11 - 1 3 ] ) .
Table 2
Spin-lattice relaxation times 7, (ms) o f the oxygen-17 nucleus in D
n
2
O
P (MPa)
5
T(K)
457
423
403
383
353
338
323
309
298
283
278
273
268
263
258
253
248
243
52
39.5
32.5
23.7
16.0
13.0
9.57
7.07
5.51
3.49
3.12
2.15
1.82
1.41
1.18
0.86
0.56
0.29
0
52
38.7
32.5
24.1
16.2
13.4
9.88
7.59
5.93
3.90
3.28
2.65
2.17
1.75
1.46
1.08
0.79
0.52
1
0
0
1
50.5
38
32
25
17.0
13.4
10.6
7.90
6.24
4.27
3.69
2.90
2.38
1.96
1.63
1.21
0.95
0.68
5
0
2
49
38
32
24.1
16.9
13.7
10.7
8.16
6.66
4.31
3.90
2.86
2.61
2.15
1.72
1.34
1.05
0.76
0
0
2
49
38
31.2
24.8
16.9
14.1
11.1
8.32
6.55
4.40
4.11
3.06
2.73
2.30
1.87
1.44
1.08
0.83
5
0
3
49
38
32.2
25.6
17.3
14.1
11.3
8.22
6.66
4.80
3.80
3.10
2.86
2.35
1.90
1.47
1.12
0.90
0
0
_
-
26.0
17.6
_
11.0
8.11
7.10
4.60
4.21
_
--
Table 3
Compilation of determined and estimated quadrupole coupling constants C I 7 - Q C and CdQC from the literature together with the values used in this paper
0
Phase
CDQC
Gas
HDO
318.6 ± 2.4
Ref.
Ref.
10170 ± 70
[39]
0.06 ± 0.16
liquid
H 0
(8200-7600) ± 200
(9000 - 8000)
7700 ± 100
7700 ± 100
?
D 0
2
supercooled
liquid
D 0
H 0
2
214 ± 12
= 0
6600 ± 100
6600 ± 100
[4]
2
ice Ih
H 0
6525
11330
6600
11330
2
D,0
a
213.4 ± 0.3
213.2 ± 0.8
[43]
[44]
0.112 ± 0.005
0.100 ± 0.002
n
) This value has been chosen as the mean o f the experimental results in D O - i c e Ih and H
2
water [4].
[40]
0.75 ± 0.01
l 7
2
±
±
±
±
15
50
100
50
[12]
[9]
[10]
[10]
0.93 ± 0.01
0.93 ± 0.01
a
0.925
0.06
0.935
0.06
[41]
[42]
[45]
[42]
±
±
±
±
a
0.02
0.06
0.01
0.06
0 - i c e Ih in accordance with the result found for C ;
DQ(
)
)
in supercooled
therms is stronger in heav\ water than in light water. In the supercooled
region the maxma of the 0-7", isotherms are much more pronounced
and closely folow the trends observed for the 7j of the protons and
deuterons in tie respective liquids [3, 4]. This drastic increase of the
mobility after ipplication of pressure has hitherto only been found in
liquid water.
7
Discussion
15]. A similar change is to be expected in the case of C
. To
a first approximation it appears thus permissible to neglect any
pressure- and temperature dependence of the quadrupole
coupling constant.
1 7
The C
of supercooled liquid heavy water was found to be
close to the value determined in the low pressure solid phases of
water. The C
measured for H O and D 0 in different
ice phases do show no influence o f the hydrogen isotope upon
this quantity. We therefore choose C
= 6.6 ± 0.1 M H z
and )]Q = 0.93 ± 0.01 observed i n ice In as temperature- and
pressure independent parameters for light and heavy water to
calculate the orientational correlation times r via E q . (1) from
the experimental O - 7 j .
D Q C
n
J 7
The Quadruple Coupling Constant
In order tccalculate from the T values measured the correlation times T, the quadrupole coupling constants of the 0 nucleus ( C
) of the water molecules in the fluid phase is
needed. Tabe 3 compiles available estimates and determinations of C
of the water molecules in its different phases. A s
can be seen f om a comparison with C
in different phases [4]
the C
is subject to the same relative reduction ( - 3 5 % ) i n
going from he gase phase to the solid state. It is thus to be
expected tha the C
will change with temperature and pressure. However no independent way of determining such a temperature dependence is yet available. The conclusions drawn in
the literature range from almost no temperature dependence
[12] to a tenperature dependence with a minimum at - 3 1 0 K
[9]. For the C
all available experimental evidence indicate a
reduction of about 5% of C
with decreasing temperature i n
the range T ^ 373 K to 273 K and no pressure dependence [14,
r
, 7
1 7
c
1 7
2
2
1 7
e
n
] 7
D Q C
1 7
1 7 o ( c
D Q C
D Q C
Fig. 4
Representation of the 5 MPa isobar of the orientational correlation
times T for D 0 by the Speedy-Angell and VTF-equation
(T = 134 K, T = 229 K).
Open circle: t derived from the JH-T^ by Jonas et al. [15, 48].
Open triangles: r derived from the ?H-7i of Ref. [4].
Full circles: r derived from the ^O-r,
(
2
0
s
e
e
e
Estimate of the Correlation Times
1 7
The absolute values of the correlation times r in D 0 obtained with E q . (1) exhibit the same pressure- and temperature
dependence as those calculated from the W-T [4, 16] as can be
seen in Figs. 4 and 5. Whereas the numerical coincidence of the
two sets of correlation times depends on the choice of the
respective quadrupole coupling constants, their corresponding
pressure- and temperature dependence does not. This clearly
shows the isotropic character of the orientational fluctuations
of the water molecules. Since the main axes systems of the
e
2
2
X
Fig. 5
Representation of the 200 MPa isobar of the orientational correlation
times r for D 0 by the Speedy-Angell and VTF-equation
(7~o = 139 K, T = 175 K).
Open circles: T derived from the fH-r, by Jonas et al. [15, 48].
Open triangles: T derived from the fH-7i of Ref. [4].
Full circles: r derived from the ^O-r,
e
2
s
9
0
e
same equations as the latter [4], i. e. in the low piessure region
{p < 150 MPa) by the singular equation proposed by Speedy
and Angell [18] and Anasimov et al. [35]
2.0
2 50 M P a
A,(D,' O)
7
-y
r = r • e
e
"
1.0
•
•
•
T- T
P =
s
(2)
1
J
and in the high pressure region (p > 200 M P a ) by the V T F equation [19-21]
2.0H
B
r = r exp
e
0
(3)
T- T -)•
5MPa
n
The data have been analysed with a least squares fit program.
The relevant parameters obtained from this fit are compiled in
the Tables 4 and 5. The same analysis has been applied to the
1.0250
300
350
400
450
correlation times r derived from the 0 - r , in light water. The
IE A 873.6]
corresponding parameters are included in Tables 4 and 5 also.
Fig. 6
The
VTF-equation, which applies to water under high hydroRatio of the 'gO-Tj obtained in H 0 and D 0 as function of temstatic
pressure, is known to describe successfully the temperaperature for 5 and 200 MPa
ture dependence of transport coefficients in many viscous
liquids [22, 23]. A t the glass transition, characterized through
deuterium and oxygen-17 electric field gradient tensors are
the
ideal glass transition temperature 7 the system reaches a
different in a molecular axis system, anisotropic reorientation
state
of lowest potential energy compatible with a fully amorof the water molecules should lead to different pressure- and
phous
arrangement of the molecules [24]. According to the free
temperature dependences of the relaxation times of 0 and H
volume
theories of the glass transition [25, 26] the liquid has
[8, 17]. A comparison of the correlation times r in H 0 and
lost
at
T all its free volume so that diffusional processes
D 0 shows shorter correlation times in light water than in
become
impossible. The entropy theory of the glass transition
heavy water. Also the pressure- and temperature dependence of
[27] identifies T with a state of vanishing configurational
T (D 0) \
T is different in H , 0 and D , O . The ratio
entropy of the liquid. The experimentally determined glass
T (H 0)
transition temperature T is for kinetic reasons found always
thus temperature dependent and is shown in Fig. 6 for 5 M P a
- 1 0 - 2 0 K above T [1, 23]. The fast crystallization of liquid
and 200 M P a . These results reveal a complicated isotope effect
water prohibited the direct determination of T for this
which neither scales with the respective moments of inertia nor
substance until now. Measurements of T in aqueous binary
with the masses o f the two molecules.
systems led to an extrapolated glass transition temperature for
pure water of T (0.1 M P a ) = 140 K and T (200 M P a ) = 146 K
Temperature Dependence of the Correlation Times in Light
in light water [28, 29] and T (0.1 M P a )
144 K in heavy water
and Heavy Water at Constant Pressure
[29]. In amorphous vapour deposited water a glass transition
The correlation times r derived from O-T of heavy water
temperature T = 140 K has been found [30]. F r o m the temare identical to the results found for the H - 7 j (see Figs. 4
perature dependence of the specific heat C at constant pressure
and 5). Their temperature dependence can be described by the
Kanno and Angell [31] evaluated an ideal glass transition tern, 7
e
2
2
0
1 7
2
I 7
0
2
I 7
0
2
1 7
1 7
x
n
0
2
0
1 7
x
2
g
0
g
g
g
g
g
ll
e
x
g
2
p
Table 4
Parameters obtained by least-squares fitting the correlation times r to E q . (2)
e
p
(MPa)
± 2(K)
D 0
0.1
5
50
100
150
y ±
H 0
2
230
229
221
210
196
H 0
2
223
221
215
204
189
1.85
1.87
1.93
2.11
2.37
D 0
2
± 0.01
± 0.02
± 0.02
± 0.02
± 0.1
corr. coef.
, 3
• 10- (S)
D 0
2
1.89
1.87
1.96
2.11
2.56
±
±
±
±
±
H 0
2
0.05
0.02
0.02
0.02
0.1
3.74
3.67
4.23
4.95
6.73
± 0.1
± 0.2
± 0.1
± 0.1
± 0.2
3.42
3.67
3.78
4.95
6.00
±
±
±
±
±
D 0
H 0
0.9998
0.9993
0.9996
0.9994
0.9991
0.9991
0.9993
0.9997
0.9992
0.9978
2
2
2
0.1
0.2
0.1
0.1
0.2
Table 5
Parameters obtained by a least-squares fit o f the correlation times r to E q . (3)
e
p
(MPa)
2
150
200
250
T ±2 (K)
H 0
0
D 0
137
139
143
2
131
134
135
B ± G (K)
H 0
B
D,0
633 ± 3
604 ± 3
563 ± 3
2
652 ± 5
623 ± 7
581 ± 5
(T
0
± Or ) •
D 0
2
6.6 ± 0.3
6.1 ± 0.5
7.0 ± 0.6
0
1 4
1 0 - (s)
H 0
2
4.6 ± 0.3
4.6 ± 0.5
5.9 ± 0.3
D 0
2
0.9998
0.9997
0.9997
corr. coef.
H 0
2
0.9996
0.9992
0.9986
perature 7 (0.1 M P a ) = 130 K in light water, at which the total
configuratioaal entropy (S,liquid
S ) should be exhausted.
The ideal gl^ss transition temperatures T obtained for super-
r - i ( H O ) ~ 725 c m "
0
0
ke
1
r
2
l
0
( D 0 ) = 547 cm
2
which leads to
0
cooled light water under high hydrostatic pressure, i.e. T
0
V(H Q)
(200 M P a ) - 134 K , is - 1 2 K lower than the experimental T
g
r - (D O)
2
ä
1
3
4
J
0
2
[29]. T shov/s a slight increase with pressure with a pressure co0
compared to
AT
( K ^
efficient of — 2 _
.03
). Extrapolation to atmosAp
\ MPa /
pheric pressure leads to T (0.1 M P a ) - 128 K in H 0 and is in
=
0
0
/(D 0)
2
= 1.38 ,
/-moment of inertia.
/(H 0)
2
2
good agreement with the above mentioned value T (0.1 MPa)
0
= 130 K [31]. A s can be seen from Table 5, T in D 0 is,
It thus seems reasonable to assume that the librational motions
compared to H 0 , higher by - 5 K . This isotope effect is in very
control the orientational fluctuations of the water molecules
good agreement with 7 ( D 0 ) -
r ( H 0 ) = 5 K found by
under high hydrostatic pressure (p > 150 M P a ) . The collective
Kanno et al. [32] for aqueous electrolyte solutions. In D 0 the
configurational fluctuations connected with the glass transition
same pressure coefficient for T (P) is found as in H 0 . Extra-
appear to dominate the orientational fluctuations which charac-
polation of T (P)
terize the rotational motions of the molecules in supercooled
0
2
2
g
2
g
2
2
0
0
2
to p = 0.1 M P a leads to T (0.1 M P a ) =
Q
134 K for I ) 0 which again is about 10 K below the extra2
liquid water in this pressure range.
polated experimental glass transition temperature T (0.1 M P a )
In the low pressure region (p < 150 M P a ) liquid water shows
= 144 K . These results are included in a supplemented phase
an anomalous decrease of r with increasing pressure which
diagram of light and heavy water in Fig. 7.
becomes much more pronounced in the supercooled region. A t
g
0
low pressures the VTF-equation containing the extrapolated T 0
temperatures discussed above or a T corroborated by any other
0
Water
experimental results [31, 34] fails to describe the temperature
dependence of r . Especially at low temperatures r
e
e
increases
much faster with decreasing temperature than the VTF-equation would predict (see Fig. 4). A s in the case of the deuteriumT [4] the temperature dependence of r can thus best be acx
0
counted for with a fractional power law first proposed by
Speedy and Angell [18] and Anasimov et al. [35].
The singular temperature T has been interpreted as the
s
boundary of the free energy surface for liquid water or as a line
of metastable higher order transitions running across the free
energy surface [1]. Table 4 compiles the parameters found for
light and heavy water. Table 6 compares the singular temperatures 7 obtained in H 0 and D 0 with estimates taken from the
S
2
2
Table 6
Comparison of the temperatures T. obtained with data from the literature
7; (K)
p (MPa)
This paper
1004—
50
150
200
— -
250
300
p(MPa)
Fig. 7
Part of the phase diagram of H 0 and D 0 showing the pressure and
isotope dependence of the homogeneous nucleation temperature 7" ,
the singular temperature T of Eq. (2) and the glass temperature r
2
2
H
0
A m a r k e d i s o t o p e effect is also seen i n the p r e e x p o n e n t i a l
factor r o f the V T F - e q u a t i o n w h i c h u p o n i s o t o p i c s u b s t i t u t i o n
Ref. [18
225
228
223
221
0.1
5
10
50
100
150
190
228
224
212
192
175
215
204
189
T
(
M
P
a
( K )
*
Ref. [46]
)
This paper
0
scales with (he square root of the respective moments of inertia.
r can obviously be converted into a frequency which should
yield information about those intra- or intermolecular vibrations whose stochastic excitation and damping influence the
orientational correlation times. These frequencies fall into the
spectral region of the librational motions of the water molecule
in the liquid which also transform with the square root of the
moments of inertia upon isotopic substitution [23]. A t p = 200
M P a one obtains:
0
Ref. [47]
H,0
100
s
Ref. [46]
R e f
. [31]
D o
2
0.1
5
10
20
50
70
100
120
150
190
230
229
236
233
221
230
210
217
196
195
155
233
226
221
211
206
200
literature. Considering the difficulty of a precise determination
of this temperature, the agreement is reasonably good. It
should be mentioned that the homogeneous nucleation which
occurs —10 K above 7 limits the experimental data to e > 0.05
and thus excludes the region o f e which in other critical phenomena is most sensitive to the proper choice of the exponent
y(e - 1 0 ~ - 1 0 ~ ) . A s can be seen from Table 4 the isotope
effect measured in the correlation times r is at p < 150 M P a
only reflected in the parameter T , A t equal values of (T- 7~)
light and heavy water must therefore have identical correlation
times T . Fig. 8 shows this data reduction f o r p = 5 M P a - p =
150 M P a . The pressure dependence o f T parallels that of the
homogeneous nucleation temperature T up to p = 150 M P a as
can be seen from the supplemented phase diagram in F i g . 7.
S
4
6
0
%
s
0
s
H
The data indicate that T will fall below T in the pressure range
p - 2 0 0 - 2 5 0 M P a . The characteristic frequency r " corresponding to the preexponential factor r in E q . (2) falls in the
energy spectrum of liquid water into the frequency region of the
hydrogen-bond bending motions [33] which transform under
isotopic substitution with the square root of the respective
molecular masses. The absence of an isotope effect in r larger
than the limits of experimental error ( <20%) is then readily explained. The identification of the characteristic frequencies r
with the hydrogen-bond bending motions indicates the nature
of the fluctuations connected with the proposed thermodynamic singularity at T . These fluctuations produce in the
random hydrogen-bonded network regions with locally ordered, tetrahedrally coordinated water molecules with almost
linear hydrogen bonds and these cooperative order-disorder
fluctuations of the random network control the orientational
fluctuations of the molecules in supercooled water under low
hydrostatic pressure. It is the formation and decay of these
ordered, low density regions in the random network of water
which leads with decreasing temperature to the rapid increase of
the correlation times r . Application of pressure leads to a
distortion of the random hydrogen-bonded network and the
liquid is forced to adopt in the time average more compact arrangements with smaller hydrogen-bond angles and with
mutual interpenetration of subsections of the random network
resulting in an increase of the average number of nearest
neighbour molecules. The formation of locally ordered regions
in the random network is therefore strongly reduced by hydrostatic pressure. A s the topology of the network changes to more
compact arrangements with bent hydrogen-bonds, the cooperative order-disorder fluctuations become suppressed by the
collective configurational fluctuations dominating the dynamic
behaviour of normal viscous liquids. The pressure dependence
of the correlation times r should be enhanced at lower temperatures since in this region the ordered arrays should be more
perfectly developed and of a larger size than at higher temperatures so that the "structure breaking" influence of high hydrostatic pressure must become more pronounced. Recently Geiger
et al. [36] showed in a molecular dynamics calculation that
water at temperatures below room temperature is well above its
bond percolation threshold. Liquid water can thus be regarded
as a random hydrogen-bonded network which is continuously
breaking and reforming under the influence of the thermal
motion of the water molecules. Very recently Stanley [37, 38]
proposed a correlated site percolation model for the description
of supercooled liquid water. In the framework of this model
several predictions can be made that can be tested against the
results given here:
s
0
1
s
s
- 1
s
s
0
0
a) The rotational correlation time r increases rapidly at the
approach of T . This agrees with the observed temperature
dependence of r .
0
H
0
b) r should be longer in D 0 than in H 0 .
0
Fig. 8
Representation of the isobars of the correlation times T in H 0 and
D 0 by the reduced temperatures of Table 4. The different isobars
have for the sake of clarity been displaced by one order of magnitude.
open circles: r derived from O-T in H O
full circles:
r derived from 0 - 7 ; in D 0
full triangles: T derived from H - r , in D 0 of Ref. [4]
full squares: T derived from H - r in D 0 of Jonas et al. [15, 48]
0
2
xl
0
w
x
2
17
1 7
e
2
2
0
2
2
9
t
2
2
2
The measured isotope effect verifies this prediction.
2
c) Hydrostatic pressure lowers the correlation times.
This behaviour has been found at temperatures T < 300 K
and pressures p < 200 M P a and it could be shown that the
pressure dependence o f T is stronger in heavy water than in
light water.
0
d) r is higher j D 0 than in H 0 .
s
n
2
2
The r -vabes obtained from E q . (3) show this isotope effect
(see Fig. ) .
s
r
e) T decrease with increasing pressure much stronger than the
melting pessure curve.
s
This is in agreemeni with the pressure dependence o f T obtained (se> Fig. 7).
s
f) The press ire dependence of 7~ parallels the pressure dependence of T .
characterized by the Speedy-Angell-equation [2] become suppressed in this pressure range and are replaced by the collective
configurational fluctuations described by the VTF-equation [3].
The expert technical assistance by Mr. R. Knott and Mr. S. Heyn
made this study feasible, their contribution is gratefully acknowledged.
The work presented here was supported by the Deutsche Forschungsgemeinschaft and the Fonds der Chemischen Industrie.
s
References
l{
U p to p =- 150 M P a this prediction is in agreement with our
results. Tiey indicate however that it may not be the case
above p ~ 2 0 0 - 2 5 0 M P a (see Fig. 7).
Angell et l . [1) determined a variety of thermodynamic
properties of supercooled water and could show that water in its
supercooled state has very unusual static properties. The T
studies presented here and i n two previous reports [3, 4] do
reveal that sjpercooled water also possesses a very anomalous
dynamic behaviour. As has been shown by Angell and coworkers, the static response functions seem to be controlled by a
thermodynamic singularity at a temperature T which lies only a
few degrees lelow the homogeneous nucleation temperature T
and which, £ the 7", -studies showed, is also o f relevance for the
dynamic behaviour o f the molecules in supercooled water at
lower pressures. The large density-, energy- and entropy fluctuations corresponding to these static response functions led
Speedy and Angell [18] to the suggestion that the anomalies
may be due to cooperative order-disorder fluctuations in the
random hydrogen-bonded network. The identification of the
characteristic frequencies T ~ with the hydrogen-bond bending
motions whi h can develop only in the open hydrogen-bonded
network with linear hydrogen bonds supports this explanation.
Furthermore the measurement of the spin-lattice relaxation
times T in H 0 and D 0 revealed a remarkable isotope
effect. The correlation times r of the orientational fluctuations
are longer in D 0 than in H 0 . The fact that T is higher in D 0
than in H 0 explains the isotope effect observed in the correlation times ar low pressures, i.e. at the same reduced temperature e light and heavy water do show identical dynamic
behaviour (^e Fig. 8).
[1] C . A . Angell, in: Water - A Comprehensive Treatise, Vol. 7, ed.
by F. Franks, Plenum Press, New York 1981, in press.
[2] D. H . Rasmussen and A . P. McKenzie, in: Water Structure and
the Water Polymer Interface, ed. by H . H . Jellinek, Plenum
Press, New York 1972.
[3] E . Lang and H . - D . Lüdemann, J. Chem. Phys. 67, 718 (1977).
[4] E . Lang and H . - D . Lüdemann, Ber. Bunsenges. Phys. Chem. 84,
462 (1980).
[5] G . Völkel, E . Lang, and H . - D . Lüdemann, Ber. Bunsenges. Phys.
Chem. 83, 722 (1979).
[6] U . Gaarz and H . - D . Lüdemann, Ber. Bunsenges. Phys. Chem. 80,
607 (1976).
[7] A . Abragam, The Principles of Nuclear Magnetism, Oxford University Press, London 1961.
[8] H . W. Spiess, in: N M R Basic Principles and Progress, Vol. 15, ed.
by P. Diehl, E . Fluck, and R. Kösfeld, Springer-Verlag, Berlin
1978.
[9] J . A . Glasel, Proc. Natl. Acad. Sei. 58, 27 (1967).
[10] B. B. Garrett, A . B. Denison, and S. W. Rabideau, J. Phys.
Chem. 71, 2606 (1967).
[11] J . C. Hindman, A . J. Zielen, A . Svirmickas, and M . Wood, J .
Chem. Phys. 54, 621 (1971).
[12] J. C. Hindman, A . Svirmickas, and M . Wood, J . Phys. Chem.
74, 1266 (1970).
[13] J. C . Hindman, J . Chem. Phys. 60, 4488 (1974).
[14] T. DeFries and J. Jonas, J . Chem. Phys. 66, 5393 (1977).
[15] Y. Lee and J. Jonas, J . Chem. Phys. 57, 4233 (1972).
[16] E . Lang, Dissertation, Universität Regensburg 1980.
[17] W. T. Huntress, Jr., in: Advances in Magnetic Resonance, Vol, 4,
ed. by J. S. Waugh, Academic Press, New York 1970.
[18] R. J. Speedy and C . A . Angell, J. Chem. Phys. 65, 851 (1976).
[19] H . Vogel, Phys. Z . 22, 645 (1921).
[20] G . Tammann and W. Hesse, Z . Anorg. Chem. 156, 245 (1926).
[21] G . S. Fulcher, J . Am. Ceram. Soc. 77, 3701 (1925).
[22] G . Harrison, The Dynamic Properties of Supercooled Liquids,
Academic Press, London 1976.
[23] C . A . Angell, J. Chem. Educ. 47, 583 (1970).
[24] J. Wong and C . A . Angell, Glass-Structure by Spectroscopy,
Marcel Dekker Inc., New York 1976.
[25] M . H . Cohen and D. Turnbull, J. Chem. Phys. 31, 1164 (1959).
[26] M . H . Cohen and G. S. Grest, Phys. Rev. B 20, 1077 (1979).
[27] G . Adam and J. H . Gibbs, J. Chem. Phys. 43, 139 (1965).
[28] C. A . Angell and E . J. Sare. J. Chem. Phys. 52, 1058 (1970).
[29] H . Kanno and C . A . Angell. J . Phys. Chem. 81, 2639 (1977).
[30] M . Sugisaki, H . Suga, and B. Seki, Bull. Chem. Soc. Jpn. 41,
With increasing pressure the anomalies vanish and at pressures above p = 200 - 250 M P a liquid water behaves like a
normal viscous liquid. The same appears to be true for the static
response functions mentioned above which at pressures p >
200 M P a resemble those o f normal poiyalcohols [31]. The temperature dependence o f the orientational correlation times
could be described best i n this pressure region by the VTF-equation which includes as a characteristic temperature the ideal
glass transition temperature 7 . Increasing pressure lowers T
very rapidly and it is to be expected that T will fall below T at
pressure a n n d 200 - 2 5 0 M P a . This implies, that in supercooled liquid water the cooperative order-disorder fluctuations,
2591 (1968).
[31] H . Kanno and C . A . Angell. J . Chem. Phys. 73, 1940 (1980).
[32] H . Kanno, J. Shirotani, and S. Minomura, Bull. Chem. Soc. Jpn.
53, 2079 (1980).
[33] G . E . Walrafen, in: Water - A Comprehensive Treative, Vol. 1,
ed. by F. Franks, Plenum Press, New York 1972.
[34] A . Korosi and B. M . Fabuss, Anal. Chem. 40, 157 (1968).
[35] M . A . Anasimov, A . V. Voronel, N. S. Zangol'nikova, and G . J.
Ovodov, JETP Lett. 15, 31~ (1972).
[36] A . Geiger, F. H . Stillinger, and A . Rahman, J. Chem. Phys. 70,
4185 (1979).
[37] H . E . Stanley, J . Phys. A12, 329 (1979).
[38] H . E . Stanley and J . Teixeira, J. Chem. Phys. 73, 3404 (1980). •
[39] P. Thaddeus, L . C . Krisher, and T. H . N . Loubser, J . Chem. j
Phys. 40, 251 (1964).
J
The Stanley model of supercooled liquid water thus accounts
qualitatively for most of the experimental findings reported in
this paper.
Concluding Remarks
a
r
s
H
S
1
c
, 7
{
2
, 7
2
8
2
2
s
2
2
0
s
s
) U
0
[40] J. Verhoeven, A . Dymanus, and H . Bluyssen, J. Chem. Phys. 50,
3330 (1969).
[41] D. T. Edmonds and A . Zussman, Phys. Lett. 41 A, 167 (1972).
[42] O. Lumpkin and W. T . Dixon, Chem. Phys. Lett. 62, 139 (1979).
[43] D. T. Edmonds and A . L . Mackay, J. Magn. Reson. 20, 515
(1975).
[44] P. Waldstein, S. Rabideau, and J. A . Jackson, J. Chem. Phys.
41, 3407 (1964).
[45] H . W. Spiess, B. B. Garrett, R. K. Sheline, and S W. Rabideau,
J. Chem. Phys. 51, 1201 (1969).
[46] H . Kanno and C. A . Angell, J. Chem. Phys. 70, *008 (1979).
[47] M . Oguni and C. A . Angell, J. Chem. Phys. 73, 948 (1980).
[48] J. Jonas, T. DeFries, and D. J. Wilbur, J. Chem Phys. 65 , 582
(1976).
(Eingegangen am 26. Februar 198%
endgültige Fassung am 18. März 1>81)
E 4873
Laser-Blitzlichtphotolytische Untersuchungen zur Druckabhängigkeit der Reaktion
CIO + N 0 + N -> C10N0 + N
2
2
2
2
W. Dasch, K . - H . Sternberg und R. N. Schindler
Institut für Physikalische Chemie, Universität Kiel, Olshausenstraße 40-60, D-2300 Kiel 1
Freie Radikale / Gase / Photochemie
/
Reaktionskinetik
The kinetics of the reaction CIO -I- N 0 + N
C 1 0 N 0 + N was investigated at room temperature in the pressure range 28 <P < 824 mbar
by ClO-absorption measurements. As source for CIO radicals C1 0 was used. The reaction was initiated using monochromatic light pulses from a
KrF*-excimer laser at A = 248.5 nm. A Xe-high pressure lamp and a pulsed Mg-hollow cathode lamp respectively were used es analytic light
sources. The atomic emission of the hollow cathode source at A = 285.2 nm coincides with the 8. vibrational state of the CIO absorption. The
results are discussed and compared with data obtained in other experimental studies as well as in model calculators.
2
2
2
2
2
I. Einleitung
Nach bisherigen Modellberechnungen führen Chloratome,
die zu einem wesentlichen Anteil aus der Photolyse der Freone
stammen, in der Stratosphäre zur katalytischen Zersetzung von
Ozon. Bildung von Chlornitrat, C 1 0 N 0 , in der Atmosphäre
k ö n n t e den Ozonabbau verlangsamen, da in diesem Produkt
ein Teil des aktiven Kettenträgers Chlor gebunden ist [1]. Zur
Berücksichtigung dieser Schutzfunktion durch C 1 0 N 0 - B i l dung in Modellrechnungen sind kinetische Informationen zur
Bildung und zur Zersetzung von Chlornitrat unter atmosphärischen Bedingungen von Bedeutung.
Der vorliegende Bericht über Untersuchungen zur Druckabhängigkeit der C10N0 -Bildungsgeschwindigkeit basiert auf einer blitzspektroskopischen Studie unter Verwendung eines
KrF*-Excimeren-Lasers. A l s ClO-Radikalquelle wurde Dichlormonoxid C 1 0 eingesetzt. Der Druck des chemisch inerten dritten Stoßpartners Stickstoff wurde im Bereich 26 - 822 mbar variiert. Wegen des kleinen Absorptionskoeffizienten von N 0
für das Photolysenlicht kann sichergestellt werden, daß >99970
der absorbierten Strahlung zur Zersetzung des Dichlormonoxids dient.
2
2
2
2
2
Die durch Photodissoziation von C I 0 ausgelösten Reaktionsschritte führen zur Chlornitratbildung nach dem folgenden
Reaktionsschema ( l ) - ( 3 ) .
Die bisherigen Kenntnisse zur Geschwindigkeit der Chlornitratbildung stammen im wesentlichen aus 3 Gruppen von sehr
unterschiedlichen Experimenten: Zur ersten Gruppe gehören 3
unabhängige Untersuchungen, die in Strömungssystemen im
Niederdruckbereich bis 8 mbar N durchgeführt wurden. Z a h niser et al. [2] verfolgten die Reaktion (3) durch indirekte Messungen der CIO-Konzentration. Bei Zugabe von N O wurde CIO
quantitativ in Cl-Atome umgewandelt, die dur-h Resonanzfluoreszenz bei 134,7 nm nachgewiesen wurden. Leu et al. [3]
sowie Birks et al. [4] benutzten Massenspektrometer in ihren
Anordnungen zur Messung von CIO-Konzenträtionen. A l l e
drei Untersuchungen blieben auf den Niederdru-kbereich beschränkt.
Die zweite Gruppe von Experimenten umfaßt iR-spektroskopische Untersuchungen zur thermischen Zersetzung von Chlornitrat [5] bzw. zum thermisch induzierten Austausch zwischen
C 1 0 N 0 und N 0 [6] im Druckbereich bis 460 bzw. 160 mbar
N . Die hier erhaltenen kinetischen Daten erlaubten die Berechnung von k mit Hilfe der Gleichgewichtskonst^nten für das
Gleichgewicht
2
1 5
2
2
2
3
C10N0
2
^ CIO + N 0
2
(4)
2
C 1 0 + Av(A = 248.5 nm) -> C l + CIO
(1)
Cl + C1 0
(2)
2
sowie des Arrheniusparameters.
Zur dritten Gruppe von Experimenten gehört eine kinetische
Untersuchung zur Druck- und Temperaturabhängigkeit von
Reaktion (3) mit Hilfe der modulierten Photolvse von C l /
Cl 0-Gemischen [7] und die vorliegende blitzphotolytische U n tersuchung. In beiden Experimenten wird die Reaktion (3)
durch optische Messungen am intermediären CIO verfolgt. Der
Druckbereich bis >800 mbar wird überstrichen.
2
-> C l + CIO
2
CIO + N 0
2
2
+ N
2
-
CIO • N 0 + N .
2
(3)
2
Aussagen zur Geschwindigkeit der Chlornitratbildung (3) werden aus der Abnahme von [CIO] als Funktion von [ N 0 ] und
[N ] erhalten.
2
2
Ber. Bunsenges. Phys. Chem. 85, 611 -615 (1981) -
2
Während in allen Experimenten der Gruppen 1 und 3 das
Verschwinden der Radikale CIO messend verfolgt wurde, wobei
© Verlag Chemie GmbH, D-6940 Weinheim, 1981.
0005-9021/81/0707-0611 $ 02.50/0

© Copyright 2026