
gale crater, mars
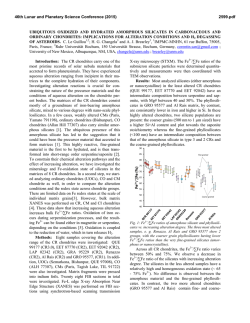
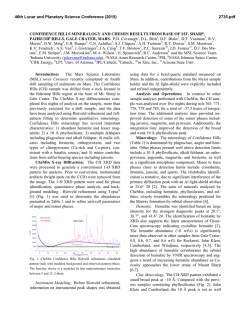
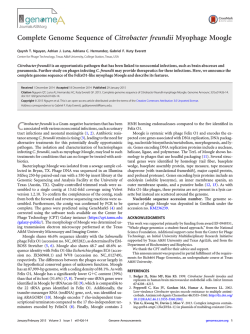
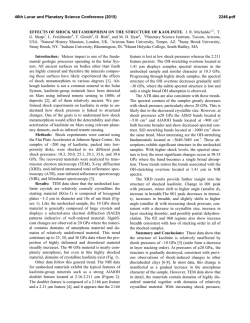
46th Lunar and Planetary Science Conference (2015)
1946.pdf
THE X-RAY AMORPHOUS COMPONENTS OF THE ROCKNEST SOIL AND SHEEPBED MUDSTONE
(GALE CRATER, MARS): MINIMUM ABUNDANCE, COMPOSITIONAL RANGES AND POSSIBLE
CONSTITUENTS. E. Dehouck1, S. M. McLennan1, P.-Y. Meslin2, A. Cousin2,3, and the MSL science team.
1
Department of Geosciences, Stony Brook University, NY, USA ([email protected]); 2IRAP,
UPS/CNRS/OMP, Toulouse, France; 3LANL, Los Alamos, NM, USA.
Introduction: The Mars Science Laboratory rover
Curiosity is the first martian spacecraft equipped for
X-ray diffraction (XRD) analysis, which is the most
common method used on Earth to identify minerals in
bulk geological samples. The diffractometer is part of
the CheMin instrument [1], which receives <150-µm
powder samples from the sample collection and processing subsystem on the rover arm. During the first
(terrestrial) year of the mission, CheMin analyzed
samples from three locations: the Rocknest sand shadow (scooped) [2,3], and the John Klein (JK) and Cumberland (CB) outcrops (drilled) [4]. Both JK and CB
are part of the Sheepbed mudstone, which is itself the
lowest exposed member of the fluvio-lacustrine Yellowknife Bay formation [5].
In terms of mineralogy, the Sheepbed mudstone differs from the Rocknest sand mainly by the presence of
abundant smectite clays, as well as lower abundance of
olivine and greater abundance of magnetite, suggesting
that the Sheepbed mudstone has been modified by aqueous alteration during diagenesis [4-6]. Otherwise, the
samples share a number of compositional characteristics: both contain a significant X-ray amorphous component in addition to several primary basaltic minerals
[2-4]. Here, we present the results of mass balance
calculations that provide constraints on the abundance
and explore the domain of possible chemical compositions of the amorphous components detected in the
Rocknest sand and the Sheepbed mudstone [7].
Methods: Following an approach similar to [8], we
based our calculations on bulk chemical compositions
measured by the APXS instrument, and on phase
abundances and structural formulas derived from the
CheMin XRD patterns by [2-4]. Using the Scilab software, we developed a program that calculates all the
possible chemical compositions of the crystalline component – and thus of the complementary amorphous
component – of each sample, taking into account the
uncertainties on the phase abundances derived from
CheMin data [2,4]. For the Sheepbed mudstone, we
chose to work only with the data from the CB drill in
order to minimize the potential effect of cross-sample
(i.e., Rocknest-JK) contamination [4].
We have explored a range of values between 10
and 50 wt% of amorphous component but, for more
detailed analyses, we have focused on the two follow-
ing values: 30 wt% ̶ close to the XRD-based estimates
[2,4] ̶ and 45 wt% ̶ close to the amount estimated by
[8] for Rocknest. In some cases, the calculated amorphous component may have one or more oxides with
concentrations below 0 wt%: the combination is then
“chemically unrealistic” and thus rejected by the program. Therefore, this constraint can be used to determine a lower limit to the overall abundance of the
amorphous component, i.e., the minimum amount required to have all oxides ≥0 wt% (Fig. 1).
Results: Rocknest soil. The minimum abundance
of amorphous component for Rocknest is 22 wt% (Fig.
1). In addition, proportions below 25 wt% are considered as unlikely, because less than 5% of the calculated
combinations are retained. These abundances are significantly higher than the lower limit (~14 wt%) and in
good agreement with the best estimate (~27 wt%) derived from the XRD pattern [2].
Sheepbed mudstone. In the case of the Sheepbed
mudstone, the composition of the smectite clay adds
additional uncertainty to the estimate of the composition of the crystalline and amorphous components [4].
Based on detailed XRD comparisons, [9] showed that
the best known terrestrial analog for the smectite clay
of the Sheepbed mudstone is a ferrian saponite from
Griffith Park (Los Angeles, CA). Because this analog
has somewhat varying compositions from one sample
to another, we used two different compositions published by [9], referred here as Griffith saponite 1 and 2.
The minimum abundance of amorphous component
of Sheepbed is 15 wt% with smectite as Griffith saponite 1 and 18 wt% with smectite as Griffith saponite 2
(Fig. 1). Proportions below 21 and 24 wt%, respectively, are considered as unlikely (i.e., less than 5% of the
combinations are retained). These values are somewhat
higher than the lower limit (~12 wt%) and in good
agreement with the best estimate (~31 wt%) derived
from the XRD pattern [4].
Comparison between Rocknest and Sheepbed. The
X-ray amorphous components of Rocknest and Sheepbed have striking compositional similarities: their calculated SiO2, TiO2, Al2O3, Cr2O3, FeO, CaO, Na2O,
K2O and P2O5 concentrations are within comparable
ranges [7]. The only oxide for which there is strictly no
overlap, whatever the amounts of amorphous component in the two samples, is SO3: it is always higher in
46th Lunar and Planetary Science Conference (2015)
Rocknest than in Sheepbed. Several hypotheses can be
considered to explain this difference: (1) the two
amorphous components were formed with different
concentrations of S; (2) the two were formed with
comparable concentrations but (2a) S was later added
to the amorphous component of Rocknest, or (2b) S
was later removed from the amorphous component of
Sheepbed. Sulfur mobility on Mars can be demonstrated by the observation of numerous Ca-sulfate-filled
veins at Gale [6] and elsewhere on Mars [10]. Thus,
one possibility is that some S originally present in the
amorphous component of Sheepbed has been remobilized by the late diagenetic event that formed the Casulfate veins, and incorporated in the latter (hypothesis
2a). Alternatively, S may have been added to the
amorphous component of Rocknest in the form of
amorphous sulfates (or sulfites) transported from a
nearby source [e.g., 11] or in the form of adsorbed
SO42- [12] (hypothesis 2b).
The MgO concentration tends to be higher for the
amorphous component of Sheepbed, although there is
still some overlap in the case of Griffith saponite 1 (or
any other clay mineral with equivalent or higher MgO
content). In any case, this suggests no Mg loss – or
even an enrichment – compared to Rocknest, which is
consistent with the hypothesis that olivine was the
main source of Mg to form the saponitic clay [4].
Conclusion and future work: Our mass balance
calculation program provides the minimum abundances required for the amorphous component to have realistic chemical compositions (i.e., all oxides ≥0 wt%).
These minimum abundances are ~22 wt% for Rocknest
and ~15 to 18 wt% for Sheepbed (CB drill), in good
agreement with estimates derived from the XRD patterns [2,4]. In addition, our results show that, apart
from S, the amorphous component of Rocknest and
Cumberland are chemically very similar based on our
current knowledge of these samples, pointing toward a
common origin and/or a common formation process.
Although more investigations will be necessary to
formally identify them, the individual phases possibly
present within the amorphous components include:
volcanic (or impact) glass, hisingerite, amorphous silica, ferrihydrite (or other nanophase ferric oxides) and
amorphous sulfates (or adsorbed SO42-) [7].
In future work, we plan to test the relative stability
of the above-mentioned “candidate” amorphous phases
using a modified version of the experimental device
described by [13]. We will investigate the influence of
temperature, relative humidity and atmospheric composition on the recrystallization process in order to evaluate the likelihood of preserving amorphous components
on long timescales at Gale, either at the surface or after
possible burial under the sediments of Aeolis Mons.
1946.pdf
References: [1] Blake D. et al. (2012) Space Sci.
Rev., 170, 341-399. [2] Bish D. L. et al. (2013) Science,
341, DOI: 10.1126/science.1238932. [3] Blake D. et al.
(2013) Science, 341, DOI: 10.1126/science.1239505. [4]
Vaniman D. et al. (2014) Science, 343, DOI: 10.1126/
science.1243480. [5] Grotzinger J. P. et al. (2014),
Science, 343, DOI: 10.1126/science. 1242777. [6]
McLennan S. M. et al. (2014) Science, DOI: 10.1126/
science.1244734. [7] Dehouck E. et al. (2014) JGRPlanets, 119, DOI:10.1002/2014JE004716 [8] Morris R.
V. et al. (2013) LPSC XLIV, abstract #1653. [9] Treiman
A. H. et al. (in press) Am. Min. [10] Squyres S. W. et al.
(2012) Science, 336, DOI: 10.1126/science. 1220476
[11] Wang A. and Ling Z. C. (2011) JGR-Planets, 116,
DOI: 10.1029/2010JE003665 [12] McAdam et al.
(2014) JGR-Planets, 119, DOI : 10.1002/ 2013JE004518.
[13] Zhao Y.-Y. S. (2013) LPSC XLIV, abstract #3002.
Figure 1 – Percentage of realistic combinations (i.e.,
compositions with all oxides ≥0 wt%) as a function of
the proportion of amorphous component in the bulk
sample for Rocknest (A) and Sheepbed/Cumberland
(B). Total number of combinations is 59,049 for Rocknest and 1,417,176 for Cumberland [7].
© Copyright 2026