
Semiquantitative Analysis of Integrated Genomes of Human
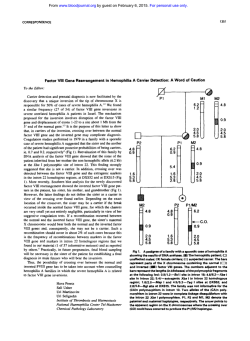
From www.bloodjournal.org by guest on February 6, 2015. For personal use only.
Semiquantitative Analysis of Integrated Genomes of Human T-Lymphotropic
Virus Type I in Asymptomatic Virus Carriers
By Osamu Shinzato, Shuichi Ikeda, Saburo Momita, Yasuhiko Nagata, Shimeru Kamihira,
Eiichi Nakayama, and Hiroshi Shiku
A semiquantitative estimation of human T-lymphotropic
virus type I (HTLV-I) integrationby peripheralblood mononuclear cells (PBMC) was performed. Genomic DNA samples
derived from 134 HTLV-I carriers were subjected to 40 or 60
cycles of the polymerase chain reaction to amplify the pol
region of HTLV-I. The HTLV-I genome was detected by dot
hybridization using a UP-labeled oligonucleotide probe for
the pol region. The radioactivity of hybridized dot membranes was then counted with an RI Imaging System (Ambis
Inc, San Diego, CA) and the HTLV-I genome dose was
determined by comparison with standard curve for serially
diluted HTLV-I genome-positiveDNA. A wide range of variation of HTLV-I genome integration was observed. When the
integrated genome dose was calculated as the number of
HTLV-I copies per 100 PBMC, 7 carriers (5%) had more than
10 copies, 56 (42%) had 1 to 10 copies, 46 (34%) had 0.1 to 1
copy, and 24 (18%) had less than 0.1 copy. In one sample, the
HTLV-I genome was undetectable, which may indicate that
the integrated genome was present at less than 0.01 copies
per 100 PBMC. Age- or sex-related variations in the distribution of individuals with different HTLV-I genome were rather
limited. However, carriers with a high level of the HTLV-I
genome were always more than 30 years old and were
predominantlymale (six of seven).
o 1991by The American Society of Hematology.
H
individual. Recently, the polymerase chain reaction (PCR)
has been applied for detecting HTLV-I genomes?-” Although this technology enables us to detect the viral
integration with extremely high sensitivity, quantitative
measurement of the viral genome dose has remained
difficult.
In this study, we semiquantitatively examined HTLV-I
genome dose in the PBMC of asymptomatic HTLV-I
carriers by means of the PCR and the RI Imaging System
(Ambis Inc, San Diego, CA). A more than 103-foldvariation
in the viral genome dose was found among the HTLV-I
carriers. The association of the viral genome dose with age
was also examined.
UMAN T-LYMPHOTROPIC virus type I (HTLV-I)
was the first retrovirus to be found in humans’ and is
intimately related to several disorders, including adult
T-cell leukemia (ATL)’ and HTLV-I-associated myelopathyhropical spastic paraparesis (HAM/TSP).3a4
Seroepidemiologic analyses have shown the presence of
at least three different routes of virus transmission: motherto-child transmission via breast feeding,’ transmission via
blood transfusion: and husband-to-wife transmission via
sexual interco~rse.~
HTLV-I primarily infects CD4+ T
cells,’ and for its transmission infected cells need to come
into direct contact with uninfected cells. However, it is
totally unknown how the virus spreads in infected individuals and how viral infection eventually results in the onset of
diseases.
It is important to determine the fate of transmitted
virions and the dose changes of the viral genome in infected
individuals to analyze the pathogenesis of HTLV-I-related
disorders and to determine effective methods for the
prevention of infection.
Infection with HTLV-I has usually been detected by
serologic assays, such as immunofluorescence of serum
and/or peripheral blood mononuclear cells (PBMC), or by
Southern blot analysis of genomic DNA obtained from
PBMC. However, these methods are unable to quantitatively measure the level of the viral genome in an infected
From the Department of Oncology, Hematology, and Blood Transfusion Service, Nagasaki University School of Medicine, Nagasaki,
Japan.
Submitted July 2,1990; accepted June 11, 1991.
Supported by Special Coordination Funds from the Science and
Technology Agency of the Japanese Govemment and by a grant from
the Ministry of Health and Welfare of Japan.
Address reprint requests to Hiroshi Shiku, MD, Department of
Oncology, Nagasaki University School of Medicine, 12-4 Sakamotomachi, Nagasaki 852 Japan.
The publication costs of this article were defrayed in part by page
charge payment. This article must therefore be hereby marked
“advertisement” in accordance with 18 U.S.C. section I734 solely to
indicate this fact.
0 1991 by The American Society of Hematology.
0006-4971191 ~7808-0005$3.00/0
2082
MATERIALS AND METHODS
Blood donors. One hundred thirty-four asymptomatic HTLV-I
carriers in Nagasaki, one of the endemic areas for HTLV-I
infection in Japan, were examined (Table 1).HTLV-I carrier status
was determined by the presence of anti-HTLV-I antibodies
detected by the gelatin particle agglutination test (Serodia-ATLA,
Fujirebio, Tokyo, Japan), enzyme-linked immunosorbent assay
(Eitest-ATL; Eisai Co,Tokyo, Japan), or indirect immunofluorescence with HTLV-I’ cells as the targets. Twenty-two patients with
HAM/TSP and 23 healthy seronegatives (noncarriers) were also
analyzed. Three HTLV-I+ cell lines (MT-2,” HUT-102,’ and
ATKS) and fresh ATL cells were used as positive controls, whereas
three HTLV-I- cell lines (HUT-78,” HL-60,14 and HLCL-1) were
used as the negative controls.
PCR. High molecular weight cellular DNA was extracted as
described previously” from PBMC prepared by the Ficoll-Hypaque
gradient method (Nyegaard, Oslo, Norway).
DNA amplification in vitro was performed by the protocol of
Saiki et
with some modificati~n.’~.’~
Sequences of oligonucleotide primers and detecting probes are shown in Table 2. The
reaction mixture contained 0.5 kg of chromosomal DNA, 0.3 kg of
each primer, 800 kmol/L of dNTPs (mixture of dATP, dCTP,
dGTP, and d’ITP) , 16.6 mmol1L (NH,),SO,, 67 mmol/L Tris-HC1
(pH 8.8), 6.7 mmol/L MgCI,, 10 mmol/L 2-mercaptoethanol, 100
pg/mL of gelatin, and 1U of Taq DNA polymerase (Perkin Elmer
Cetus, Nonvalk, CT) in a total volume of 50 kL. Samples
underwent 40 cycles of heating to 95°C for 60 seconds to denature
the DNA, cooling to 55°C for 90 seconds for annealing of primers,
and incubation at 72°C for 90 seconds for primer extension by an
automated heat block (Program Temp Control System PC 500
Astec Inc, Fukuoka, Japan). Samples in which HTLV-I genomes
Blood, Vol78, No 8 (October 15), 1991: pp 2082-2088
From www.bloodjournal.org by guest on February 6, 2015. For personal use only.
2083
HTLV-I GENOME DOSES IN VIRUS CARRIERS
Table 1. Age and Sex Distributionof HTLV-I Carriers Examined
Male
Age (vr)
Female
Age (vr)
Range
Median
No. of
Individuals
Range
Median
No. of
Individuals
10-19
20-29
30-39
40-49
50-59
60-69
70-79
10-18
20-29
31-39
42-48
50-58
60-67
70-77
17
26
36
44.5
53
64
72
9
10
10
10
10
9
6
16-19
20-27
30-38
40-49
50-59
60-67
72-79
17
26
36
44
53
63
74
11
10
10
10
10
11
8
Total
10-77
43.5
64
16-79
43
70
Age Groups
(vr)
were undetectable after 40 cycles of amplification were reanalyzed
after another 20 cycles of the PCR were performed with the
addition of 0.5 U of Taq DNA polymerase. Test samples were run
in parallel with standard positive (mentioned later) and negative
samples in each experiment.
Dot hybridization. Aliquots (10 pL) of the reaction products
were spotted onto nylon filters. The filters were dried and prehybridized for 3 to 6 hours at 56°C in 3 mol/L tetramethylammonium
chloride, 50 mmol/L Tris-HC1 (pH 8.0), 2 mmol/L EDTA, 100
pg/mL of denatured salmon sperm DNA, 0.1% sodium dodecyl
sulfate (SDS), and 5X Denhardt's solution. Then filters were
hybridized for 1 hour at 46°C in the same mixture containing a
3zP-endlabeled oligoprobe. Filters were washed twice in 2X SSC
(1X SSC: 150 mmol/L sodium chloride, 15 mmol/L sodium citrate)
with 0.1% SDS for 5 minutes at room temperature, then stringently
washed twice in 5X SSC with 0.1% SDS for 15 minutes at 50°C.
Subsequently, filters were washed twice in the hybridization buffer
without Denhardt's solution and salmon sperm DNA at 57.5"C for
1 hour. The filters were then exposed to Kodak XAR-5 film
(Eastman Kodak, Rochester, NY) at -70°C for 15 to 24 hours
using an intensifying screen.
Analysis by the RI Imaging System. After dot hybridization, the
radioactivity of each dot was counted for 5 to 8 hours using the RI
Imaging System. The RI Imaging System images and quantitates
with a degree of sensitivityequal to the combined use of autoradiography and scintillation counting. The detector is an enhanced
multiwire proportional counter. An array of radiation detectors is
created by 34 anode wires and 28 cathode strips that intersect at
right angles to form 952 detectors. It detects radioactivity directly
from samples without destruction of the sample membrane. The
filter membrane analyzed by the RI Imaging System was also
processed for standard autoradiography, as described previously.
Standard samples. For quantitative analysis of the HTLV-I
genome levels in PBMC, standard samples were prepared by
diluting DNA from an ATL-derived cell line (ATKS), which has
normal diploid 46XY chromosomes and one copy of the HTLV-I
genome per cell. Tenfold serial dilutions (from 100% to 0.001%) of
HTLV-I-positive cellular DNA, with a constant total DNA content, were prepared by dilution with DNA from HTLV-I- PBMC.
Amplification of c-Ki-ras. As an internal control for the PCR,
c-hi'-ras amplification was also examined in all samples, using the
following primers and oligonucleotide probe: primer A ( 5 ' GACTGAATATAAACTTGTGG-3'),primer B (5'-CTATTGTTGGATCATATTCG-3'), and a '*P-labeled oligoprobe (5'GTTGGAGCTGGTGGCGTAGG-3'). Twenty-five cycles of the
PCR were performed. After dot hybridization, each sample was
analyzed by the RI Imaging System.
Southern blot analysis. DNA samples were digested completely
with Pst I restriction enzyme, separated on agarose gel, and
transferred to a nitrocellulose filter. Hybridization was performed
at 42°C with 1 X lo7cpm/mL of 32P-labeledprobe (P255M-07 for
pol of HTLV-I) in 50% formamide, SX SSC, 0.02 mol/L sodium
phosphate (pH 6.5), 1X Denhardt's solution, and 0.5 mg/mL of
denatured salmon sperm DNA. Each filter was washed with 2X
SSC-0.1% SDS and 0.1X SSC-0.1% SDS at 60°C and exposed to
x-ray film.
RESULTS
Detection of the HTLV-I genome by the PCR. When
genomic DNA obtained from 134 HTLV-I carriers was
amplified by 40 PCR cycles with primers forpol region and
then analyzed by dot hybridization, 119 samples showed a
positive reaction and 15 samples were negative. After
Table 2. Position and Sequence of Primers and Detecting Probes
Region
Oligonucleotide
Primer A
B
Probe
Primer A
B
Probe
Primer A
B
Probe
Primer A
B
Probe
'Sequence
data from Seiki et a1?4
Position
Seauence 15' + 3'P
3365-3384
3483-3464
3419-3438
1261-1280
1440-142 1
1380-1361
6116-6139
6236-6217
6196-6173
6834-6853
6929-6910
6877-6896
TACAAAGGCATACTGATCCC
CAGGGTTTGGACTAGTCTAC
AATCATTAGTGCAGCTGCGG
AAGCAAGAAGTCTCCCAAGC
TTCGGCCTCTGATATAAGGC
GCAAAGGTACTGCAGGAGGT
GCGGTACCGGTGGCGGTCTGGCTT
CTITGTCCACCTCATGTAGG
GGACATGGAGCCGGTAATCCCGCC
ATGCTGTITCGCCTTCTCAG
GAGAAGAAGGCCGCTGACGT
CGGCGCTCCTGCTCITCCTG
From www.bloodjournal.org by guest on February 6, 2015. For personal use only.
SHINZATO ET AL
2084
amplification by a total of 60 cycles of the PCR, 14 of these
15 samples became positive and only one sample remained
negative. All 14 samples that became positive only after 60
PCR cycles were then analyzed by Southern blot hybridization and disclosed specific 119-bpbands. When 23 samples
obtained from noncarriers were similarly examined, no
sample was positive after 40 or 60 PCR cycles. In all
analyses, genomic DNA samples of HTLV-I' and HTLV-Icell lines were also included and provided the expected
results.
Semiquantitative analysis of the HTLV-I genome dose.
Radioactivity of hybridized dot membranes was counted by
the RI Imaging System. In each experiment, standard
sampleswere also included to determine standard curves (a
representative curve is shown in Fig 1).
Figure 2 shows a representative result after 40 PCR
cycles were used to treat 14 samples from HTLV-I carriers
plus standard samples containing various amounts of
HTLV-Igenome-positive cellular DNA (0.001% to 100%,
lo-*
10-l
lo0
lo'
/I
I
I
I
I
I
I
I
I
I
I
lo-'
100
lo'
C1 C2
Blank S1
1 2
8 9
C
275
C3
S2
3
10
C4
S3
4
11
C5 C6
S4 S5
5 6
12 13
................................................
I"
C7
S6
7
14
D
00000..
00
00
00000.0
E
lo2
% of genomic DNA of HTLV-I positive cells
/i
B
A
lo2
% of genomic DNA of HTLV-I positive cells
Flg 1. Ouantkattve analysis of HTLV-I genome doso In standard
samples by PCR and dot hybridization. Standard samples were
prepared by serially diluting genomic DNA obtainedfrom an HTLV-Ipositive cell line (ATKS), with DNA obtained from HTLV-l-negative
PBMC. Samples containing 0.01% to 100% of HTLV-Lpositive genomic DNA were amplified by 40 PCR cycles with primers for the p o l
region of HTLV-I. Autoradiography of dot hybridization was then
performed (A). The counts per minute (cpm) value of each dot was
measured using the RI Imaging System and a standard curve was
drawn (B).
Fig 2. An example of the analysis of HTLV-I genome dose in PBMC
from carriers. (A) C1 and C2, HTLV-I seronegative individuals; C3,
HL-60; C4, HUT-78; C5, MT-2; C6, fresh ATL cells; C7, HUT-102; Blank,
sample buffer without genomic DNA; S1 through S6, standard
samples containing HTLV-Lpositive genomic DNA in a range from
0.001% to 100%; 1 through 14, HTLV-I seroposkive individuals.
Samples underwent 40 PCR cycles with primers for the pol region of
HTLV-I (B through D) or 25 PCR cycles with primers for the c-Ki-res
gene (E). A standard curve was drawn based on the cpm data for
samples S1 through S6 as determined by the RI Imaging System (B).
Autoradiography of dot hybridization using the pol region probe (C)
or the c-Ki-res probe (E) was then performed. In (D),test samples have
been classified into five groups accordingto the viral genome dose, as
described in Results. (01,High; (01,moderately high; (0).moderately
low; (0).low; (0).undetectable. Samplesfromcarriers 6 and 11were
negative after 40 PCR cycles but became positive after 60 cycles, and
were classified as low.
ie, 0.001 to 100 copies of the HTLV-I genome per 100 cells).
Positive dot hybridization was consistently obtained in
samples with more than 0.1% HTLV-I genome positivity
(equivalent to 0.1 copies of the genome per 100 cells).
HTLV-I genome dose was determined using standard
curves obtained from the serially diluted positive control
samples, and the carriers' samples were classified into five
groups depending on the genome dose. These groups were
as follows: high, equivalent to more than 10 copies of the
HTLV-I genome per 100 PBMC; moderately high, equivalent to 1to 10 copies; and moderately low, equivalent to 0.1
to 1 copy. Samples that were estimated to contain less than
0.1 copy of the HTLV-I genome per 100 PBMC were
classified as low. After 60 PCR cycles, standard samples
containing 0.01 copy of the HTLV-I genome per 100 PBMC
became consistently positive in dot hybridization, and those
containing 0.001 copy were occasionally positive. Therefore, samples that were negative after 40 PCR cycles but
From www.bloodjournal.org by guest on February 6, 2015. For personal use only.
HTLV-I GENOME DOSES IN VIRUS CARRIERS
were positive after 60 cycles were also classified as low. A
sample in which the HTLV-I genome was undetectable
after 60 PCR cycles was classified as undetectable.
All samples were examined at least three times. Whenever results were inconsistent, additional analyses were
performed until repeatable results were obtained. To exclude the possibility that DNA preparations from particular
samples could be inappropriate for the PCR, eg, due to
contamination by enzyme inhibitors, each sample was also
examined for c-Ki-ras gene expression. Consistent and
uniform results were obtained for all samples, with a less
than 20% standard deviation in cpm being detected (examples are shown in Fig 2).
Analysis of the HTLV-I genome dose by the PCR for pol,
pX, gag, and env regions. To determine the specificity of
the PCR, 38 samples were analyzed in parallel forpol, pX,
gag, and env regions of HTLV-I. Primers and detecting
probes for each region are listed in Table 2. Thirty-five
samples showed essentially similar results by the PCR for
all four regions in terms of HTLV-I genome dose. One
sample determined as moderately high genome dose by the
PCR forpol became moderately low genome dose when the
three other regions were examined. The remaining two
samples determined as high genome dose by the PCR for
pol, gag, andpX became either moderately low or undetectable genome dose by the PCR for env region. An example of
comparative analysis is shown in Fig 3.
In addition, selected samples were also analyzed by the
standard Southern blot analysis. As shown in an example
(Fig 4), expected bands were consistently detected by
Southern blot analysis in samples with high genome dose
and occasionally detected in samples with moderately high
genome dose. Bands have never been detected in samples
with lower genome doses.
HTLV-I genome dose in HTLV-I carriers. In the PBMC
of 134 asymptomatic HTLV-I carriers, we observed a wide
range of variation of the integrated HTLV-I genome dose
from more than 10 copies to less than 0.1 copy per 100
PBMC. Figure 5 shows the variations of HTLV-I genome
dose with age in males and females. High genome dose was
detected only in a limited number of carriers, who were
predominantly males over 30 years old. Otherwise, no
apparent differences in the proportion of carriers with
different genome doses were observed among the various
age groups.
DISCUSSION
The determinationof host viral genome dose is extremely
important for understanding the pathogenesis of virally
related diseases, but reliable estimation of the viral dose is a
matter of considerable technical difficulty. Thus, in the case
of HTLV-I, the probable causative agent of ATL and
several other disorders including HAM/TSP, only limited
information on host genome levels has been available.
In this analysis we applied the PCR and the RI Imaging
System to the determination of HTLV-I genome dose in
viral carriers. Because HTLV-I is known to infect PBMC,
particularly CD4' T cells, we analyzed PBMC genomic
DNA. Thepol region was amplified by the PCR for detailed
A
Blanks1 S2 S3 S4 S5 S6
1 2 3 4 5 6 7
B
Fig 3. An example of the analysis of HTLV-I genome doso by the
PCR for pol. pX gag, and env regions. Standard samples IS1 through
S6) contained HTLV-l-positive genomic DNA in a range from 0.001%
to 100%, and are as follows: S1, 0.001%; S2, 0.01%; S3. 0.1%; S4.
1%; S5, 10%; S6, 100%. Seven samples of HTLV-I seropositive
individuals (1 through 7) were also analyzed. Samples underwent 40
PCR cycles with primers for the listed regions. The sequence of
primers and detecting probes is described in Table 2. Sample no. 2
became clearly positive by 60 PCR cycles in all regions examined. (A)
Samples. (B) Dot hybridization.
analysis of HTLV-I genome dose. Sufficient specificity and
sensitivitywere obtained for the PCR and dot hybridization
by using predetermined HTLV-I' and HTLV-I- cells as
controls and also by using the c-Ki-ras gene as an internal
control. The semiquantitative results obtained from each
sample based on standard curves for HTLV-I' genome
DNA were also found to be specific and sufficiently repeatable. However, in several samples semiquantitative estimation by the RI Imaging System was not consistent in
repeated experiments. Therefore, we had to repeat experiments for these samples four to five times before we
obtained conclusive results. The variations may have been
caused at various steps of preparation of samples, PCR, and
analysis by the RI Imaging System.
Among 134 samples from HTLV-I carriers with anti-
From www.bloodjournal.org by guest on February 6, 2015. For personal use only.
SHINZATO ET AL
2086
SlS2S3S4SSS6S7 1
2
3 4
5
6
2.5 kb
Fig 4. Southem blot analysis for detection of HTLV-Igenome with "P-labeled probefor thepol region. Standard samples (S1 through S7) were
prepared by serially diluting genomic DNA obtained from an HTLV-l-poskive cell line (ATKS), with DNA obtained from HTLV-l-negative PBMC.
Concentratlonsof HTLV-Igenome in standard samples are as follows: S1,100%; S2,20%; S3,10%, S4,5%; S5,2%; S6,1%; S7,0.5%. The HTLV-I
genome doses of six sampler from HTLV-I carriers (1 through 6) were predetermined by the RI Imaging System as follows: 1 and 2, high genome
dose; 3 and 4. moderately high genome dose; 5 and 6, moderately low genome dose. DNA was digested by Pst 1. The presence of HTLV-I proviral
genome was detected by =P-labeled DNA probe for the pol of HTLV-I.
HTLV-I antibodies, only one sample failed to show any
evidence of HTLV-I genome integration by amplification of
all four regions of HTLV-I. In this sample, the HTLV-I
genome was also undetectable by a standard Southern blot
analysis. Presence and specificity of anti-HTLV-I antibodies in the serum of this carrier were confirmed by an
absorption test of the enzyme-linked immunosorbent assay
as well as by a Western blotting assay. This result could
have been due to an extremely low level of the HTLV-I
genome, an unusual location of the genome, or even the
absence of genome in this particular individual.
A wide variation of the HTLV-I genome dose (more than
10)-fold)was observed among these asymptomatic HTLV-I
carriers. These HTLV-I genome doses may reflect a proportion of HTLV-I genome positive cells based on the assumption of one proviral copy per cell. Most of HTLV-I carriers
Age
Male
Female
% (1 1 )(1 O X 1 OXlO)(lO)(ll)
(9) (6)
100
(8)
I
c
U
IC
5
.2 ,
In0
a 8
'f
50
zg
c m
.-
z>
-I
g-l
&%
10s 20s 30s 40s 50s 60s 70s
Age
0
10s 20s 30s 40s 50s 60s 70s
Age
Fig 5. Distribution of the HTLV-I genome doso in
the PBMC of carrier8 in different age groups. Viral
genome dose was graded as follows: (m), high; (W),
moderately high; (0).
moderately low; (0).low; (0).
undetectable. Numbers in parentheses denote the
actual number of carriers examined.
From www.bloodjournal.org by guest on February 6, 2015. For personal use only.
2087
HTLV-I GENOME DOSES IN VIRUS CARRIERS
were classified as having a moderately low or moderately
high genome dose. Seventy-six percent (102 of 134) of the
carriers had 0.1 to 10 HTLV-I genome copies in every 100
PBMC, while another 18% of the carriers (24 of 134) had
less than 0.1 copy per 100 PBMC (low). Only seven carriers
(5%) had more than 10 HTLV-I copies per 100 PBMC
(high). Little age-related variation was observed in the
proportion of individuals with low to moderately high
HTLV-I genome dose. However, carriers with a high
HTLV-I genome dose all were found to be more than 30
years old. This finding may suggest that the HTLV-I
genome dose is largely determined shortly after viral
transmission and does not change drastically afterwards,
except in a rather limited number of individuals. Alternatively, a gradual increase of the HTLV-I genome dose after
transmission may not have been detected in our study
because of an increase of newly infected individuals among
the older age groups. Sero-epidemiologic surveys in HTLV-I
endemic areas have repeatedly shown that the rate of viral
carriers, as determined by positivity for anti-HTLV-I antibody, apparently increases in parallel with aging.I9vmThis
increase could be at least partly explained by the possibility
of antibody response to a latent virus infection acquired
early in life, as proposed by Blattner et a1.”
Yoshida et alZZrecently reported that integration of
HTLV-I was detectable in 29% of asymptomatic carriers by
the standard Southern blot analysis, whereas it was detected in 82% of patients with HAM/TSP. These results
suggest that the levels of integrated HTLV-I genomes are
higher in HAM/TSP patients than in asymptomatic carriers. Gessain et al’ reported that 3% to 15% of the PBMC
from HAM/TSP patients were infected by HTLV-I, after
investigating 10 patients by dilution experiments using
Southern blot hybridization assays. Although these analyses
were performed in different populations and by different
methods, it appears that HAM/TSP patients have a relatively high HTLV-I genome dose. In our preliminary
analyses of 22 HAM/TSP patients, seven patients were
determined as high genome dose, eight were moderately
high genome dose, and the remaining seven were moderately low genome dose (data not shown). None were
determined as low genome dose or undetectable genome
dose. Our results are compatible with the previously mentioned reports and indicate an apparently higher level of
HTLV-I genome dose in HAM/TSP patients. However, it
has to be determined whether moderately high to high
HTLV-I genome dose in asymptomatic virus carriers might
be a risk factor for the development of HAM/TSP.
The presence of the abnormally shaped nucleus lymphoid cells is more frequent in carriers with high or
moderately high HTLV-I genome dose than in those with
lower genome dose (data not shown). Cytologic similarity
between these cells and ATL cells suggests that they may be
polyclonally proliferating HTLV-I-positive cells. These
cells are also frequently found in peripheral blood samples
of HAM/TSP patients. Therefore, it has to be determined
if the appearance of these cells is directly relevant to the
development of ATL and/or HAM/TSP.
ACKNOWLEDGMENT
We thank Dr Yasuaki Yamada for providing the ATKS cell line,
and Hiroto Okuda, Minoru Fujii, and Shigehiro Nakajima for
supplying the carriers’ samples and technical assistance. We also
thank Drs Ryozo Moriuchi and Tsutomu Miyamoto for providing
us with the P255M-07 DNA probe for the pol region and some
oligonucleotides for PCR.
REFERENCES
1. Poiesz BJ, Ruscetti FW,Gazdar AF, Bunn PA, Minna JD,
Gallo R C Detection and isolation of type C retrovirus particles
from fresh and cultured lymphocytes of a patient with cutaneous
T-cell lymphoma. Proc Natl Acad Sci USA 77:7415,1980
2. Yoshida M, Miyoshi I, Hinuma Y: Isolation and characterization of retrovirus from cell lines of human adult T-cell leukemia
and its implication in the disease. Proc Natl Acad Sci USA 79:2031,
1982
3. Osame M, Usuku K, Izumo S, Ijichi N, Amitani H, Igata A,
Matsumoto M, Tara M: HTLV-I associated myelopathy: A new
clinical entity. Lancet 1:1031,1986
4. Gessain A, Barin F, Vernant JC, Gout 0, Maws L, Calender
A, de T h t G: Antibodies to human T-lymphotropic virus type-I in
patients with tropical spastic paraparesis. Lancet 2:407, 1985
5. Nakano S, Ando Y, Ichijo M, Moriyama I, Saito S, Sugamura
K, Hinuma Y: Search for possible routes of vertical and horizontal
transmission of adult T-cell leukemia virus. Gann 75:1044,1984
6. Okochi K, Sato H, Hinuma Y: A retrospective study on
transmission of adult T cell leukemia virus by blood transfusion:
Seroconversion in recipients. Vox Sang 46:245,1984
7. Tajima K, Tominaga S, Suchi T, Kawagoe T, Komoda H,
Hinuma Y, Oda T, Fujita K Epidemiological analysis of the
distribution of antibody to adult T-cell leukemia-virus-associated
antigen: Possible horizontal transmission of adult T-cell leukemia
virus. Gann 73:893, 1982
8. Gotoh Y, Sugamura K, Hinuma Y: Healthy carriers of a
human retrovirus, adult T-cell leukemia virus (ATLV): Demonstration by clonal culture of ATLV-carrying T-cells from peripheral
blood. Proc Natl Acad Sci USA 79:4780, 1982
9. Duggan DB, Ehrlich GD, Davey FP, Kwok S, Sninsky J,
Goldberg J, Baltrucki L, Poiesz BJ: HTLV-I-induced lymphoma
mimicking Hodgkin’s disease. Diagnosis by polymerase chain
reaction amplification of specific HTLV-I sequences in tumor
DNA. Blood 71:1027,1988
10. Kwok S, Ehrlich G, Poiesz B, Kalish R, Sninsky JJ: Enzymatic amplification of HTLV-I viral sequences from peripheral
blood mononuclear cells and infected tissues. Blood 7 2 1 117,1988
11. Abbott MA, Poiesz BJ, Byrne BC, Kwok S, Sninsky JJ,
Ehrlich GD: Enzymaticgene amplification: Qualitative and quantitative methods for detecting proviral DNA amplified in vitro. J
Infect Dis 158:1158,1988
12. Miyoshi I, Kubonishi I, Yoshimoto S, Akagi T, Ohtsuki Y,
Shiraishi Y, Nagata K, Himuma Y: Type C virus particles in a cord
T-cell line derived by co-cultivating normal human cord leukocytes
and human leukemic T cells. Nature 294:770, 1981
13. Gazdar AF, Carney DN, Bunn PA, Russell EK, Jaffe ES,
Schechter GP, Guccion JG: Mitogen requirements for the in vitro
propagation of cutaneous T-cell lymphomas. Blood 55:409,1980
14. Collins SJ, Gallo RC, Gallagher RE: Continuous growth and
From www.bloodjournal.org by guest on February 6, 2015. For personal use only.
2088
differentiation of human myeloid leukemic cells in suspension
culture. Nature 270:347,1977
15. Maniatis T, Fritsch EF, Sambrook J (eds): Molecular Cloning: A Laboratory Manual. Cold Spring Harbor, NY, Cold Spring
Harbor Laboratory, 1982
16. Saiki RK, Scharf S, Faloona F, Mullis KB, Horn GT, Erlich
HA, Arnheim N Enzymatic amplification of f3-globin genomic
sequences and restriction site analysis for diagnosis of sickle cell
anemia. Science 230:1350,1985
17. Nagata Y, Abe M, Kobayashi K, Saiki S, Kotake T, Yoshikawa
K, Ueda R, Nakayama E, Shiku H: Point mutations of c-ras genes
in human bladder cancer and kidney cancer. Jpn J Cancer Res
81:22,1990
18. Nagata Y, Abe M, Kobayashi K, Yoshida K, Ishibashi T,
Naoe T, Nakayama e,Shiku H: Glycine to aspartic acid mutations
at codon 13 of the c-Ki-ras gene in human gastrointestinal cancers.
Cancer Res 50480,1990
19. Hinuma Y, Komoda H, Chosa T, Kondo T, Kohakura M,
Takenaka T, Kikuchi M, Ichimaru M, Yunoki K, Sato I, Matsuo R,
Takiuchi Y, Uchino H, Hanaoka M: Antibodies to adult T-cell
leukemia-virus-associated antigen (ATLA) in sera from patients
with ATL and controls in Japan: A nation-wide sero-epidemiologic
study. Int J Cancer 29:631,1982
SHINZATO ET AL
20. Clark J, Saxinger C, Gibbs WN, Lofters W, Lagranade L,
Deceulaer K, Ensroth A, Guroff MR, Gallo RC, Blattner W A
Seroepidemiologic studies of human T-cell leukemia/lymphoma
virus type I in Jamaica. Int J Cancer 3637,1985
21. Blattner WA, Nomura A, Clark JW, Ho GYF, Nakao Y,
Gallo R, Robert-Guroff M Modes of transmission and evidence
for viral latency from studies of human T-cell lymphotrophic virus
type I in Japanese migrant populations in Hawaii. Proc Natl Acad
Sci USA 83:4895,1986
22. Yoshida M, Osame M, Kawai H, Toita M, Kuwasaki N,
Nishida Y, Hiraki Y, Takahashi K, Nomura K, Sonoda S, Eiraku N,
Ijichi S, Usuku K Increased replication of HTLV-I in HTLV-Iassociated myelopathy. Ann Neurol26:331,1989
23. Gessain A, Saal F, Gout 0, Daniel MT, Flandrin G, de Th6
G, Peries J, Sigaux F High human T-cell lymphotropic virus type I
proviral DNA load with polyclonal integration in peripheral blood
mononuclear cells of French West Indian, Guianese and African
patients with tropical spastic paraparesis. Blood 75:428,1990
24. Seiki M, Hattori S, Hirayama Y, Yoshida M: Human adult
T-cell leukemia virus: Complete nucleotide sequence of the provirus genome integrated in leukemia cell DNA. Proc Natl Acad Sci
USA 803618,1983
From www.bloodjournal.org by guest on February 6, 2015. For personal use only.
1991 78: 2082-2088
Semiquantitative analysis of integrated genomes of human
T-lymphotropic virus type I in asymptomatic virus carriers
O Shinzato, S Ikeda, S Momita, Y Nagata, S Kamihira, E Nakayama and H Shiku
Updated information and services can be found at:
http://www.bloodjournal.org/content/78/8/2082.full.html
Articles on similar topics can be found in the following Blood collections
Information about reproducing this article in parts or in its entirety may be found online at:
http://www.bloodjournal.org/site/misc/rights.xhtml#repub_requests
Information about ordering reprints may be found online at:
http://www.bloodjournal.org/site/misc/rights.xhtml#reprints
Information about subscriptions and ASH membership may be found online at:
http://www.bloodjournal.org/site/subscriptions/index.xhtml
Blood (print ISSN 0006-4971, online ISSN 1528-0020), is published weekly by the American
Society of Hematology, 2021 L St, NW, Suite 900, Washington DC 20036.
Copyright 2011 by The American Society of Hematology; all rights reserved.


© Copyright 2026