
Presentation 2014 (PDF)
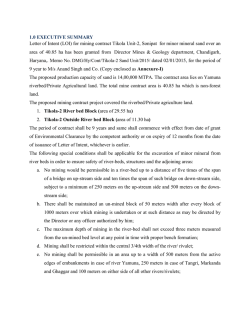
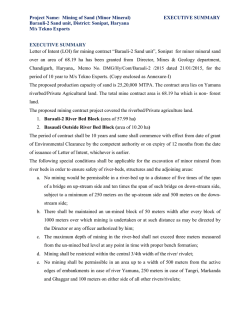
INVESTOR
PRESENTATION
Updated 29 January 2015
BUSINESS IDEA
Sandvik shall develop, manufacture and market highly
processed products, that contribute to improving the
productivity, profitability and safety of our customers.
Operations are primarily concentrated in areas where
Sandvik is – or has the potential to become – a world leader.
INDEX
Cost development
Business Idea Improved
productivity
Productivity
gap
Price
development
TIME
OUR VISION:
WE SET THE
INDUSTRY STANDARD
It is our guiding principle. We set the industry
standard, means that we strive for nothing
less than being number one.
STRATEGIC DIRECTION
• How we will achieve our direction
GROWTH
FLEXIBLE
ORIENTED
AND AGILE
TRULY
TECHNOLOGY
EXCEPTIONAL
GLOBAL
LEADER
PEOPLE
OUR WAY FORWARD
KEY PRIORITIES BY BUSINESS AREA
SANDVIK
MINING
• Consolidate footprint:
Manufacturing
• Cost efficiency: Sourcing
and A&S
• Grow share of aftermarket
• New offering including midmarket
• Sales excellence
SANDVIK
MACHINING
SOLUTIONS
• Leverage from Multi-brand
model, with backend
synergies
• Increase pace of core
product launch and digital
offer
• Invest in growth pockets and
mid-market
• Conduct bolt-on M&A:s
• Continue site-restructuring
and productivity
improvements
• Further develop Supply
Chain to optimize NWC
5
YIELD
HIGHER
RETURNS
SANDVIK
MATERIALS
TECHNOLOGY
• Accelerate growth of
strategic products, mainly
in energy and energy
efficiency
• Safeguard position in core
and standard products
through lean business
model
• Secure utilization and cost
position in the Primarysystem
SANDVIK
CONSTRUCTION
• Sales efficiency and
commercial excellence
• Accelerate growth of
businesses
• Supply chain and footprint
optimization
• New products
• After Market development
• Focused growth areas
• Mid-market strategy
• Structured transformation
program
• Improve capital efficiency
• Exit non-core businesses
REDUCE
EARNINGS
VOLATILITY
SANDVIK
VENTURE
DEVELOP MORE
TOWARDS FAST
GROWING MARKETS
• Continued globalization
• Complimentary acquisitions
SANDVIK
STRENGTH FACTORS
• Proven track record in premium segments
• Technology leadership in product markets
• High entry barriers, by vertically integrated
business model
•
•
•
•
6
Value selling part of corporate culture
Unique product offering
Pricing power
Strong customer relations and strong market
position
OPPORTUNITIES
FOR OUR CONTINUED GROWTH
•
•
•
•
•
•
7
Emerging markets a stronger global force
Increased wealth/demographic shift
Increased energy consumption
Industrial innovation
Shorter product life cycles at customers
Expansion possibilities beyond our
premium segments
FINANCIAL HIGHLIGHTS FULL YEAR 2014
MSEK
Invoicing
EBIT
ROCE
Employees
88,821 MSEK
10,120 MSEK, 11.4%
13.4%
47,318
100 000
50%
90 000
45%
80 000
40%
70 000
35%
60 000
30%
50 000
25%
40 000
20%
30 000
15%
20 000
10%
10 000
5%
0%
0
2000 2001 2002 2003 2004 2005 2006 2007 2008 2009 2010 2011 2012 2013 2014
-5%
-10 000
Adjusted
8
EBIT margin
Adjusted EBIT margin*
ROCE
FINANCIAL TARGETS FOURTH QUARTER 2014
CURRENT
GROWTH
ROCE
TARGET
7%*
13.4%
MANAGEMENT FOCUS
8%
• Product launches through focused R&D
• Increase exposure towards high growth markets and segments
• Adjust geographic footprint
25%
• Reduce Net Working Capital
• Strict capital allocation (investments)
• Restore earnings in Sandvik Mining and Sandvik Construction
• Strong cash flow generation
NET DEBT/
EQUITY RATIO
DIVIDEND
0.75
<0.8
73% for 2014**
50% of EPS
* Actual reported including structure and currency
** Proposed dividend
9
• Uninterrupted dividend since 1870
INVOICING BY MARKETS AND SEGMENTS
SALES 2013 SHARE OF GROUP TOTAL
CUSTOMER SEGMENTS
EUROPE
ASIA
38%
19%
NORTH AMERICA
AUSTRALIA
19%
8%
Consumer related 3%
Aerospace 5%
Other 2%
Energy 14%
Mining 32%
Automotive 11%
AFRICA
9%
SOUTH AMERICA
7%
Construction 11%
Engineering 22%
Change (p/v) compared with 2013
10
Pie chart representing share of invoicing 2014
BUSINESS AREAS
SANDVIK
GROUP
SANDVIK
MINING
Equipment, tools, service and technical
solutions for exploration, excavation and
processing of rock and minerals in the
mining industry.
30%
SANDVIK
MATERIALS
TECHNOLOGY
SANDVIK
MACHINING
SOLUTIONS
Holds a clear global leadership by
offering productivity enhancing
products and solutions for advanced
industrial metal cutting.
21%
Share of Sandvik Group’s total invoicing 2014
34%
54%
Industry-leading provider of high valueadded products in advanced metallic
materials for selected niches in the most
demanding industries.
17%
17%
Share of Sandvik Group’s operating profit 2014 adjusted for nonrecurring charges
SANDVIK
CONSTRUCTION
The world’s widest range of rock drilling,
rock excavation, rock processing,
demolition and bulk-materials handling
equipment, tools, services and technical
solutions for the construction industry.
10%
0%
SANDVIK
VENTURE
Unique customer offering within
selected areas.
9%
8%
SANDVIK MINING
SHARE OF GROUP’S
TOTAL INVOICING 2014
30%
OFFERING AREAS
BUSINESS CONCEPT
•
•
•
•
•
”The Safest mining supplier”
Premium brand
Direct sales
Value-adding products and services
Capital and cost efficient business system
Mechanical
Cutting
Rock Tools
Underground Load
and Hauling
Crushing
and screening
Drilling
Exploration
Customer Services
Mining Systems
KEY SUCCESS FACTORS
•
•
•
•
New technologies – the future of mining
World-class service and distribution network
Best cost country sourcing
Growth in Asia
Auto Mine
Competitors
•
•
•
12
•
Atlas Copco
Metso
Minerals
Caterpillar
Joy Global
Customer groups
•
•
•
Boart
Longyear
Sany
Tiandi
•
•
•
•
Metal mines
Coal and mineral mines
Drill and blast
contractors
Engineering houses
MINING DEMAND DRIVERS
MINERAL EXPOSURE
SALES DISTRIBUTION
2014
INVOICING
2014
Mining capex, metal and mineral prices and extraction levels.
Diamond and Other
2%
MINING INDUSTRY TRENDS
•
•
•
•
•
•
•
Environment, Health and Safety
Remote locations and declining ore grades
Energy consumption and water scarcity
Shortage of people
Semi to full automation
Importance of service
Larger operations, massive mining
Australia
17%
Europe
10% North
America
13%
Asia
21%
Mining
Systems
26%
Coals &
Minerals
23%
Base
Metals
28%
Aftermarket
53%
South
America
17%
Iron ore
17%
Platinum
6%
Equipment
21%
Africa/
Middle East
22%
Gold &
Silver
24%
Share of sales 2014. Aftermarket
includes Spare parts, Rock tools and
Services.
Share of sales 2014.
MARKET CHARACTERISTICS
•
•
•
•
Target market size: ~185 BSEK
Growth rates: 6-8% driven by mining capex
Large aftermarket
Niched competitive landscape
MSEK
Invoicing
10 000
EBIT margin
ROCE 12 months
8 000
40%
6 000
30%
4 000
20%
2 000
10%
0
0%
2007
-2 000
13
50%
2008
2009
2010
2011
2012
2013
2014
-10%
SANDVIK MACHINING
SOLUTIONS
SHARE OF GROUP’S
TOTAL INVOICING 2014
34%
PRODUCT AREAS
Sandvik Coromant
Seco Tools
Walter
DormerPramet
BUSINESS CONCEPT
• Productivity services
• World-class logistics to support JIT (Just In
Time) supply
• Use of a multibrand strategy
• Premium brands – Sandvik Coromant,
Seco Tools, Walter
• Mid market brands – Dormer, Carboloy,
Pramet, Safety, Impero
KEY SUCCESS FACTORS
• Expand in emerging markets
• New products / time to market
14
Premium brands
The world's leading
supplier of metal
cutting tools,
tooling solutions,
service and knowhow for the
metalworking
industry.
Leading
manufacturer of
high performance
metal cutting tools,
providing complete
solutions for the
metal cutting
industry.
Mid-market brands
Innovative tool
solutions for
turning, drilling,
milling and
threading
operations, as well
as multilevel service
programs.
Competitors
•
•
Kennametal
IMC Group
•
•
OSG
Sumitomo
•
•
Mitsubishi
Kyocera
Indexable tools,
round tools and
other products for
metal cutting.
MACHINING SOLUTIONS
DEMAND DRIVERS
• Developments in machine tools and material technology
drives increased importance of niche applications and
special products
• Increasing importance of mid-market segment, especially in
emerging markets
• Indirect channels growing in importance
• Importance of e-marketing developing fast
Australia 1%
Mining 2%
• Primary metals consumption leading to global industrial
production (automotive, aerospace, energy applications etc.)
METAL CUTTING INDUSTRY TRENDS
INVOICING 2014
END CUSTOMER
SEGMENTS
Africa/
Middle
East
1%
South
America
4%
Aerospace
11%
Energy
11%
Engineering
48%
Automotive
28%
Asia
19%
Europe
54%
North
America
22%
Share of sales 2014
MSEK
MARKET CHARACTERISTICS
• Market size: About 150 BSEK
• Market share: Around 20%
• Growth rates: Industrial Production (IP) driven,
4-5% historically
Invoicing
10 000
EBIT margin
ROCE 12 months
8 000
40%
6 000
30%
4 000
20%
2 000
10%
0
0%
2007
-2 000
15
50%
2008
2009
2010
2011
2012
2013
2014
-10%
SANDVIK MATERIALS
TECHNOLOGY
17%
SHARE OF GROUP’S
TOTAL INVOICING 2014
PRODUCT AREAS
Primary Products
Tube
In house up
stream supplier to
the other product
areas - and external
sales of bars, billets
and rock drill steel.
Seamless tubes
and pipes in an
extensive program
of stainless steels,
nickel alloys,
titanium, zirconium
or other advanced
materials.
Strip, Wire and Heating Technology
BUSINESS CONCEPT
• Product innovation, technology leadership and close, longterm customer relationships.
• The cutting-edge expertise is based on world leading
metallurgy and R&D/materials technology.
• The high value-added products are aimed at helping
customers fulfill – and even exceed – their productivity and
performance expectations.
KEY SUCCESS FACTORS
Metal and ceramic resistance materials in the
form of wire, strip, elements and systems for
electrical heating. Strip steel and strip-based
products in high and special alloy grades,
metal powder, Hot Isostatic Pressed (HIP)
and welding products, wire for advanced
applications, controlled expansion alloy products.
Competitors
• Growth in the energy segment
• Growth in Asia
• New product development
•
•
•
16
Sumitomo
Valinox
Tubacex
•
•
Hitachi
Böhler
Uddeholm
•
•
•
ThyssenKrupp VDM
Ugitech
Jiuli
•
BaoSteel
MATERIALS TECHNOLOGY
DEMAND DRIVERS
• Energy demand and oil prices (Oil & Gas and Nuclear)
• Consumer demand (razors, electronics, white goods)
• Automotive production
END CUSTOMER
SEGMENTS
Mining Aerospace
3% 3%
Medical 2%
Construction 4%
Automotive
7%
Consumer &
Electronics
13%
General
Engineering
19%
Australia 5%
Africa/
Middle
East 1%
South
America
2%
Chemical
7%
INDUSTRY TRENDS
• Increased demands on safety and reliability
• Environmental demands on longer lifecycles and
sustainability
• Energy consumption
• Increased requirements on productivity and cost-efficiency
INVOICING 2014
Energy
42%
Asia
17%
Europe
49%
North
America
26%
Share of sales 2014 (excluding divested businesses)
MSEK
MARKET CHARACTERISTICS
• Market size: More than 100 BSEK
• Market share: 5-50% depending on niche
• Growth rates: 4-6%, normally higher growth in areas such as
the energy segment
6 000
60%
5 000
50%
4 000
40%
3 000
30%
2 000
20%
1 000
10%
0
-1 000
-2 000
17
-3 000
0%
2007
2008
2009
2010
2011
2012
2013
Invoicing
EBIT margin
EBIT margin, excl metal price effect and nonrecurring items
ROCE 12 months
2014
-10%
-20%
-30%
SANDVIK
CONSTRUCTION
BUSINESS CONCEPT
•
•
•
•
•
Target core niches globally
Be Global – Act Local
Premium brands & Mid-market brand
Multibrand & multichannel
Low asset based and cost effective business
system
KEY SUCCESS FACTORS
• Service is our success
• Customer knowledge
• Competitive offering
SHARE OF GROUP’S
TOTAL INVOICING 2014
10%
TARGET NICHES
Surface Drill &
Blast Contracting
• Surface Drills
• Rock Tools
Breaking, Crushing
& Screening
Contracting
• Breakers
• Mobile Crushers
& Screens
• Manganese
Aggregates &
Cement Quarrying
Underground
Civil engineering
Contracting
•
•
•
•
•
•
• Underground Drills
& Bolters
• Breakers
• Mechanical Cutting
• Loading & Hauling
• Rock Tools
Crushers
Screens
Surface Drills
Systems
Rock Tools
Manganese
Consumables, wear parts, spare parts and services
Sandvik: premium brand for full offering
Rammer: premium brand for breakers
Shanbao: mid-market for
breakers, crushers and screens
Largest global competitors: Atlas Copco, Terex, Metso, Furukawa
18
CONSTRUCTION DEMAND DRIVERS
•
•
•
•
Population growth
World economy
Urbanization
Infrastructure
INVOICING 2014
SALES DISTRIBUTION
Australia 5%
Surface drill
Underground
civil engineering and blast
contracting
20%
20%
Asia
21%
Europe
39%
CONSTRUCTION INDUSTRY TRENDS
•
•
•
•
•
•
•
Environment, Health and Safety
Mobile solutions and flexibility
Increased productivity
Advances in technology
Emergence of “mid-market”
Importance of the competition from Asia
Importance of service
Aggregates
and cement
quarrying
30%
•
•
•
•
•
Target market size: 140 BSEK
Growth rates: 4% average long-term
More than 20,000 customers
Large aftermarket
Local business
South
America
10%
North
America
17%
Share of sales 2014
MSEK
Invoicing
4 000
MARKET CHARACTERISTICS
Africa/ Middle
East 11%
Breaking,
crushing
and screening
contracting
30%:
EBIT margin
ROCE 12 months
40%
3 000
30%
2 000
20%
1 000
10%
0
0%
2007
2008
2009
2010
2011
2012
2013
2014
-1 000
-10%
-2 000
-20%
19
SANDVIK VENTURE
SHARE OF GROUP’S
TOTAL INVOICING 2014
PRODUCT AREAS
Wolfram Bergbau
und Hütten
Sandvik Process
Systems
Sandvik Hyperion
9%
Varel International
Energy Services
BUSINESS CONCEPT
• Sandvik Venture creates value through
profitable growth of small to mid-sized
businesses of particular interest for
Sandvik
• Grow profitable stand-alone businesses
that can provide value to Sandvik,
strategically as well as financially
A world leading
manufacturer of
tungsten oxide-,
tungsten metal-,
and tungsten
carbide powders.
Competitors
•
•
•
20
Kennametal
Iscar
Berndorf
A leading global
manufacturer of
Hard and Superhard materials
Providing high
performance steel
belts and steel
plates, steel belt
based processing
equipment and
processing
equipment based
on adjacent
technologies.
•
•
Ceratizi
HC Starck
•
•
Element Six
GTP
A leading global
supplier of oil and
gas drilling
solutions; drill
bits, down-hole
products for well
construction and
well completion.
VENTURE DEMAND DRIVERS
• Demand for productivity improvements
• Increased recycling focus
• Primary metals consumption leading to global industrial
production (aerospace, energy applications etc)
• Growth of oil & gas sector and shift to more advanced
drilling techniques
• Chemical industry development
• Construction (wood based panels)
INVOICING 2014
SALES DISTRIBUTION
Consumer related
4%
Mining 11%
Aerospace 4%
Australia
1%
Engineering
24%
Automotive 5%
Other
12%
Construction
9%
Africa/
Middle
East
2%
South
America
3%
Energy
31%
Asia
20%
Europe
57%
North
America
17%
MARKET CHARACTERISTICS
• Market share: 5-60% depending on niche
• Growth rates: Group average at 4-6%
Share of sales 2014 (Including Varel)
MSEK
4 000
40%
3 000
30%
2 000
20%
1 000
10%
0
-1 000
2008
2009
2010
2011
2012
2013
2014
-10%
-2 000
-20%
-3 000
-30%
-4 000
-40%
-5 000
21
0%
2007
Invoicing
EBIT margin
ROCE 12 months
-50%
GROUP EXECUTIVE MANAGEMENT
OLOF FAXANDER
President and CEO
JIM NIXON
President of
Sandvik Venture
JESSICA ALM
Executive Vice President and
Head of Communications
SCOT SMITH
President of
Sandvik Mining
MATS BACKMAN
Chief Financial Officer and
Executive Vice President
ÅSA THUNMAN
Excecutive Vice President and
General Councel
PETRA EINARSSON
President of
Sandvik MaterialsTechnology
DINGGUI GAO
President of
Sandvik Construction
JONAS GUSTAVSSON
President of
Sandvik Machining Solutions
ANNA VIKSTRÖM PERSSON
Executive Vice President and
Head of Human Resources
OLLE WIJK
Executive Vice President and
Head of Group R&D
ZZ ZHANG
Executive Vice President and
Head of Emerging Markets
SANDVIK.COM
23
© Copyright 2026