
PDF format
Friday, 06 February, 2015
For Internal Circulation Only
TA RESEARCH’S ‘DAILY COMPILED REPORTS’
News
a.
b.
Daily Market Commentary
Daily Brief
Fundamental Reports
a.
b.
c.
d.
e.
Guinness Anchor Berhad: Sturdy First-Half
Malaysia Marine & Heavy Engineering: Closing A Tough Year with a Whimper
Malaysian Economy: Malaysia's December Exports Up 2.7% YoY, Exceed Forecast
Public Bank Berhad: Pleasant Surprise!
Telecommunications Sector: Raid Data for Money
Technical Reports
f.
g.
Daily Technical Stock Picks
Daily Money Flow
Technical Stock Picks
FBMKLCI
Stocks Under Coverage
PLANTATION Sector
CONSTRUCTION Sector
PROPERTY Sector
h. Daily Stock Screen
i. Foreign Technical Stock Watch (AUS, HK & FSSTI)
Disclaimer
The information in this report has been obtained from sources believed to be reliable. Its accuracy or completeness is not guaranteed and opinions are subject to change
without notice. This report is for information only and not to be construed as a solicitation for contracts. We accept no liability for any direct or indirect loss arising
from the use of this document. We, our associates, directors, employees may have an interest in the securities and/or companies mentioned herein.
for TA SECURITIES HOLDINGS BERHAD (14948-M)
MENARA TA ONE, 22 JALAN P. RAMLEE, 50250 KUALA LUMPUR, MALAYSIA TEL: +603-20721277 / FAX: +603-20325048
(A Participating Organisation of Bursa Malaysia Securities Berhad)
Kaladher Govindan – Head of Research
Daily Note
Daily Market Commentary
(A Participating Organisation of Bursa Malaysia Securities Bhd)
Menara TA One, 22 Jalan P Ramlee, 50250 Kuala Lumpur
Tel : 603 - 2072 1277. Fax : 603 - 2032 5048
Friday, 06 February 2015
TA Research
e-mail : [email protected]
For Internal Circulation Only
KLSE Market Statistics (05.02.2015)
Volume
(mil)
+/-chg (RMmn)
Main Market 1,079.0 -463.0 1,926.5
Warrants
101.1
1.9
40.0
ACE Market 466.4
-304.6
121.9
Bond
1.2
0.2
0.6
ETF
0.1
0.05
0.1
Total
1,647.8
2,089.2
Off Market
26.3
-10.2
15.0
Value
+/-chg
-570.4
19.6
-52.5
0.2
0.07
-61.1
Major Indices
Index
+/- chg
Malaysia
FBMKLCI
FBMEMAS
FBMSCAP
Feb Futures
Other Markets
DOW JONES
NASDAQ (US)
FTSE (UK)
NIKKEI (JAPAN)
KOSPI (KOREA)
HANG SENG (HK)
FSSTI (S'PORE)
SET (BANGKOK)
JCI (JAKARTA)
SHANGHAI
SHENZHEN
AUSTRALIA
(mn)
9.8
9.3
3.3
1.0
@
@
@
@
Review & Outlook
Up Down
263
333
43
49
34
46
3
3
1
2
344
433
% chg
% YTD chg
1,803.21
12,395.87
16,017.58
1,798.00
0.19
1.47
0.63
-4.00
0.01
0.01
0.00
-0.22
2.38
2.73
6.53
2.68
17,884.88
4,765.10
6,865.93
17,504.62
1,952.84
24,765.49
3,406.58
1,607.92
5,279.90
3,136.53
1,526.11
5,810.98
211.86
48.39
5.91
-174.12
-9.95
85.73
-10.99
8.11
-35.39
-37.60
-2.93
33.64
1.20
1.03
0.09
-0.98
-0.51
0.35
-0.32
0.51
-0.67
-1.18
-0.19
0.58
0.35
0.61
4.57
0.31
1.94
4.92
1.23
7.36
1.01
-3.03
7.84
7.39
Top 10 KLCI Based on Mkt Cap.
Off Market
TROP
INSAS-PR
NIHSIN
DGSB
Value/
Volume
1.79
0.40
0.26
0.47
1.26
1.27
0.57
(RM)
1.05
0.18
0.45
0.10
Counter
Mkt Cap.
(RM’mn)
MAYBANK 83,127
PBBANK
71,206
CIMB
48,352
AXIATA
61,551
DIGI
50,460
GENTING
32,904
KLK
24,494
TM
26,036
PETDAG
17,942
BAT
19,416
Chg
(RM)
0.09
0.08
0.09
0.00
0.00
0.04
0.10
0.01
0.08
0.50
Vol.
(mn)
12.00
10.04
10.40
12.23
11.12
1.59
1.39
5.62
0.68
0.34
Important Dates
MAHSING - 3:10 Rights Issue - RI of 442.9m shares, together with
132.9 free detachable warrants.
3 rights shares for every 10 existing shares held, at an issue price of
RM1.42 per rights share, and 3 warrants for every 10 rights shares
subscribed.
Trading of Rights: 27/01 - 05/02/2015.
Application Closed: 12/02/2015. LISTING ON: 26/02/2015.
IOIPG - 1:6 Rights Issue - RI of 539.8m shares.
1 rights share for every 6 existing shares held, at an issue price of
RM1.90 per rights share.
LISTING ON: 09/02/2015.
Stocks eased into profit-taking consolidation Thursday due to regional
weakness after the ECB rejected Greek bonds in exchange for funding, and
as oil prices slumped from the recent sharp rally on supply glut worries.
The KLCI ended flat at 1,803.21, after oscillating between high of 1,804.25
and low of 1,796.41, as losers edged gainers 433 to 344 on cautious trade
totaling 1.64bn shares worth RM2.09bn.
Blue chips should extend sideways trade ahead of the weekend amid
external worries dominated by the Greece debt discussions with the ECB
and volatile crude oil prices. Key resistance stays at Wednesday's high of
1,831, near the current 200-day moving average level of 1,833, with next
hurdle at 1,840, the 76.4%FR level. Immediate support remains at 1,778,
the 50%FR level, with better support at 1,750, the 38.2%FR, and stronger
chart supports found at 1,730 and 1,716, the 23.6%FR level.
Any share price weakness on AMMB below the lower Bollinger band
(RM6.23) will be attractive to bargain for rebound upside towards RM6.48
(76.4%FR), with tougher hurdles from the upper band (RM6.66) and the
61.8%FR (RM6.79) capping near-term upside. Crucial support is from
the 15/12/14 low of RM5.97. A daily stochastics and MACD buy signal on
CIMB improves upside potential towards RM6.08 (38.2%FR), while a
confirmed breakout will target RM6.40 (50%FR) ahead. Crucial chart
supports are at the lower Bollinger band (RM5.15) and 12/1/15 low
(RM5.05).
•
•
•
•
•
•
•
•
•
•
•
•
•
News Bites
Malaysia's exports for December increased by 2.7% YoY to
RM67.69bn compared with a 2.1% YoY gain registered in the previous
month. It was well above consensus estimate of +1.0% YoY
Public Bank Berhad's FY14 net profit of RM4.5bn (+11.2% YoY) came
within expectations as it accounted for around 103% of ours and
consensus full year estimates of RM4.4bn respectively.
Malaysia Marine and Heavy Engineering's FY14 core net profit of
RM117.7mn (-43% YoY) underperformed ours and consensus
expectations as it only accounted for 72% and 77% of full year
estimates respectively.
Guinness Anchor Berhad announced a strong set of 1HFY15 results
as net profit expanded by 13% YoY to RM130.7mn.
Nexgram Holdings Bhd has entered into a joint-venture agreement
with Top Valley Properties Sdn Bhd to construct and develop a 2.15 ha
an agriculture land in Dengkil, Selangor.
The Securities Commission has approved the proposed listing of
Malakoff Corp Bhd on the Main Market of Bursa Securities.
YNH Property Bhd has signed a memorandum of understanding with
Hilton Worldwide Manage Ltd for a proposed hotel to be named
"Hilton Kuala Lumpur City Centre & Residences".
Tanjung Offshore Bhd has handed over to the Securities Commission
the findings of its independent committee which resulted in
suspensions last month for three senior company officials.
Oversea Enterprise Bhd will undertake a special Bumiputera issue of
35mn new shares, in order to comply with the Bumiputera equity
condition set by regulators.
As part of its asset-light strategy, a subsidiary of Masterskill Education
Group Bhd has proposed to dispose properties in Petaling Jaya,
Selangor, and Masai in Johor, to Brilland Property Sdn Bhd for
RM79.7mn cash.
Fututech Bhd has requested its securities be suspended from trading
from 9:00am today pending a material announcement.
Applications for unemployment benefits in the US increased by 11,000
to 278,000 in the week ended Jan. 31, from a revised 267,000 in the
prior period.
The Bank of England left its main interest rate unchanged at 0.5% as
lower oil prices push the inflation rate further below its target, despite
continued strong economic growth and falling unemployment.
Exchange Rate
RM/USD
3.5651 0.0008
YEN/USD
117.42 0.0100
USD/EURO 1.1433 -0.0009
Commodities Futures
Palm Oil (RM/mt)
2,303.00 118.00
Crude Oil ($/Barrel)
50.92
2.22
Gold ($/tr.oz.)
1,265.00 -4.40
DISCLAIMER
The information in this report has been obtained from sources believed to be reliable. Its accuracy or completeness is not guaranteed and opinions are subject to change without
notice. This report is for information only and not to be construed as a solicitation for contracts. We accept no liability for any direct or indirect loss arising from the use
of this document. We, our associates, directors, employees may have an interest in the securities and/or companies mentioned herein.
for TA SECURITIES HOLDINGS BERHAD
Kaladher Govindan, Head of Research
TA Securities
Friday, February 06, 2015
FBMKLCI: 1,803.21
A Member of the TA Group
MENARA TA ONE, 22 JALAN P. RAMLEE, 50250 KUALA LUMPUR, MALAYSIA TEL: +603-20721277 / FAX: +603-20325048
`
Daily Brief
Market View, News In Brief: Corporate, Economy, and Share Buybacks
THIS REPORT IS STRICTLY FOR INTERNAL CIRCULATION ONLY*
TA Research Team Coverage
Market View
Tel: +603 – 2072 1277
[email protected]
www.taonline.com.my
Range Bound Amid External Worries
Stocks eased into profit-taking consolidation Thursday due to regional weakness after the
ECB rejected Greek bonds in exchange for funding, and as oil prices slumped from the recent
sharp rally on supply glut worries. The KLCI ended flat at 1,803.21, after oscillating between
high of 1,804.25 and low of 1,796.41, as losers edged gainers 433 to 344 on cautious trade
totaling 1.64bn shares worth RM2.09bn.
Support at 1,778, Resistance at 1,831
Blue chips should extend sideways trade ahead of the weekend amid external worries
dominated by the Greece debt discussions with the ECB and volatile crude oil prices. Key
resistance stays at Wednesday’s high of 1,831, near the current 200-day moving average
level of 1,833, with next hurdle at 1,840, the 76.4%FR level. Immediate support remains at
1,778, the 50%FR level, with better support at 1,750, the 38.2%FR, and stronger chart
supports found at 1,730 and 1,716, the 23.6%FR level.
BUY AMMB & CIMB for Rebound
Any share price weakness on AMMB below the lower Bollinger band (RM6.23) will be
attractive to bargain for rebound upside towards RM6.48 (76.4%FR), with tougher hurdles
from the upper band (RM6.66) and the 61.8%FR (RM6.79) capping near-term upside.
Crucial support is from the 15/12/14 low of RM5.97. A daily stochastics and MACD buy
signal on CIMB improves upside potential towards RM6.08 (38.2%FR), while a confirmed
breakout will target RM6.40 (50%FR) ahead. Crucial chart supports are at the lower
Bollinger band (RM5.15) and 12/1/15 low (RM5.05).
Most Asian Markets Lower On Greek Debt
Asian stocks were mostly lower on Thursday after the European Central Bank said it would
not accept Greek bonds as collateral, a robust early response to Athens's efforts to
renegotiate bailout terms with creditors. Investors also became more risk-averse as an
extended rally in crude oil petered out. Wall Street snapped a two-day surge overnight,
weighed by a slide in energy shares. Worries about Greek debt were in focus after the
European Central Bank (ECB) banned the use of Greek government bonds as collateral for
ECB cash on Wednesday. China stocks surrendered early gains as traders took profits after
the central bank unveiled its latest stimulus measures. Banks closed lower following a 4
percent rally earlier, with Agricultural Bank of China and China Construction Bank fell over 1
percent each.
Japan's Nikkei share average also dipped on Thursday on news of the European Central
Bank's hardline stance on Greek debt and fresh falls in oil prices, while investors took profits
in Toyota and some others after their unsurprising earnings. Hitachi plunged 10 percent
after operating profit dropped 1 percent on year, Mazda Motor skidded nearly 3 percent
after posting a 5 percent drop in earnings. Meanwhile, Australian shares jumped to a sevenyear high, reversing earlier losses and extending gains into an eleventh session.
Page 1 of 7
TA Securities
6-Feb-15
A Member of the TA Group
Banks underpinned gains with National Australia Bank up 1.3 percent after reporting that
net profit rose to $1.8 billion in the last three months of 2014, lower than $1.4 billion a year
ago. Australia New Zealand Banking also rose 1 percent while Commonwealth Bank of
Australia jumped 2.6 percent.
Wall Street Up on Oil Rebound
US stocks rose on Thursday as crude oil rebounded, although caution remained following the
European Central Bank's surprise decision to strike Greek bonds off its list of accepted
collateral. Greek banking shares fell sharply on the day, which in turn limited the advance of
broader European equities. In a sign the region remains unstable, Greece's new leftist
finance minister clashed openly with his powerful German counterpart. The ECB's actions,
which were announced on Wednesday, mean the Greek central bank will have to provide its
banks with tens of billions of euros of additional emergency liquidity in the coming weeks.
Greek Prime Minister Alexis Tsipras' 10-day-old government has said it would not extend a
bailout program, which is due to expire at the end of this month. It has also refused to
cooperate with the so-called troika of international lenders.
While energy stocks were the big gainers on Wall Street, equities were also supported by
encouraging jobless claims data, which came a day before Friday's non-farm payrolls figures,
boosted sentiment, as well as Pfizer buying Hospira Inc for about $15 billion. U.S. crude oil
futures rose 4.8 percent to $50.75 per barrel on falling output and rising violence in Libya.
Oil has risen in five of the past six sessions and, so far this year, there have been only four
sessions with moves less than 1 percent. Despite the recent rise, oil remains down more than
50 percent from a high reached in June. The Dow Jones Industrial Average rose 211.86
points, or 1.2 percent, to 17,884.88, the S&P 500 gained 21.01 points, or 1.03 percent, to
2,062.52 and the Nasdaq Composite added 48.39 points, or 1.03 percent, to 4,765.10.
Page 2 of 7
TA Securities
6-Feb-15
A Member of the TA Group
News In Brief
Corporate
Nexgram Holdings Bhd has entered into a joint-venture agreement with Top Valley
Properties Sdn Bhd (TVP) to construct and develop an agriculture land in Dengkil, Selangor.
Under the agreement, TVP granted the sole and exclusive development rights over the 2.15
ha leasehold land to Nexgram Land Sdn Bhd, which is wholly-owned by Nexgram. The
project is for a mixed property development, including three tower blocks of service
apartments and shops. (Bernama)
The Securities Commission has approved the proposed listing of Malakoff Corp Bhd on the
Main Market of Bursa Securities. MMC Corp Bhd said its 51 per cent-owned unit had
submitted an application to Bursa Securities for the admission into the Official List and
quotation for its entire enlarged issued and paid-up ordinary shares. (Bernama)
YNH Property Bhd has signed a memorandum of understanding with Hilton Worldwide
Manage Ltd for a proposed hotel to be named "Hilton Kuala Lumpur City Centre &
Residences". The proposed hotel would be managed by Hilton Worldwide. (Bernama)
Tanjung Offshore Bhd has handed over to the Securities Commission the findings of its
independent committee which resulted in suspensions last month for three senior company
officials. Its independent non-executive director Shahrizal Hisham Abdul Halim had on
Thursday presented to the SC various complaints arising from the committee’s findings. The
findings included possible conflicts of interest and breaches of fiduciary duty by Muhammad
Sabri Ab Ghani and Tan Sri Tan Kean Soon. (StarBiz)
Chinese restaurant operator Oversea Enterprise Bhd will undertake a special Bumiputera
issue of 35mn new shares, in order to comply with the Bumiputera equity condition set by
regulators. It was part of its listing conditions to allocate 12.5% of its enlarged issued and
paid-up share capital to Bumiputera investors recognised by the Ministry of International
Trade and Industry. The price of the new shares will be determined at a later date; and the
funds raised, will be used for working capital. (Financial Daily)
As part of its asset-light strategy, Masterskill (M) Sdn Bhd, a subsidiary of Masterskill
Education Group Bhd(MEGB), has proposed to dispose properties in Petaling Jaya,
Selangor, and Masai in Johor, to Brilland Property Sdn Bhd for RM79.7mn cash. Brilland
Property is 59%-controlled by Siva Kumar Jeyapalan, 44, while the remaining 41% is held by
his family via Transaction Opinion Sdn Bhd. Siva Kumar has a 23% interest in MEGB, and is
the group’s chairman and executive director. (Financial Daily)
Fututech Bhd has requested its securities be suspended from trading from 9:00am on
Friday (Feb 6), pending a material announcement. Speculation is that the company’s major
shareholder will inject construction assets and job orderbook into Fututech. (Financial
Daily)
Page 3 of 7
TA Securities
6-Feb-15
A Member of the TA Group
News In Brief
Economy
Global
Emerging markets start 2015 in low gear
Global emerging markets started 2015 on a weak footing, according to the latest survey
data from HSBC and Markit. The HSBC Emerging Markets Index (EMI), a monthly indicator
derived from the PMI surveys, fell back from December’s three-month high of 51.7 to 51.2,
the joint-lowest since last May. In 2014 the EMI averaged 51.4, the lowest for any calendar
year since the series began in late-2005. The overall slowdown was driven by the weakest
expansion in services activity in eight months. In contrast, manufacturing output growth
picked up to the fastest since August. Among the four largest emerging economies, Russia
and Brazil fared worst in January. Russian private sector output declined at the fastest rate
since May 2009, while Brazilian output fell for the ninth time in ten months. Chinese growth
slowed for the fourth time in five months. India bucked the overall lacklustre trend,
registering one of the fastest rates of expansion in two years. New business growth
moderated in January and remained historically weak, while backlogs were broadly
unchanged and employment rose only marginally. Inflationary pressures weakened further
in January, as Chinese firms’ input prices fell at the fastest rate since March 2009. Russian
inflation remained rampant, however, with manufacturers’ input prices rising at the fastest
rate since October 1998. (Source: Markit Economics)
Asia
Malaysia
December Exports Up 2.7%, Exceed Forecast
In December, Malaysia’s exports increased by 2.7% YoY to RM67.69bn compared with a
2.1% YoY gain registered in the previous month. It was well above consensus estimate of
+1.0% YoY. This was mainly due to the strong growth of Electrical and Electronic products
(E&E). However, exports of oil based products such as Petroleum products decreased due
to a steep drop in global oil price. Thanks to the improved demand for E&E products, export
performance still in a positive territory at the final month of 2014. Meanwhile, import
increased to record a 4.2% YoY to RM58.50bn. Hence, trade balance registered a surplus of
RM9.2bn during the month. As for 2014, Malaysia’s export ended on a high note despite the
weaker overall external demand and lower commodity prices in the 2H14. Exports
increased by 6.4% YoY to RM766.13bn in 2014, compared with a 2.5% YoY gain in 2013.
Note that, the full year gain was below our estimate of 7.0% YoY but surpassed the
Government forecast of 6.0% YoY in the 2014/2015 Economic Report. Imports also
increased by 5.3% YoY in 2014 but narrowed from the 2013’s gain of 6.9% YoY. All in, trade
balance registered a surplus of RM83.11bn during the year, an increase of 16.6% YoY.
(Source: DOS, TA Securities)
Indonesia
Indonesia Growth Eases To 5-Year Low
Indonesia's economy grew at the slowest pace in five years in 2014 on weaker exports,
signaling the challenges that President Joko Widodo face to cushion growth amid falling
commodity prices and subdued investment. Gross domestic product grew 5.02% in 2014,
the weakest since 2009. A year ago, the economy expanded 5.58%.Southeast Asia's largest
economy is forecast to grow by 5.5% in 2015.In the fourth quarter, the economy grew
5.01% from last year, the same as in the prior quarter and slightly faster than an expected
4.9%.Quarter-on-quarter, GDP shrank 2.06%, which was worse than a 1.48% fall forecast
by economists. Growth is unlikely to slow any further from here. But a rebound is not
expected in the short-term with weak commodity prices and high interest rates set to
weigh on economic activity. On the expenditure side, household spending gained 5.01%
and government spending rose 2.83% in the fourth quarter from last year. Investment
advanced 4.27%. Exports declined 4.53%, while imports grew 3.22%.In January, the
manufacturing sector contracted for four consecutive months on weak output and orders,
according to Purchasing Managers' survey. The central bank is likely to keep its monetary
policy settings unchanged over 2015.Bank Indonesia raised its key interest rate at a special
meeting in November in response to the government's decision to raise fuel prices. It was
the first rate hike in a year. (Source: RTT News)
Page 4 of 7
TA Securities
6-Feb-15
A Member of the TA Group
U.S.
U.S. December trade deficit largest since 2012
The U.S. trade deficit in December widened sharply to its highest level since 2012 as
imports rose despite a lower energy bill, which could see the fourth-quarter growth
estimate revised down. The trade deficit jumped 17.1% to USUS$46.6bn, the largest since
November 2012. It was the biggest percentage increase since July 2009. November's
shortfall on the trade balance was revised up to USUS$39.8bn from a previously reported
USUS$39.0bn. Economists polled by Reuters had forecast the trade deficit falling to US$38.0
billion. When adjusted for inflation, the deficit widened to US$54.7bn from US$48.7bn in
November. December's surprise surge in the trade gap suggested a downward revision to
the fourth-quarter gross domestic product estimate. The government reported last week
that GDP expanded at a 2.6% annual rate, with trade estimated to have subtracted 1.02
percentage point from growth. In December, imports rose 2.2% to US$241.4bn, with
imports of non-petroleum products surging to a record high, a sign of strengthening in the
domestic economy. It also reflected the strength of the U.S. dollar. Exports slipped 0.8% to
US$194.9bn in December. Exports have been hurt by slowing growth in Asia and Europe, a
strengthening dollar, as well as a labor dispute at U.S. West Coast ports, which has been
cited by some manufacturers as causing delays in the movement of goods. Exports to
Canada and Mexico - the main U.S. trading partners - fell in December. In contrast, exports
to Japan, China and the European Union rose in December. The politically sensitive U.S.China trade deficit fell 5.5% to US$28.3bn. (Source: Reuters)
U.S. Productivity Falls in Last Months of 2014
U.S. worker productivity declined in the final months of 2014, the latest sign of weak gains
that could restrain the economy’s long-term growth. The productivity of nonfarm workers,
measured as the output of goods and services per hour worked, fell at a 1.8% seasonally
adjusted annual rate in the fourth quarter. Productivity was flat from a year earlier. A gauge
of labour costs rose in the fourth quarter. Unit labour costs increased at a 2.7% annual rate,
and climbed 1.9% from a year earlier. Productivity grew at a 3.7% rate in the third quarter,
revised up from an earlier estimate of 2.3% growth, and unit labour costs fell at a 2.3% pace
versus an earlier estimate of a 1% decline. Strong productivity gains can help boost broader
economic growth. Sluggish productivity growth, on the other hand, can be a drag on the
broader economy. (Source: The Wall Street Journal)
Fewer Americans Than Forecast Filed Jobless Claims Last Week
Fewer Americans than forecast filed jobless claims last week, hovering around levels that
are typically associated with an improving job market. Applications for unemployment
benefits increased by 11,000 to 278,000 in the week ended Jan. 31, from a revised 267,000
in the prior period. While holidays make it difficult to adjust the date for seasonal swings
this time of year, making the data more volatile, readings this low often correspond with
gains in hiring. A report is projected to show the U.S. payrolls grew 230,000 workers in
January. The four-week moving average, a less volatile measure than the weekly figures,
declined to 292,750 last week, the lowest in more than a month, from 299,250. The number
of people continuing to receive jobless benefits climbed by 6,000 to 2.4 million in the week
ended Jan. 24. The unemployment rate among people eligible for benefits held at 1.8%.
(Source: Bloomberg)
Consumer Comfort in U.S. Declines From Highest Level Since 2007
Consumer confidence declined last week from the highest level in more than seven years as
Americans’ attitudes about their finances ebbed with the stock market. While the
Bloomberg weekly index of consumer comfort fell to 45.5 in the period ended Feb. 1 from
47.3, it was still the second-best reading since July 2007. Measures of the buying climate
and views of the economy also lost ground. Americans with annual incomes of US$100,000
or more saw the biggest decrease in sentiment since February 2014, coming off the worst
month in a year for the Standard & Poor’s 500 Index. A gauge of Americans’ views on the
current state of the economy dropped to 39.9 last week from 42.3. An index of the buying
climate, showing whether this is a good time to purchase goods and services, declined to
37.5 from 39. A measure of personal finances fell to 59.2 from 60.7. (Source: Bloomberg)
Page 5 of 7
TA Securities
6-Feb-15
A Member of the TA Group
Europe
Euro Area
EU Raises Eurozone Growth Forecasts; Cuts Inflation Outlook
The European Commission raised the growth forecasts for Eurozone for this year and next,
citing strengthened domestic and foreign demand, very accommodative monetary policy
and a broadly neutral fiscal stance. In its winter forecast, the executive arm of the European
Union forecast 1.3% growth in the euro area for this year, which was higher than the 1.1%
predicted in November. The growth outlook for 2016 was also raised to 1.9% from 1.7%.
The EU economy as a whole was forecast to expand 1.7% this year and 2.1% in 2016. For
the first time since 2007, the economies of all European Union Member States are expected
to grow again this year. Meanwhile, inflation forecasts were cut further and prices are
expected to decline this year owing to falling energy prices. The inflation projection for this
year was lowered to -0.1% from 0.8% seen in November. The outlook for 2016 was also cut
to 1.3% from 1.5%. Inflation should increase as of mid-2015 and in the course of 2016, as
economic activity gradually strengthens, wages rise and the economic slack is reduced
(Source: RTT News)
Eurozone Retail PMI Drops as Sales Fall in France and Italy
January retail PMI data from Markit showed a further divergence in performance between
the Eurozone’s big-three economies, with Germany recording growth in sales for a fourth
straight month, while France and Italy both saw deepening downturns. The headline Markit
Eurozone Retail PMI – which tracks month-on-month changes in like-for-like retail sales
across the bloc’s biggest three economies combined – fell from 47.6 in December to 46.6, its
lowest in four months. The index has now posted below the critical 50.0 mark, signalling
falling sales, in eight of the past nine months. French and Italian retailers alike recorded
further decreases in sales in January. Moreover, in both cases, rates of decline had
accelerated for the second successive month, reaching the fastest overall for four and five
months respectively. In contrast, German retail sales continued to grow, rising for the
fourth straight month and at a slightly faster rate than in December. (Source: Markit
Economics)
U.K.
Bank of England Leaves Interest Rates Unchanged
The Bank of England left its main interest rate unchanged as lower oil prices push the
inflation rate further below its target, despite continued strong economic growth and falling
unemployment. The BOE said in a statement that its rate-setting Monetary Policy
Committee opted to leave the central bank’s benchmark interest rate at 0.5% at its
February meeting. The nine-member panel also chose to keep the size of the BOE’s bond
portfolio at GBP375bn (USUS$567bn). The U.K.’s annual rate of inflation fell to 0.5% in
December from 1.0% in November, and probably eased further below the BOE’s 2.0%
target in January. The European Commission said it now expects consumer prices to rise
1.0% during 2015, having previously forecast inflation of 1.6%. BOE forecasts show it could
take until late 2017 to bring inflation back to target, despite predictions of healthy growth
and a further decline in unemployment. The commission said it expects the U.K. economy to
grow 2.6% in 2015 and 2.4% in 2016, a more rapid expansion than it projects for other
large European nations, such as Germany, France and Italy. It also forecast that the
unemployment rate will fall to 5.6% this year and 5.4% in 2016. (Source: The Wall Street
Journal)
U.K Halifax House Prices Rise For Third Month In January
U.K house prices increased for the third straight month in January, survey data from Lloyds
Banking Group's Halifax division showed. House prices climbed 2.0% MoM in January,
faster than the 1.1% rise in the previous month. Economists had expected house prices to
remain flat during the month. The latest monthly increase was the highest January growth
since 2009, when it went up 2.4%. On a quarterly basis, house prices rose at a faster rate of
1.9% in the three months ended January after increasing 0.3% in the three months ended
December. This was the first increase in the quarterly growth rate since July. In the threemonth period to January, house prices surged 8.5% from the previous year, exceeding
economists' expectations for a 7.7% growth. (Source: RTT News)
Page 6 of 7
TA Securities
6-Feb-15
A Member of the TA Group
Germany
Factory Orders Expand Most Since July
German factory orders rebounded at the fastest pace in five months underpinned by both
domestic and foreign demand in December. Factory orders grew a seasonally and workingday adjusted 4.2% MoM in December, reversing a revised 2.4% fall in November. The latest
order growth was the strongest since July, when demand rose 4.8%. The growth also
exceeded a 1.5% rise expected by economists. On a yearly basis, orders rose 3.4% in
December, rebounding from a 0.4% drop in November. The annual growth rate was also
faster than the expected growth of 0.7%. Domestic orders climbed 3.4% on month in
December and orders from export market surged by 4.8%. New orders from the euro area
rose 5.9% from the previous month and bookings from other countries gained by 4.0%.
Manufacturers of intermediate goods recorded increases in new orders of 2.8% and orders
of capital goods grew by 5.7%. Meanwhile, demand for consumer goods registered a fall of
0.6%. On a separate note, German construction sector contracted at the start of 2015 due to
a drop in output as commercial and civil engineering activity fell further, data from Markit
showed. The Purchasing Managers' Index fell to 49.5 in January from 50.5 in December.
(RTT News)
Share Buy-Back: 05 -Feb 2015
Company
Bought Back
BKAWAN
HAIO
MAA
PARKSON
RCECAP
SUBUR
48,900
5,900
300,000
1,226,500
47,000
200
Price (RM)
18.34/18.32
2.39/2.38
0.68
2.47/2.45
0.32
1.97
Hi/Lo (RM)
Total Treasury
Shares
28,255,900
7,000,588
3,947,700
60,865,729
50,871,200
20,875,000
18.4/18.3
2.39/2.35
0.69/0.68
2.47/2.44
0.32
1.97
Source: Bursa Malaysia
Disclaimer
The information in this report has been obtained from sources believed to be reliable. Its accuracy or completeness is not guaranteed and opinions are subject to
change without notice. This report is for information only and not to be construed as a solicitation for contracts. We accept no liability for any direct or indirect
loss arising from the use of this document. We, our associates, directors, employees may have an interest in the securities and/or companies mentioned herein.
for TA SECURITIES HOLDINGS BERHAD (14948-M)
MENARA TA ONE, 22 JALAN P. RAMLEE, 50250 KUALA LUMPUR, MALAYSIA TEL: +603-20721277 / FAX: +603-20325048
(A Participating Organisation of Bursa Malaysia Securities Berhad)
Kaladher Govindan – Head of Research
Page 7 of 7
For Internal Circulation Only
SNAPSHOT OF STOCKS UNDER COVERAGE
Company
Share Price
(RM)
05-Feb-15
Target Price
(RM)
BETA
EPS (sen)
FY15
FY16
PER (X)
FY15
FY16
0.76
3.18
10.88
0.69
3.10
13.05
0.73
0.86
1.07
12.1
31.2
96.1
12.4
32.7
107.1
6.3
10.2
11.3
6.1
9.7
10.2
2.6
2.5
5.1
2.6
3.1
5.7
0.98
3.47
12.68
-22.4
-8.4
-14.2
0.68
2.60
10.00
11.8
22.3
8.8
-1.3
9.7
-0.7
BANKS & FINANCIAL SERVICES
AFG
4.78
AFFIN
2.87
AMBANK
6.29
CIMB
5.74
HLBANK
14.26
MAYBANK
8.92
PBBANK
18.44
RHBCAP
8.14
BURSA
8.19
4.35
3.10
7.30
6.90
14.10
11.20
20.30
10.00
8.40
1.15
0.84
1.09
1.27
0.64
1.09
0.83
1.07
0.99
37.4
31.3
66.9
51.1
118.9
72.9
126.3
86.9
35.1
40.9
32.7
65.6
55.0
131.1
78.9
133.8
94.3
39.9
12.8
9.2
9.4
11.2
12.0
12.2
14.6
9.4
23.3
11.7
8.8
9.6
10.4
10.9
11.3
13.8
8.6
20.5
4.7
5.2
4.1
4.6
2.9
6.7
2.9
2.5
4.4
5.2
5.2
4.5
4.9
2.9
6.7
2.9
2.7
4.9
5.23
3.94
7.47
7.56
14.96
10.20
20.93
9.70
8.29
-8.6
-27.2
-15.8
-24.1
-4.7
-12.5
-11.9
-16.1
-1.2
4.08
2.68
5.97
5.05
13.70
8.25
17.40
7.05
7.21
17.3
7.1
5.4
13.7
4.1
8.1
6.0
15.5
13.6
1.7
-1.0
-4.7
3.2
2.0
-2.7
0.8
6.8
1.1
CONSTRUCTION
BPURI
GAMUDA
IJM
NAIM
SENDAI
TRC
WCT
LITRAK
0.58
5.14
6.92
3.06
0.61
0.40
1.59
3.80
0.74
4.81
6.61
3.74
0.55
0.53
1.67
4.18
1.17
1.22
0.87
2.00
1.67
1.58
1.14
0.54
9.6
31.2
36.6
49.6
6.8
6.5
14.6
28.6
19.3
32.9
54.3
51.0
11.0
10.8
15.1
38.5
6.1
16.5
18.9
6.2
8.9
6.2
10.9
13.3
3.0
15.6
12.7
6.0
5.5
3.7
10.5
9.9
6.9
2.7
2.2
2.0
3.3
5.0
6.3
4.7
6.9
2.9
2.6
2.0
3.3
7.5
6.3
5.3
0.80
5.34
7.03
4.42
1.14
0.62
2.35
4.09
-27.5
-3.7
-1.6
-30.8
-46.5
-35.5
-32.2
-7.1
0.50
4.28
5.59
2.78
0.49
0.34
1.38
3.39
16.0
20.1
23.8
10.1
25.8
17.6
15.2
12.1
7.4
2.6
5.3
2.7
-21.8
5.3
0.0
2.7
11.94
12.20
11.42
13.55
0.78
0.64
64.6
70.0
68.4
76.9
18.5
17.4
17.5
15.9
4.9
5.2
5.2
5.7
13.54
15.28
-11.8
-20.2
10.36
12.02
15.3
1.5
1.7
-0.8
3.01
10.98
18.94
73.30
2.47
3.60
3.29
12.92
19.44
63.04
2.72
4.12
1.13
0.51
0.54
0.44
0.58
0.98
19.2
68.7
82.5
275.5
12.4
15.3
21.7
74.7
90.2
298.4
14.6
17.9
15.7
16.0
23.0
26.6
19.9
23.5
13.9
14.7
21.0
24.6
17.0
20.1
1.9
5.6
3.9
3.6
2.2
1.1
2.2
6.1
4.3
3.9
2.6
1.3
4.33
12.28
19.02
73.50
3.17
3.60
-30.5
-10.6
-0.4
-0.3
-22.1
0.0
2.64
10.00
15.42
63.50
2.17
2.83
14.0
9.8
22.8
15.4
13.8
27.3
-4.4
5.6
8.6
7.0
-1.2
9.1
68.00
72.59
0.89
349.5
359.9
19.5
18.9
4.7
4.8
74.40
-8.6
58.00
17.2
4.5
8.85
4.16
11.88
4.57
1.21
0.89
57.1
28.5
60.2
28.1
15.5
14.6
14.7
14.8
1.2
2.0
1.3
2.3
10.36
4.68
-14.6
-11.1
8.30
3.78
6.6
10.1
-0.2
2.2
3.40
4.51
0.95
27.2
27.6
12.5
12.3
7.9
8.2
3.95
-13.9
3.36
1.2
-3.1
5.24
3.96
4.65
4.60
0.83
0.78
10.7
14.7
13.1
17.0
48.8
26.9
40.1
23.3
0.5
1.9
0.6
1.9
5.38
4.04
-2.6
-2.0
3.56
2.97
47.2
33.3
8.7
7.0
7.51
5.18
2.20
4.84
4.07
6.10
5.40
2.20
4.95
3.55
0.65
0.51
1.05
0.75
na
27.7
29.6
21.1
33.3
15.0
35.4
34.3
24.6
36.8
17.2
27.1
17.5
10.4
14.5
27.1
21.2
15.1
9.0
13.2
23.7
1.6
2.6
2.9
3.4
0.9
2.0
3.0
3.3
3.8
1.1
7.68
5.52
3.08
5.90
4.11
-2.2
-6.2
-28.6
-18.0
-1.0
5.72
3.63
1.58
4.21
2.64
31.3
42.7
39.2
15.0
54.2
6.8
15.9
31.0
7.1
20.4
INDUSTRIAL
SCIENTX
SKPRES
UNIMECH
6.61
0.77
1.57
8.56
1.10
1.73
1.19
1.05
1.08
76.0
5.0
21.1
88.0
9.6
24.2
8.7
15.3
7.4
7.5
8.0
6.5
3.5
3.3
4.5
4.1
5.3
5.4
7.63
0.84
1.78
-13.4
-8.4
-11.8
4.98
0.31
1.40
32.7
150.8
12.1
-6.8
19.5
5.4
MEDIA
MEDIA PRIMA
STAR
1.89
2.53
2.34
2.52
1.54
0.56
17.3
21.0
18.0
22.0
10.9
12.0
10.5
11.5
7.4
7.1
7.9
7.1
2.64
2.79
-28.4
-9.2
1.61
2.09
17.4
21.0
7.4
9.5
OIL & GAS
ICON
MHB
PANTECH
PCHEM
PERISAI
SKPETRO
UMWOG
0.69
1.53
0.75
5.29
0.49
2.77
2.69
1.33
1.47
0.93
5.60
0.96
3.96
3.66
na
1.51
1.51
1.06
2.51
1.81
na
12.1
12.3
9.9
42.9
9.6
22.9
19.3
17.2
11.9
13.2
50.2
16.8
26.7
22.6
5.7
12.5
7.5
12.3
5.1
12.1
14.0
4.0
12.9
5.7
10.5
2.9
10.4
11.9
0.0
3.3
5.3
4.1
0.0
1.3
0.0
0.0
3.3
7.0
4.7
0.0
0.0
0.0
2.19
4.16
1.15
7.01
1.71
4.80
4.63
-68.5
-63.2
-34.8
-24.5
-71.3
-42.3
-41.9
0.62
1.27
0.71
4.65
0.38
2.02
1.91
12.2
20.5
6.4
13.8
28.9
37.1
40.8
-7.4
-14.0
-2.6
-2.9
7.7
19.4
14.5
AUTOMOBILE
EPMB
MBMR
UMW
CONSUMER
Brewery
CARLSBG
GUINESS
Retail
AEON
AMWAY
F&N
NESTLE
PARKSON
QL
Tobacco
BAT
GAMING
Casino
GENTING
GENM
NFO
BJTOTO
HEALTHCARE
Hospitals
IHH
KPJ
Rubber Gloves
HARTA
KOSSAN
SUPERMX
TOPGLOV
KAREX
Div Yield (%)
FY15 FY16
52weeks
High Price
% Chg
52weeks
Low Price
% Chg
% Chg
YTD
For Internal Circulation Only
SNAPSHOT OF STOCKS UNDER COVERAGE
Company
Share Price
(RM)
Target Price
(RM)
BETA
EPS (sen)
FY15
FY16
PER (X)
FY15
FY16
4.60
2.35
3.50
4.75
23.00
1.95
9.54
6.37
5.31
2.43
4.26
4.33
19.27
1.72
10.32
7.83
0.64
na
0.83
1.04
1.06
0.32
0.74
0.51
27.8
14.9
13.8
17.8
93.5
12.3
39.9
33.0
16.6
15.8
25.4
26.7
24.6
15.9
23.9
19.3
PLANTATIONS
BSTEAD
FGV
IJMPLNT
IOICORP
KLK
KWANTAS
SIME
UMCCA
29.7
17.5
17.7
22.6
118.1
18.9
53.5
45.4
15.5
13.5
19.8
21.0
19.5
10.3
17.8
14.0
Div Yield (%)
FY15 FY16
5.7
4.3
2.3
2.5
2.2
1.5
3.0
3.3
6.1
4.3
2.9
2.7
2.8
2.6
3.4
4.4
52weeks
High Price
% Chg
5.66
4.70
4.03
5.36
25.14
2.30
9.80
7.53
PROPERTY
CRESNDO
2.49
2.35
1.45
24.3
34.3
10.2
7.3
6.0
6.4
3.11
GLOMAC
0.99
0.87
1.19
10.6
13.4
9.3
7.4
4.0
4.5
1.21
HUAYANG
2.15
2.86
1.18
38.9
41.4
5.5
5.2
6.0
6.5
2.52
IOIPG
2.08
2.85
na
12.1
16.2
17.2
12.9
3.4
4.3
2.83
Note: IOIPG 1 for 6 rights issue shares, at an issue price of RM1.90 per rights share. Ex-Target price RM2.85.
MAHSING
1.99
2.60
1.17
20.5
23.7
9.7
8.4
4.0
4.8
2.38
Note: MAHSING 3 for 10 rights issue shares, at an issue price of RM1.42 per rights share. For more detail please refer to 22.01.15 report.
SNTORIA
1.14
1.35
0.80
13.6
19.0
8.4
6.0
1.8
1.8
1.61
SPSETIA
3.60
3.62
0.56
24.3
31.0
14.8
11.6
3.3
4.3
3.65
SUNWAY
3.33
3.85
1.17
30.7
30.4
10.8
11.0
3.6
3.8
3.67
REIT
SUNREIT
1.56
1.75
0.44
8.5
10.3
18.3
15.2
5.8
6.9
1.60
CMMT
1.43
1.58
0.68
8.6
9.6
16.5
14.9
6.5
7.1
1.66
52weeks
Low Price
% Chg
% Chg
YTD
-18.7
-50.0
-13.2
-11.4
-8.5
-15.2
-2.7
-15.4
4.38
2.02
3.11
4.09
19.60
1.90
8.78
6.00
5.0
16.3
12.5
16.1
17.3
2.6
8.7
6.2
-4.6
7.8
-3.3
-1.0
0.9
-2.5
3.8
1.6
-19.9
-18.2
-14.7
-26.5
2.27
0.90
1.71
2.06
9.7
10.0
25.7
1.0
8.3
1.0
4.9
-14.0
-16.3
1.84
8.2
-3.8
-29.2
-1.4
-9.3
0.84
2.74
2.61
36.5
31.4
27.6
-7.3
9.1
1.2
-2.5
-13.9
1.23
1.32
26.8
8.3
2.6
0.0
POWER & UTILITIES
PETDAG
PETGAS
TENAGA
YTLPOWR
18.06
22.44
14.54
1.57
16.57
23.67
17.00
1.94
0.88
1.17
1.08
0.91
63.8
84.9
122.6
15.0
87.8
85.0
119.0
15.0
28.3
26.4
11.9
10.4
20.6
26.4
12.2
10.5
3.6
2.7
2.5
0.6
3.6
2.8
2.4
0.6
30.98
24.96
16.96
1.79
-41.7
-10.1
-14.3
-12.3
14.56
20.60
11.22
1.42
24.0
8.9
29.6
10.6
5.5
1.3
5.4
6.1
TELECOMMUNICATIONS
AXIATA
DIGI
MAXIS
TM
7.17
6.49
7.07
7.00
7.16
6.76
6.78
8.32
0.86
0.90
0.74
0.73
33.5
26.7
30.3
23.5
37.3
29.4
32.3
25.4
21.4
24.3
23.3
29.8
19.2
22.1
21.9
27.6
3.5
4.0
4.3
3.7
3.9
4.5
4.5
3.8
7.29
6.65
7.30
7.60
-1.6
-2.4
-3.2
-7.9
6.38
4.66
6.21
5.43
12.4
39.3
13.8
28.9
1.7
5.2
3.2
1.7
TECHNOLOGY
Semiconductor & Electronics
IRIS
0.34
MPI
5.74
UNISEM
2.10
0.35
7.60
2.40
0.81
0.99
1.01
1.0
42.8
13.3
2.2
54.7
17.1
32.3
13.4
15.8
15.5
10.5
12.3
1.3
3.5
1.9
1.3
3.5
1.9
0.63
6.49
2.13
-46.8
-11.6
-1.4
0.22
3.98
0.95
52.3
44.2
122.2
34.0
26.7
18.0
2.2
1.3
2.9
2.0
2.94
8.65
-5.4
-17.2
2.19
6.30
26.9
13.7
2.2
5.3
1.3
3.5
1.3
3.9
7.99
3.67
-3.6
-4.6
5.94
2.45
29.6
42.9
6.6
4.2
TRANSPORTATION
Airlines
AIRASIA
2.78
3.41
1.06
24.4
30.9
11.4
9.0
AIRPORT
7.16
6.79
1.08
17.0
26.3
42.2
27.3
Note: AIRPORT proposed 1 for 5 rights issue shares. For more detail please refer to 12.11.14 report.
Freight & Tankers
MISC
7.70
8.36
0.95
44.0
48.5
17.5
15.9
WPRTS
3.50
3.48
na
16.4
18.1
21.4
19.3
SNAPSHOT OF FOREIGN STOCKS UNDER COVERAGE
Company
Share Price
(S$)
BANKS & FINANCIAL SERVICES
DBS
19.42
OCBC
10.49
UOB
23.40
PLANTATIONS
WILMAR
IFAR
3.21
0.71
Target Price
(S$)
Beta
EPS (cent)
FY15
FY16
PER (X)
FY15
FY16
Div Yield (%)
FY15 FY16
52week
High Price
% Chg
52week
Low Price
% Chg
20.60
11.50
26.60
1.07
1.00
1.13
171.6
95.6
226.1
175.8
106.6
248.3
11.3
11.0
10.4
11.0
9.8
9.4
2.9
4.7
3.2
2.9
5.7
3.2
20.67
10.63
24.72
-6.0
-1.3
-5.3
15.65
8.84
19.45
24.1
18.0
20.3
-5.7
0.3
-4.6
3.34
0.98
0.79
0.99
23.7
7.7
25.3
8.6
13.6
9.2
12.7
8.2
1.9
0.4
2.3
0.5
3.56
1.11
-9.8
-35.7
2.92
0.66
9.9
7.6
-0.9
-2.1
BUY : Total return within the next 12 months exceeds required rate of return by 5%-point.
HOLD : Total return within the next 12 months exceeds required rate of return by between 0-5%-point.
SELL : Total return is lower than the required rate of return.
Total Return is defined as expected share price appreciation plus gross dividend over the next 12 months.
Required Rate of Return of 10% is defined as the yield for one-year Malaysian government treasury plus assumed equity risk premium.
% Chg
YTD
TA Securities
RESULTS UPDATE
Friday, February 06, 2015
A Member of the TA Group
FBMKLCI: 1,803.21
MENARA TA ONE, 22 JALAN P. RAMLEE, 50250 KUALA LUMPUR, MALAYSIA TEL: +603-20721277 / FAX: +60320325048
Guinness Anchor (M)Berhad
Sector: Consumer
TP: RM15.42 (+26.2%)
Last Traded: RM12.20
Sturdy First-Half
BUY
THIS REPORT IS STRICTLY FOR INTERNAL CIRCULATION ONLY*
TA Research Team Coverage
+603-2072 1277 ext 1264
[email protected]
Review
• Guinness Anchor Berhad announced a strong set of 1HFY15 results with net
profit expanding by 13% YoY to RM130.7mn. It came above ours and
consensus estimates, accounting for 62% and 64% respectively. No dividends
were declared for the quarter under review.
• Growth can be attributed to healthier sales (+10.8% YoY and 32.5% QoQ) to
RM520.8mn. This is buoyed by favorable pricing, a well-rounded portfolio of
global brands offering wide array of choices to consumers and increased
purchases during the year-end festive season.
• EBIT margin climbed 1.6pts YoY and 0.8pts QoQ. This led to an expansion in
EBIT by 13.6% YoY to RM101.5mn. The increase is attributed to better cost
efficiencies, as well as efforts to optimise and improve productivity across all
aspects of GAB’s operations. Lower investments in commercial activities to
promote Chinese New Year in February, also contributed to the increment.
• Sequentially, ongoing efforts by the Royal Malaysian Customs and various
enforcement agencies to eradicate contraband beers also helped contribute to
GAB’S positive results.
Impact
• We raise our MLM volume growth assumption from 1% to 2% in FY15-FY17.
This is in view of effective ongoing efforts by the government to curb
contraband beers. Revenue per (HL 000) is also revised slightly to RM1.85 to
RM1.84 on the back a better mix of beer sales. Taken together, we revised our
revenue growth rate assumptions from 4% to 4.5%.
• We also tweaked EBIT margin up by 3.4%-points to 20.8% on account of the
various cost control activities as well as efforts to optimise and improve
productivity– which we note has yielded positive results for the group YTD.
• Taken together, we raise our FY15/16/17e net profit forecast to
RM262.7/318.8/364.5mn from RM211.8/232.4/250.4mn previously.
Outlook
• We are positive on the government’s efforts to bring down contraband beer
sales in the market. This will be a win-win situation for the beer industry and
also the welfare of Malaysia as a whole.
• We are optimistic by the absence of a duty hike in the revised budget
announcement recently, amid hopes to boost consumption in the tourism
sector.
• In addition, we are expecting a stronger 3QFY15 results due to the CNY
celebration in February. Furthermore, we believe suppliers and drinkers will
likely stock up at the end of March ahead of the GST implementation in April.
• New products launch coupled with cost efficiency measures could also help to
cushion generally weak sentiment.
Stock Code
Listing
Share Cap (m)
Market Cap (RMm)
Par Value (RM)
52-wk Hi/Lo (RM)
12-mth Avg Daily Vol (shrs)
Estimated Free Float (%)
Beta
Major Shareholders (%)
GAB
Main Board
302.1
3,685.6
0.50
15.28/12.02
82.7
0.5
0.64
GAPL Pte Ltd-51.0%
Aberdeen Asset-11.2%
Forecast Revision (%)
Forecast Revision (%)
Net profit (RMmn)
Consensus
TA/Consensus
Previous Rating
FY15
FY16
24.0
37.2
262.7
318.8
203.8
213.8
129%
149%
Sell (Maintained)
Financial Indicators
Net Debt / Equity
ROE
ROA
NTA/share
Price/NTA (x)
Share Performance
Price chg (%)
1 mth
6 mth
3 mth
12 mth
FY15
-18.7%
68.6%
35.7%
1.1
10.7
FY16
-14.7%
76.8%
41.7%
1.2
9.8
GAB
(0.7)
(6.0)
(9.2)
(12.9)
KLCI
5.0
(1.6)
(3.6)
0.3
(12-Mth) Share Price relative to the FBM KLCI
Source: Bloomberg
Page 1 of 2
www.taonline.com.my
TA Securities
6-Feb-15
A Member of the TA Group
Valuation
• In tandem with the revision to our earnings estimates, we raise our TP from
RM13.55 to RM15.42 based on DCF (COE: 9.5%; TG: 2.5%). Given the
encouraging upside from the stock’s last close, we upgrade our call from Sell
to Buy.
2QFY15 Results Analysis (RMmn)
YE 30 June
Sales
EBIT
Net int exp
PBT
Taxation
Net Profit
EPS
DPS
EBIT Margin
Pretax Margin
Net Margin
Tax Rate
(sen)
(sen)
2Q15
520.8
101.5
0.0
101.49
(25.4)
76.1
25.2
NA
1Q15
393.2
73.7
(0.9)
72.79
(18.2)
54.6
18.1
NA
(%)
(%)
(%)
(%)
19.5%
19.5%
14.6%
25.0%
18.7%
18.5%
13.9%
25.0%
QoQ%
32.5
37.7
(101.1)
39.4
39.4
39.4
39.5
NA
2Q14
499.4
89.3
(1.2)
88.14
(22.1)
66.1
21.9
NA
YoY%
4.3
13.6
(100.9)
15.1
15.1
15.2
15.2
NA
17.9%
17.7%
13.2%
25.0%
1H15
913.9
175.2
(0.9)
174.3
(43.6)
130.7
43.27
NA
1H14
825.2
156.1
(1.8)
154.3
(38.6)
115.7
38.3
NA
19.2%
19.1%
14.3%
25.0%
18.9%
18.7%
14.0%
25.0%
YOY%
10.8%
12.2%
-50.8%
12.9%
12.9%
13.0%
13.0%
NA
Earnings Summary (RMmn)
FYE June
Revenue
EBIT
EBIT margin
PBT
Net profit
EPS
EPS Growth
PER
DPS (sen)
Div Yield
ROE
FY12
1623.7
277.2
17.1%
277.0
207.4
68.7
14.3%
17.8
125.0
10.2%
55.4%
FY13
1676.3
292.7
17.5%
288.7
217.6
72.0
4.9%
16.9
75.0
6.1%
59.5%
FY14
1610.6
270.6
16.8%
265.8
198.2
65.6
-8.9%
18.6
68.5
5.6%
55.5%
FY15F
1702.9
353.4
20.8%
350.3
262.7
87.0
32.5%
14.0
78.3
6.4%
68.6%
FY16F
1828.8
427.9
23.4%
425.1
318.8
105.5
21.3%
11.6
95.0
7.8%
76.8%
FY17F
1949.4
488.4
25.1%
486.1
364.5
120.7
14.4%
10.1
108.6
8.9%
80.8%
Disclaimer
The information in this report has been obtained from sources believed to be reliable. Its accuracy or completeness is not guaranteed and
opinions are subject to change without notice. This report is for information only and not to be construed as a solicitation for contracts.
We accept no liability for any direct or indirect loss arising from the use of this document. We, our associates, directors, employees may
have an interest in the securities and/or companies mentioned herein.
for TA SECURITIES HOLDINGS BERHAD(14948-M)
(A Participating Organisation of Bursa Malaysia Securities Berhad)
Kaladher Govindan – Head of Research
Page 2 of 2
RESULTS UPDATE
TA Securities
Friday, February 06, 2015
FBM KLCI: 1,803.21
Sector: Oil & Gas
A Member of the TA Group
MENARA TA ONE, 22 JALAN P. RAMLEE, 50250 KUALA LUMPUR, MALAYSIA TEL: +603-20721277 / FAX: +603-20325048
Malaysia Marine & Heavy Engineering
TP: RM1.47 (-3.8%)
Last traded: RM1.53
Closing A Tough Year with a Whimper
Sell
THIS REPORT IS STRICTLY FOR INTERNAL CIRCULATION ONLY*
TA Research Team Coverage
Tel: +603-2167 9601
[email protected]
Review
MMHE’s FY14 core net profit of RM117.7mn (-43% YoY) underperformed
our expectations and consensus’, accounting for 72% and 77% of full year
estimates respectively. We excluded net FX gains (RM17.2mn) and asset
impairment (RM5mn) from core profit. For each and every quarter of the
year, MMHE had disappointed investors due to a depleted orderbook and
execution issues (eg. project delays and cost overruns).
In 4Q14, MMHE reported tax debits (unlike previous quarters) due to
year-end housekeeping adjustments for prior overprovisions. On the
bright side, the marine division reported improved sequential profits (>4x
QoQ), which cushioned the weak performance by the offshore segment.
This was on the back of a larger number of vessels repaired. We view this
positively as it signifies that MMHE’s marine yard is still doing well
despite the launch of Sembcorp Marine’s massive Phase 1 Tuas yard (74
hectares) in Singapore back in 4Q13.
We understand that 10% of 4Q14 offshore revenue comprises of
successful variation order (VO) claims. We are somewhat disappointed
that recognition of VO was unable to provide a significant uplift to profits
as previously hoped.
MMHE merely has 3 projects in-hand currently, including:- 1) Malikai TLP
(72% completed), 2) SK316 (49% completed), 3) Besar-A (15%
completed), and 4) Bergading NMB (planning stage). These projects, in
addition to previous job orders and marine contracts, amount to a backlog
(Figure 4) of RM1.58bn, which will sustain the group until early-2016.
Current outstanding orderbook is at an all-time low, and pales in
comparison to MMHE’s backlog (Figure 6) of RM7.3bn recorded back in
Mar 09. In particular, 2014 was a drought year for MMHE whereby only
RM356mn worth of new contracts (Figure 5) were secured (2013:
RM2.6bn).
Impact
Given capex cuts by oil companies and coupled with diminished
confidence in MMHE’s ability to clinch chunky new contracts, we slash our
FY15-16 orderbook replenishment targets for the group to RM2.0bn
(previous: RM3.0bn). This results in a reduction of 13%/14% to our
FY15/16 forecasts. We also introduce FY17 forecasts whereby we assume
new orders of RM2.0bn for the group.
7
3.
9.
SHARE INFORMATION
Listing Code
Page 1 of 3
MMHE MK
Stock Code
Listing
Share Cap (m)
Market Cap (RM 'mn)
5186
Main Market
1,600
2,448
Par Value (RM)
52-wk Hi/Lo (RM)
12-mth Avg Daily Vol ('000)
Estimated Free Float (%)
0.50
4.16/1.27
1,209
20
Beta
Major Shareholders (%)
MISC Bhd
Technip
Tabung Haji
1.8
66.5
6.1
6.2
FORECAST REVISION
FY15
FY16
Forecast Revision (%)
-13
Revised net profit (RMmn) 196.2
-14
190.2
Consensus (RMmn)
TA/Consensus (%)
Previous Rating
178.5
173.5
110.0
109.7
Sell (Maintained)
SCORECARD
% of FY
vs TA
vs Consensus
72 Below
77 Below
FINANCIAL INDICATORS
FY14
Net Debt/Equity (%)
ROA (%)
ROE (%)
NTA/Share (RM)
P/NTA (x)
SHARE PERFORMANCE
Price chg (%)
1 mth
3 mth
6 mth
12 mth
FY15
-0.03
0.02
4.1
7.3
1.7
0.9
3.9
6.8
1.7
0.9
MMHE
FBM KLCI
-8.9
3.8
-30.5
-56.3
-59.6
-2.0
-3.9
1.0
(12-Mth) Share Price relative to the FBM KLCI
Valuation
Following the earnings cut, our TP (based on 15x FY15 P/E) is reduced
correspondingly to RM1.47 (previous: RM2.13). Maintain Sell.
We do not expect MMHE’s prolonged order drought to turnaround
dramatically in the near-to-medium term. Capex cuts by oil majors
including Petronas result in reduced opportunities and exacerbate stiff
competition with international yards. Nevertheless, we cling on to the
hope that FY15 will be an improved year for the group given its newly
upgraded yard, and parent Petronas also has major pipeline CPP projects
www.taonline.com.my
Source: Bloomberg
TA Securities
6-Feb-15
A Member of the TA Group
waiting to be awarded. In addition, management also highlighted that the
group has an advantage versus international peers given a lower MYR
cost-base following a weaker MYR vs USD. Therefore, we imputed job
wins of RM2.0bn for the group in FY15.
With only 3 projects in hand currently, yard utilisation remains low
(estimated to be less than 50% currently) which leaves MMHE with
limited buffer for error. If MMHE sustains its previous execution track
record of project delays and cost overruns, this would strain the group’s
ability to deliver profits.
Figure 1: Earnings Summary
YE 31 Dec
2013
Revenue
EBITDA
EBITDA margin
Pretax profit
(%)
Net profit
2014
2015F
2016F
2017F
2,884.5
239.5
8.3
197.6
2,700.5
188.8
7.0
119.1
2,700.7
274.5
10.2
223.0
2,666.5
279.6
10.5
216.2
2,985.8
313.9
10.5
235.0
236.5
129.9
196.2
190.2
199.7
EPS
(sen)
14.8
8.1
12.3
11.9
12.5
EPS growth
PER
Gross DPS
(%)
(x)
(sen)
(2.2)
10.7
5.0
(45.1)
19.6
5.0
51.0
13.0
5.0
(3.1)
13.4
5.0
5.0
12.7
5.0
Divd Yield
ROE
(%)
(%)
3.1
9.3
3.1
5.0
3.1
7.3
3.1
6.8
3.1
6.8
Figure 2: 4Q14 Results Analysis (RM mn)
YE 31 Dec
4Q14
3Q14
QoQ%
Revenue
508.3
539.8
-6%
Core Operating Profit
23.2
22.6
3%
Net finance costs
1.4
0.5
n.m
Associates & JV
(2.5)
(3.0)
n.m
EI
17.1
0.0
n.m
Pretax profit
39.3
20.1
96%
Taxation
(22.3)
19.0
n.m
MI
(0.5)
(0.0)
n.m
Reported Net Profit
16.5
39.1
-58%
Core Net Profit
(0.7)
39.1 n.m.
Core EPS
(sen)
1.0
2.4
-58%
4Q13
YoY%
YTD FY14
YTD FY13
726.3
-30%
2,700.5
2,884.5
-6%
41.5
-44%
106.9
151.0
-29%
5.5
n.m
3.5
15.9
n.m
0.1
n.m
(3.5)
1.3
n.m
0.0
n.m
12.2
29.3
n.m
47.0
-17%
119.1
197.6
-40%
55.1
n.m
11.5
39.6
n.m
n.m
(0.7)
(0.7)
n.m
102.0
(0.1)
-84%
129.9
236.5
-45%
102.0
-101%
117.7
207.1
-43%
6.4
-84%
8.1
14.8
-45%
Core EBIT margin
(%)
5%
4%
6%
4%
6%
Pretax margin
(%)
8%
4%
6%
4%
7%
Core Net Margin
(%)
0%
7%
14%
4%
7%
Tax rate
(%)
57%
-95%
-117%
10%
12%
Page 2 of 3
YoY
TA Securities
6-Feb-15
A Member of the TA Group
Figure 3: 4Q14 Segmental Analysis (RM mn)
FYE 31 Dec (RMmn)
4Q14
3Q14
4Q13
QoQ (%)
YoY%
YTDFY14
YTDFY13
YoY (%)
Segmental Revenue
Offshore
422.6
507.4
665.5
-17%
-36%
2,447.7
2,599.9
-6%
Marine
117.2
39.3
60.8
198%
93%
320.8
284.6
13%
Others & Elimination
(31.5)
0.0
n.m
n.m
0.1
n.m
Group Revenue
508.3
539.8
(7.0)
726.4
-6%
-30%
2,700.5
(68.0)
2,884.6
-6%
10.7
16.1
11.6
-33%
-7%
64.7
104.9
-38%
Segmental EBIT
Offshore
Marine
13.0
3.2
19.8
301%
-34%
32.8
70.4
-53%
Others & Elimination
18.0
3.8
15.6
n.m
n.m
25.1
21.0
n.m
Group EBIT
41.7
23.1
47.0
81%
-11%
122.6
196.3
-38%
Segmental EBIT margin
Offshore
Marine
3%
11%
Group EBIT margin
8%
Source: Bursa Announcement, TA Securities
Figure 4: Current Outstanding Orderbook
3%
2%
3%
4%
8%
4%
33%
1%
25%
6%
5%
7%
Figure 5: Order Intake
Source: Company
Figure 6: Historical Outstanding Orderbook
Source: Company
Disclaimer
The information in this report has been obtained from sources believed to be reliable. Its accuracy or completeness is not guaranteed and
opinions are subject to change without notice. This report is for information only and not to be construed as a solicitation for contracts.
We accept no liability for any direct or indirect loss arising from the use of this document. We, our associates, directors, employees may
have an interest in the securities and/or companies mentioned herein.
for TA SECURITIES HOLDINGS BERHAD(14948-M)
MENARA TA ONE, 22 JALAN P. RAMLEE, 50250 KUALA LUMPUR, MALAYSIA TEL: +603-20721277 / FAX: +603-20325048
(A Participating Organisation of Bursa Malaysia Securities Berhad)
Kaladher Govindan – Head of Research
Page 3 of 3
TA Securities
ECONOMIC REPORT
Friday, February 06, 2015
FBMKLCI: 1,803.21
A Member of the TA Group
MENARA TA ONE, 22 JALAN P. RAMLEE, 50250 KUALA LUMPUR, MALAYSIA TEL: +603-20721277 / FAX: +603-20325048
Malaysian Economy
Malaysia's December Exports Up 2.7% YoY, Exceed Forecast
THIS REPORT IS STRICTLY FOR INTERNAL CIRCULATION ONLY*
TA Research Team Coverage
Tel: +603-2167 9220
[email protected]
Exports Increased by 2.7% YoY in December
In December, Malaysia’s exports increased by 2.7% YoY to RM67.69bn compared with a 2.1%
YoY gain registered in the previous month. It was well above consensus estimate of +1.0% YoY.
This was mainly due to the strong growth of Electrical and Electronic products (E&E). However,
exports of oil based products such as Petroleum products decreased due to a steep drop in global
oil price. Thanks to the improved demand for E&E products, export performance still in a
positive territory at the final month of 2014. Meanwhile, import increased to record a 4.2% YoY
to RM58.50bn. Hence, trade balance registered a surplus of RM9.2bn during the month.
As for 2014, Malaysia’s export ended on a high note despite the weaker overall external demand
and lower commodity prices in the 2H14. Exports increased by 6.4% YoY to RM766.13bn in
2014, compared with a 2.5% YoY gain in 2013. Note that, the full year gain was below our
estimate of 7.0% YoY but surpassed the Government forecast of 6.0% YoY in the 2014/2015
Economic Report. Imports also increased by 5.3% YoY in 2014 but narrowed from the 2013’s
gain of 6.9% YoY. All in, trade balance registered a surplus of RM83.11bn during the year, an
increase of 16.6% YoY.
Figure 1: Malaysia’s Full Year Exports
RMmn
Exports (LHS)
YoY% (RHS)
900,000
YoY%
20.0%
800,000
15.0%
700,000
10.0%
600,000
5.0%
500,000
0.0%
400,000
-5.0%
300,000
200,000
-10.0%
100,000
-15.0%
0
-20.0%
2005 2006 2007 2008 2009 2010 2011 2012 2013 2014
Source: DOS, TA Securities
As we highlighted, December exports increased by 2.7 % YoY. This was mainly due to the
advancement of E&E products (34.4% of total exports), which surged at a double digit growth of
14.9% YoY to RM23.3bn, compared with 6.7% YoY gain in November and 4.1% contraction in
October. This suggested the overall external demand is improving for E&E, especially in the U.S.
Moreover, Liquefied Natural Gas (LNG), which contributed 9.4% to total exports, increased by
12.9% to RM6.3bn due to the increase in both export volume and average unit value by 6.8% YoY
and 5.7% YoY, respectively. Nonetheless, resulting from the weaker prices of commodities and
sharp fall in global oil price, most of the oil based product experienced a decline in the final
month of 2014. Specifically, petroleum products continued to contract for the fifth conservative
month. The petroleum products, which accounted for 6.4% of total exports, decreased by 43.3%
YoY as both average unit value and export volume declined by 32.3% YoY and 16.2% YoY,
respectively.
Page 1 of 4
www.taonline.com.my
TA Securities
6-Feb-15
A Member of the TA Group
Exports were also affected by a 35.7% plunge in Crude Petroleum products amidst lower prices
(-27.3% YoY) and export volume (-11.6% YoY). In addition, Palm Oil products also decreased in
the month of December by 9.3% YoY.
Further details on the exports are as below,
Exports increased to U.S. (+RM1.3bn), European Union (+RM1.2bn), Republic of Korea
(RM0.96bn), Singapore (+RM0.52bn) and India (+RM0.44bn).
Timber and timber-based products, which contributed 2.8% to total exports, increased
RM0.2bn or 12.5% YoY to RM1.9bn.
Chemicals products (RM4.71bn, up 19.3% YoY);
Transport Equipment (RM1.01bn, up 40.6% YoY); and
Processed Food (RM1.49bn, up 17.5% YoY)
Meanwhile, imports increased by 4.2% YoY, compared with a marginal 0.1% YoY gain in the
previous month as imports of intermediate goods posted a double digit growth of 11.6% YoY,
compared with 3.4% YoY registered in the previous month. Noted that, import’s gain was well
above estimate of 2.6% increase. In addition, import of consumption goods rebounded to 4.5%
YoY, contrast the -1.7% contraction in the prior month. Nevertheless, import of capital goods fell
by 2.7% YoY due to the drop in transport equipment by 44.3% YoY.
Major import product were:
E&E products (RM16.3bn, up 6.9% YoY)
Petroleum Products (RM6.16bn, down 14.0% YoY)
Chemicals products (RM5.06bn, up 9.8% YoY)
Figure 2: Imports Performance
Imports Performance
Imports
Intermediate Goods
Capital Goods
Consumption Goods
Jul-14
-0.7%
2.7%
-18.3%
-8.9%
Aug-14
7.6%
19.8%
9.7%
8.5%
Sep-14
1.1%
11.2%
-19.3%
-1.0%
Oct-14
9.1%
21.1%
-1.5%
5.9%
Nov-14
0.1%
3.4%
6.3%
-1.7%
Dec-14
4.2%
11.8%
-2.7%
4.5%
Source: DOS, TA Securities
In conclusion, exports registered a better performance in 2014 compared to previous year. This
was mainly due to the robust growth recorded in 1H14. The gain in 2014 was mainly due to the
increase of Electronics and Electrical products (E&E) which expanded by 8.1% YoY to
RM256.2bn, reflecting the recovery in global demand. Nevertheless, on an average, exports
expanded by 12.5% YoY in 1H of 2014 but it started to grow at a slower pace since July 2014.
This was basically due to the steep drop in global oil price, which halved in the 2H14. Exports
only grew at softer pace of 1.0% in 2H14.
Going forward, we believe exports will be supported by non-commodity products, especially
from the E&E segment as a weaker Ringgit vis-à-vis regional currencies and the USD should
translate into higher demand for our products as US economy continues to grow and key trading
nations like Japan and China prop up consumption through policy measures. The quantitative
easing by the European Central Bank is an added catalyst to revive growth in the economic bloc.
We believe the strong double digit growth in intermediate goods imports is a good sign of
potential continued improvement in external demand for E&E products that will mitigate the
effect from lower commodity prices. Nonetheless, we anticipate a recovery in crude oil prices in
the 2H15 as demand improves due to various policy measures by central banks and
governments globally apart from some diminishing supply from unprofitable shale producers.
We expect oil price to average between USD55 and USD60 per barrel in 2015. As such, we are
maintaining our 2015 exports growth forecast at 3.9% YoY.
Page 2 of 4
TA Securities
6-Feb-15
A Member of the TA Group
Figure 3: YTD Performance of Regional Currencies vs Ringgit
2.3%
HKD
GBP
-0.1%
TWD
2.7%
AUD
-3.0%
SGD
0.2%
KRW
2.6%
JPY
4.1%
IDR
0.4%
THB
EUR
3.2%
-4.5%
3.7%
PHP
CNY
1.4%
US$
-6.0%
2.2%
-4.0%
-2.0%
0.0%
2.0%
4.0%
6.0%
Source: BNM, TA Securities
Figure 4: YTD Performance of Regional Currencies vs US$
Source: Bloomberg, TA Securities
As for the downside risk, we regard sustained deflationary pressures and development in Greece
as short-term dampeners for external demand should consumers tighten their purses in
anticipation of greater uncertainty. If Greece retaliates by exiting Eurozone the contagion effect
could be worst. This possibility cannot be ruled out if its central bank runs out of bullet in
providing liquidity to its own financial institutions post abrupt cancellation of acceptance of
Greek bonds for funding by the ECB and the debt-strapped government is unable to come to the
rescue. Then, it may be forced to revert to its own currency and policies to find a way out of the
economic mess.
Page 3 of 4
TA Securities
6-Feb-15
A Member of the TA Group
( T HI S P AGE I S I NT E N T I ON AL L Y L E FT B L ANK)
Disclaimer
The information in this report has been obtained from sources believed to be reliable. Its accuracy or completeness is not guaranteed and
opinions are subject to change without notice. This report is for information only and not to be construed as a solicitation for contracts.
We accept no liability for any direct or indirect loss arising from the use of this document. We, our associates, directors, employees may
have an interest in the securities and/or companies mentioned herein.
for TA SECURITIES HOLDINGS BERHAD(14948-M)
(A Participating Organisation of Bursa Malaysia Securities Berhad)
Kaladher Govindan – Head of Research
Page 4 of 4
RESULTS UPDATE
TA Securities
Thursday, February 05, 2015
FBM KLCI: 1,802.24
Sector: Finance
A Member of the TA Group
MENARA TA ONE, 22 JALAN P. RAMLEE, 50250 KUALA LUMPUR, MALAYSIA TEL: +603-20721277 / FAX: +603-20325048
Public Bank Berhad
TP: RM 20.30 (+10.3%)
Last traded: RM 18.40
Pleasant Surprise!
HOLD
THIS REPORT IS STRICTLY FOR INTERNAL CIRCULATION ONLY*
TA Research Team Coverage
Tel: +603-2167 9610
[email protected]
Review
FY14 net profit of RM4.5bn accounted for around 103% of ours and
consensus full year estimates of RM4.4bn respectively. Despite stronger
YoY profit growth, ROE softened to 19.9% from 22.4% a year ago on the
back of an issuance of 350.2mn new shares in August 2014. We predict
ROE to ease further on the back of further margin compression.
PBT advanced 9.5% YoY to RM5.8bn from RM5.3bn. This was anchored by
a combination of a 6.3% rise in total income and 26.5% contraction in loan
impairment allowances. Overhead expenses increased at modest pace of
4.1% YoY, most of which were due to higher personnel costs (+7.7% YoY or
RM134mn). Lower marketing and administration expenses totaling
RM38mn helped offset higher personnel expenses. Compared to 2013, the
group’s Cost to Income Ratio (CTI) was little changed at healthy levels of
some 30% (FY13: 30.7%).
Net interest income (NII) accelerated at a decent pace of 6.5% YoY to
RM5.9bn. Growth was supported by “consistently above-industry” loan
growth of 10.8%. PBB’s loans market share climbed to around 17.2%
(2013: 16.9%). Net interest margin (NIM) was however close to 20 bps
lower YoY despite the industry benefiting from an OPR hike in July 2014.
By segment, PBB’s overseas operations showed encouraging improvement
with loans in Hong Kong and Cambodia climbing 12% and 23%
respectively. Overseas operations account for 7.4% of group’s profit. Retail
operations (comprising individuals and SMEs) and HP, which combined,
makes up close to 70% of profit drove the group’s healthy loans growth
with increases of 11.5% and 7.5% each. Retail loans were primarily driven
by steady growth trend in residential properties financing and commercial
properties financing where PBB is market leader.
Non-interest income (non-NII) improved 9.2% YoY from RM1.8bn to
RM1.9bn. While most of the increase was attributed to stronger investment
income (+18% YoY), we observe notable increases in the fee income
(+8.0%), thanks to a one-off incentive payment from banca amounting to
RM7mn and higher income from the sale of unit trust (+8.8% YoY). Total
Net Asset Value of Funds (NAV) under management amounted to RM63mn
(FY13: RM62.5mn).
Group deposits expanded by 10.2% YoY – in tandem with loans growth, to
RM276.4bn. PBB now has some 15.9% share of the market for customer
deposits. Group’s net loan to deposit (LD) ratio stood at 88%.
Share Information
Bloomberg Code
PBK MK
Stock Code
1295
Listing
Main Market
Share Cap (mn)
3861.5
Market Cap (RMmn)
71051.6
Par Value
1.00
52-wk Hi/Lo (RM)
20.932/17.40
12-mth Avg Daily Vol ('000 shrs)
5059.8
Estimated Free Float (%)
52.7
Beta
0.83
Major Shareholders (%)
Tan Sri Dato’ Dr. Teh Hong Piow - 24.3
EPF - 14.9
Forecast Revision
Forecast Revision (%)
Net profit (RMm)
Consensus
TA's / Consensus (%)
Previous Rating
Page 1 of 3
FY15
FY16
2.0
(1.5)
4,877.8
5,167.6
4,742.0
5,144.0
102.9
100.5
HOLD (maintained)
Financial Indicators
ROE (%)
ROA (%)
CTI Ratio (%)
Gross Impaired Loans Ratio (%)
Loan loss coverage ratio (%)
BV/ Share (RM)
Price/ BV (x)
FY15
16.5
1.4
30.0
0.7
113.2
8.0
2.3
FY16
15.9
1.3
30.1
0.7
120.0
8.8
2.1
% of FY
103.0
103.0
Within
Within
PBK
1.4
(1.0)
(4.6)
(0.5)
FBM KLCI
1.2
(1.0)
(3.4)
(1.8)
Scorecard
vs TA
vs Consensus
Share Performance (%)
Price Change
1 mth
3 mth
6 mth
12 mth
(12-Mth) Share Price relative to the FBM KLCI
Elsewhere, PBB continued to uphold solid asset quality. Total impairment
allowances improved YoY bringing total credit cost ratio down to 11 bps
from 17 bps a year ago owing to stronger recoveries and lower individual
assessment allowance. Loan loss reserves and the gross impaired loans
ratio also improved to 122.4% (FY13: 118.5%) and 0.6% (FY13: 0.7%)
respectively.
Common Equity Tier 1 (CET1) Capital Ratio, Tier 1 Capital Ratio and Total
Capital Ratio climbed to 10.8%, 12.2% and 15.8%. The ratios incorporate:
1) proceeds from the Public Bank rights issue of RM4.83bn completed in
www.taonline.com.my
Source: Bloomberg
TA Securities
5-Feb-15
A Member of the TA Group
August 2014, and 2) the transfer of RM1.3bn from retained earnings to
regulatory reserves in compliance with BNM requirement.
The board has declared a second interim dividend of 31 sen. In addition to
the first interim dividend of 23 sen, total DPS for FY14 stands at 54 sen –
an increase as compared to 52 sen in FY13. This translates to a dividend
payout ratio of around 46%.
Impact
Incorporating FY14 results, we tweaked FY15/16/17 net profit forecast to
RM4,878/5,168/5,569mn from RM4,783/5,245/5,648mn respectively.
Outlook
While we do envisage a year of bumpier provisions in 2015 for PBB and
the sector in general, credit charge could remain fairly stable for PBB due
to its high mix of retail loans, which are less lumpy compared to the
corporate portfolios. Earnings will also be supported by healthy loans
growth, which management believes would again surpass industry’s
average due to its HP, mortgage and SME portfolios. PBB guides that loans
growth for 2015 would be 9-10% (i.e. above industry’s 8-9%). We have
modelled in loans growth assumption of 10% per annum for PBB.
Some downside risk to earnings include further margin compression as
deposit cost rise. This will be underpinned by: 1) lackluster deposit growth
(especially CASA deposits), 2) loans growth outpacing that of deposits, and
3) new liquidity coverage ratio (LCR) rules, which favour banks holding
more retail deposits. However, given the intense competition for deposits
in the industry, we believe PBB may resort to offering attractive deposit
promotions to strengthen its deposit base. We continue to forecast more
margin compression for PBB in 2015 (management guides 8 bps).
Taken together (including a Rights Issue completed in August 2014),
management guides that ROE will dip to c.16% - within our forecasts of
16.5/15.9/15.6% for FY15/16/17e. While management believes non-NII
could help buffer softer ROEs, weakened sentiments could also have some
impact on transactional fee income, creating cross selling opportunities,
wealth management and the sale of unit trust.
Valuation
PBB’s TP is maintained at RM20.30, valuing the stock at an implied FY15e
PBV of 2.6x. Valuation-wise, PBB is certainly a lot more attractive now with
current rolling PBV at its 10-year low of 2.3x.
Key upside/downside risks to PBB’s TP include: 1) stronger-than-expected
contributions from operations overseas, 2) higher contributions from the
sale of bancassurance and wealth management, 3) unexpected increase in
unemployment rate resulting in high default rates among retail borrowers,
4) cost pressure resulting in further NIM compression, and 5) external risk
factors due to uncertainties in the global market and potential outflow of
foreign funds resulting in an sharp exit by foreign shareholders.
Page 2 of 3
TA Securities
5-Feb-15
A Member of the TA Group
Table 1: Earnings Summary (RMmn)
FYE Dec
2013
2014
2015F
2016F
2017F
Net interest income
5570.5
5930.5
6392.0
6819.6
7414.7
Non-interest income
1750.6
1911.7
2076.4
2225.8
2386.3
837.1
831.2
872.8
916.4
962.2
Total operating income
8158.3
8673.4
9341.1
9961.7
10763.2
Pre-provisioning profit
5654.7
6067.5
6542.3
6960.6
7544.2
Pretax profit
5310.0
5814.3
6306.0
6673.4
7184.4
Net profit
4064.7
4518.8
4877.8
5167.6
5569.2
EPS (sen)
105.3
107.3
115.8
122.7
132.2
Islamic Banking
EPS growth (%)
6.2
1.1
7.9
5.9
7.8
Gross div (sen)
52.0
54.0
54.0
54.0
54.0
2.8
2.9
2.9
2.9
2.9
Div yield (%)
4QFY14 Results Analysis (RMmn)
YE 31 Dec
Net interest income
Income from Islamic Banking business
Non interest income
Total income
Operating expenses
Operating profit
Loan impairment allowances
Profit from associates
PBT
Net profit
EPS (sen)
4QFY13
1,413.6
203.9
443.0
2,060.5
(630.4)
1,430.1
(89.1)
0.3
1,341.3
1,025.6
26.6
3QFY14
1,551.0
216.1
480.6
2,247.7
(648.5)
1,599.1
(47.0)
0.1
1,552.2
1,191.5
30.9
4QFY14
1,554.8
205.9
501.9
2,262.6
(635.5)
1,627.1
(62.5)
2.7
1,567.3
1,254.0
32.5
QoQ
0.2
-4.7
4.4
0.7
-2.0
1.8
33.0
>100.0
1.0
5.2
5.2
YoY
10.0
1.0
13.3
9.8
0.8
13.8
-29.8
>100.0
16.8
22.3
22.3
FY13
5,570.5
837.1
1,750.6
8,158.3
(2,503.6)
5,654.7
(351.1)
6.4
5,310.0
4,064.7
105.3
FY14
5,930.5
831.2
1,911.7
8,673.4
(2,605.9)
6,067.5
(258.2)
5.0
5,814.3
4,518.8
117.0
YoY
6.5
-0.7
9.2
6.3
4.1
7.3
-26.5
-22.2
9.5
11.2
11.2
Disclaimer
The information in this report has been obtained from sources believed to be reliable. Its accuracy or completeness is not guaranteed and
opinions are subject to change without notice. This report is for information only and not to be construed as a solicitation for contracts.
We accept no liability for any direct or indirect loss arising from the use of this document. We, our associates, directors, employees may
have an interest in the securities and/or companies mentioned herein.
for TA SECURITIES HOLDINGS BERHAD(14948-M)
MENARA TA ONE, 22 JALAN P. RAMLEE, 50250 KUALA LUMPUR, MALAYSIA TEL: +603-20721277 / FAX: +603-20325048
(A Participating Organisation of Bursa Malaysia Securities Berhad)
Kaladher Govindan – Head of Research
Page 3 of 3
TA Securities
SECTOR UPDATE
Friday, February 06, 2015
FBM KLCI: 1,803.21
A Member of the TA Group
Sector: TELCO
MENARA TA ONE, 22 JALAN P. RAMLEE, 50250 KUALA LUMPUR, MALAYSIA TEL: +603-20721277 / FAX: +603-20325048
Neutral
Telecommunications Sector
Raid Data for Money
THIS REPORT IS STRICTLY FOR INTERNAL CIRCULATION ONLY*
TA Research Team Coverage
Tel: +603-2167 9601
[email protected]
We maintain our Neutral stance on the sector as we believe earnings for mobile operators
will remain subdued until data monetisation plays out. Data yields have declined despite
the boom in traffic and accelerating smartphone penetration. Unless mobile operators
achieve critical traffic volume or increase pricing, EBITDA margin decline will likely
persist. This is on the back of cannibalisation of voice and SMS by data. We believe it is
currently a challenge to hike prices without causing adoption and usage rates to plunge.
Furthermore, competition remains heightened, and operators need to build a critical
mass of data subscribers to justify expensive 4G capex rollout. We estimate that for every
RM1 increase in Data ARPU, this would result in bottomline expansion of 5%/2%/0.5%
for Digi/Maxis/Axiata. Therefore, we maintain Neutral until signs of expanding data
yields emerge.
Data Gnawing at Voice. Data monetisation remains the biggest challenge for Malaysian
mobile operators on the back of the structural transition of voice to data. Data contribution has
been on upwards trajectory at the expense of voice and SMS services (Figures 1 & 2). Although
voice remains the dominant revenue driver (53%-60%) for now, contribution from data
services (25%-33%) have almost doubled for Digi and Celcom since 1Q12.
Figure 1: Voice Contribution to Service Revenue
Source: Companies, TA Research
Figure 2: Data* Contribution to Service Revenue
* Includes Mobile Internet (MI) and Wireless Broadband (WBB)
Source: Companies, TA Research
Page 1 of 4
www.taonline.com.my
44
9.7
mn
TA Securities
6-Feb-15
A Member of the TA Group
Data Yields Still Compressed. Data yields (Figure 3) have declined despite the data boom
(Figure 4) and accelerating smartphone penetration (Figure 5). We understand from operators
that margins for small screen MI are attractive, almost matching that of voice services.
However, we believe that unless operators achieve a critical volume of MI traffic, or increase
data pricing, EBITDA margin decline will continue to persist.
Figure 3: Data Yield (RM/GB)
50
45
41.0
40.0
37.8
Data Yield (RM/GB)
40
33.8
35
30.5
30
25
26.5
26.9
27.8
26.8
24.2
22.1
21.9
21.2
18.7
20
15.8
15.4
14.9
15
13.8
14.4
13.9
10
5
0
2Q12
3Q12
4Q12
1Q13
2Q13
Celcom
3Q13
4Q13
1Q14
2Q14
3Q14
Digi
Source: Companies, TA Research
Figure 4: Data Traffic Volume
Figure 5: Smartphone Penetration
Data Traffic Volume ('000 TB)
30
25
20
15
10
5
0
1Q12 2Q12 3Q12 4Q12 1Q13 2Q13 3Q13 4Q13 1Q14 2Q14 3Q14
Celcom
Digi
Source: Companies, TA Research
Source: Companies, TA Research
Smartphone Penetration Still Moderate. We believe that operators are hesitant to raise data
pricing aggressively due to concerns that adoption rates would be affected. Given that 4G
capex rollout is still at the inception stage (4G launch: Jan-Jul 2013), building economies of
scale would be the first priority to justify further capex spending. On top of that, competition
remains heightened, and smartphone penetration remains moderate (average: 41%),
particularly for the prepaid segment.
But Monetisation Efforts Are Creeping. To ease the cannibalisation of voice and SMS by data,
and to monetise the latter, operators have introduced bundled plans combining voice, SMS and
data. They include Maxis’ One Plan, Digi’s Smart Plan, Celcom’s First Basic Plan, and UMobile’s
Unlimited Postpaid. Maxis had also recently hiked prices for its SurfMore MI plans in efforts to
milk more money out of data. From 29 Jan 2015, the price of quota upgrades for Maxis’
SurfMore plans was increased to RM25 for 500MB and RM35 (previous: RM15) for 1GB.
Flushing Out WBB to Make Way for MI. In addition, to improve data yields, operators have
also embarked on the strategy of deliberately ‘expelling’ WBB users (Figure 6). To recap,
dongle (WBB) users consume significantly more data but yield less returns. Therefore, the shift
in focus to small screen MI will not only reduce data traffic congestion, but also result in
enhanced data experience for ballooning MI users (Figure 7). In turn, this will stimulate usage
for high yield MI users, and propel data monetisation efforts.
Page 2 of 4
TA Securities
6-Feb-15
A Member of the TA Group
Figure 6: WBB Subscribers
Figure 7: MI Subscribers
900
8,000
800
7,500
7,000
700
MI Subsribers ('000)
WBB Subsribers ('000)
1,000
600
500
400
300
200
6,500
6,000
5,500
5,000
4,500
4,000
100
3,500
0
2Q12
3Q12
4Q12
1Q13
2Q13
Maxis
3Q13
Celcom
4Q13
1Q14
2Q14
3,000
3Q14
2Q12
3Q12
4Q12
Digi
1Q13
Maxis
Source: Companies, TA Research
2Q13
3Q13
Celcom
4Q13
1Q14
2Q14
3Q14
Digi
Source: Companies, TA Research
But Moolah Not Flowing Yet. Nevertheless, we believe data monetisation efforts are still in
their early stages, and would likely require a longer time frame to bear significant fruits. We
opine that it is currently still a challenge to push up prices without causing adoption and usage
rates to plunge. In the longer run, once data users have reached critical mass, we believe
operators would be more willing to increase data pricing. This will likely be catalysed by
proliferation of low-end smartphones and tablets from Chinese manufacturers. In addition, in
future, we do not discount the possibility that consumers will be reliant on the internet similar
to our current dependence on voice services. This is on the back of a growing ecosystem of
content, services, applications, communication tools, etc. on the worldwide web. Evolution of
the internet to a basic staple necessity may render data pricing more elastic in future.
Neutral as Data Monetisation Needs Time. We estimate that for every RM1 increase in Data
ARPU, this would result in an increase of 5%/2%/0.5% to the bottomline of Digi/Maxis/Axiata
(Figure 8). In conclusion, we believe earnings expansion for mobile players will likely remain
subdued in the near-to-medium term until data monetisation plays out. Therefore, we
maintain our Neutral stance on the sector as we await for emerging signs of expanding data
yields. Our only Buy recommendation is on fixed player TM as we are upbeat on the
company’s long term earnings prospects given the following catalysts:- 1) major
beneficiary of High Speed Broadband Phase 2 (HSBB 2), and 2) emergence as converged
fixed-mobile player via P1.
Figure 8: Impact of RM1 Change in Data ARPU to Mobile Players
Impact to
Earnings
Digi
Maxis
Axiata*
5%
2%
0.5%
*Change to Celcom Axiata Data ARPU
Figure 9: Peer Comparison
Company
Axiata
Digi
Maxis
TM
Average
Call
Price (RM)
SELL
HOLD
SELL
BUY
7.17
6.49
7.07
7.00
Tgt.Price
Upside (%)
(RM)
7.16
6.76
6.78
8.32
(0.1)
4.2
(4.1)
18.9
PE (x)
CY14
25.4
26.2
28.8
31.7
28.0
PBV (x)
CY15
21.4
24.3
23.3
29.4
24.6
CY14
2.8
68.4
10.9
3.4
21.4
Page 3 of 4
CY15
2.7
64.7
10.9
3.3
20.4
DPS (sen)
CY14
21
24
40
26
28
CY15
25
26
30
26
27
ROE (%)
CY14
11.0
261.3
37.9
10.8
80.3
CY15
12.6
266.7
46.9
11.4
84.4
Dividend Yield (%)
CY14
3.0
3.7
5.7
3.7
4.0
CY15
3.5
3.9
4.5
3.1
3.8
TA Securities
6-Feb-15
A Member of the TA Group
( T HI S P AGE I S I NT E N T I ON AL L Y L E FT B L ANK)
Disclaimer
The information in this report has been obtained from sources believed to be reliable. Its accuracy or completeness is not guaranteed and
opinions are subject to change without notice. This report is for information only and not to be construed as a solicitation for contracts.
We accept no liability for any direct or indirect loss arising from the use of this document. We, our associates, directors, employees may
have an interest in the securities and/or companies mentioned herein.
for TA SECURITIES HOLDINGS BERHAD(14948-M)
(A Participating Organisation of Bursa Malaysia Securities Berhad)
Kaladher Govindan – Head of Research
Page 4 of 4
Friday, 06 February, 2015
For Internal Circulation Only
TA RESEARCH’S ‘DAILY COMPILED LOCAL TECHNICAL REPORTS’
Local Technical Reports
a. Daily Technical Stock Picks
b. Daily Money Flow
-
Technical Stock Picks
-
FBMKLCI
-
Stocks Under Coverage
-
PLANTATION Sector
-
CONSTRUCTION Sector
-
PROPERTY Sector
c. Daily Stock Screen
Disclaimer
The information in this report has been obtained from sources believed to be reliable. Its accuracy or completeness is not guaranteed and opinions are subject to change
without notice. This report is for information only and not to be construed as a solicitation for contracts. We accept no liability for any direct or indirect loss arising
from the use of this document. We, our associates, directors, employees may have an interest in the securities and/or companies mentioned herein.
for TA SECURITIES HOLDINGS BERHAD (14948-M)
MENARA TA ONE, 22 JALAN P. RAMLEE, 50250 KUALA LUMPUR, MALAYSIA TEL: +603-20721277 / FAX: +603-20325048
(A Participating Organisation of Bursa Malaysia Securities Berhad)
Kaladher Govindan – Head of Research
T e c h n i c a l
TA Securities
V i e w
Friday, February 06, 2015
A Member of the TA Group
MENARA TA ONE, 22 JALAN P. RAMLEE, 50250 KUALA LUMPUR, MALAYSIA TEL: +603-20721277 / FAX: +603-20325048
Daily Technical Stock Picks
Malaysia
FBMKLCI: 1,803.21 (+0.19, +0.01%)
THIS REPORT IS STRICTLY FOR INTERNAL CIRCULATION ONLY*
Chartist: Stephen Soo
Stock
Name
FBMKLCI
AIRASIA
AMBANK
AXIATA
CIMB
GAMUDA
GENTING
GENM
IOICORP
MAYBANK
RHBCAP
TENAGA
TM
UMWH
AIRASIA X
ALAM
ARMADA
AZRB
BENALEC
DIALOG
DRB-HICOM
GLOMAC
HIAPTEK
HUA YANG
MAH SING
MRCB
MUHIBBAH
PANTECH
PERDANA
PERISAI
SKPETRO
UEMS
WASEONG
WCT
Close
5-Feb
1803.21
2.78
6.29
7.17
5.74
5.14
8.85
4.16
4.75
8.92
8.14
14.54
7.00
10.88
0.65
0.67
1.20
0.70
0.88
1.63
1.85
0.99
0.58
2.15
1.99
1.33
2.00
0.75
1.16
0.49
2.77
1.30
1.33
1.59
Change
0.19
0.02
0.00
0.00
0.09
0.04
0.04
(0.01)
0.00
0.09
(0.12)
(0.10)
0.01
-0.10
0.02
(0.02)
(0.04)
0.00
(0.01)
(0.02)
0.05
0.00
(0.01)
(0.02)
0.09
(0.01)
0.02
0.01
(0.02)
(0.01)
(0.05)
0.01
0.01
0.02
Tel: +603-2167-9607
Bollinger Bands
Lower
Mid
Upper
1,804.25 1,796.41 1,706.98 1,765.39 1,823.80
High
Low
2.79
6.37
7.23
5.74
5.14
8.88
4.18
4.80
8.94
8.40
14.64
7.19
11.00
0.65
0.69
1.23
0.71
0.89
1.65
1.85
1.00
0.59
2.17
2.00
1.35
2.04
0.75
1.19
0.49
2.81
1.30
1.35
1.60
2.75
6.21
7.15
5.60
5.10
8.82
4.10
4.74
8.79
8.10
14.48
6.96
10.58
0.63
0.67
1.20
0.70
0.86
1.63
1.79
0.99
0.58
2.15
1.90
1.32
1.96
0.74
1.14
0.48
2.75
1.27
1.33
1.56
2.58
6.23
6.87
5.15
4.97
8.28
3.75
4.68
8.43
7.37
13.88
6.60
10.46
0.62
0.57
1.12
0.67
0.56
1.46
1.53
0.97
0.56
1.98
1.92
1.07
1.70
0.71
1.03
0.43
2.25
1.22
1.16
1.50
2.74
6.44
7.08
5.61
5.05
8.67
3.96
4.74
8.74
7.79
14.50
6.84
10.73
0.66
0.62
1.20
0.70
0.72
1.59
1.73
1.01
0.60
2.12
2.04
1.27
1.90
0.74
1.13
0.47
2.61
1.29
1.28
1.57
2.89
6.66
7.29
6.07
5.13
9.05
4.16
4.79
9.05
8.20
15.12
7.09
11.00
0.70
0.68
1.29
0.73
0.88
1.72
1.92
1.04
0.64
2.26
2.17
1.46
2.11
0.77
1.22
0.52
2.97
1.37
1.40
1.63
[email protected]
www.taonline.com.my
RSI
Moving Averages
14d
10d
30d
50d
62.44 1,792.01 1,760.58 1,759.83
DI +
40.95
DI 16.11
ADX
25.46
Diff
24.84
Line
13.05
MACD
Signal
8.75
Diff
4.305
DMI MACD
Recent Signal
BUY
BUY
DMI MACD
Signal Change
-
53.76
37.20
58.46
54.67
60.59
53.35
58.94
52.63
53.45
64.81
54.40
61.41
53.50
44.76
55.36
50.24
51.33
73.27
58.22
60.95
44.52
43.45
54.90
43.65
55.93
54.56
49.65
52.65
50.15
59.53
42.33
53.72
50.18
19.25
23.00
21.77
24.86
28.45
21.22
28.17
22.87
22.51
31.25
51.06
36.68
18.95
22.20
32.77
27.44
31.31
49.47
28.65
30.70
34.09
32.54
32.53
16.28
29.32
29.21
24.95
29.68
29.79
31.27
19.58
30.21
25.84
18.20
31.55
15.16
21.95
15.98
13.69
15.07
10.79
22.00
14.74
14.17
11.80
17.44
30.95
21.13
18.10
26.40
11.55
10.99
14.93
22.71
24.92
21.68
26.37
19.39
19.04
24.17
24.23
24.56
17.17
24.45
19.83
14.81
12.38
19.74
18.39
23.03
21.17
18.52
25.40
12.95
18.40
20.40
29.05
22.50
13.78
11.60
24.11
26.07
17.58
37.09
28.59
29.69
21.01
23.41
20.80
21.58
23.74
21.56
18.44
17.77
21.99
35.66
25.56
30.52
25.57
1.05
(8.55)
6.62
2.91
12.48
7.53
13.10
12.08
0.50
16.51
36.89
24.87
1.52
(8.75)
11.64
9.34
4.91
37.92
17.67
15.78
11.37
7.61
10.86
(10.09)
9.93
10.16
0.78
5.45
5.22
14.10
(4.87)
10.38
11.02
0.02
(0.03)
0.06
(0.00)
0.02
0.01
0.02
0.01
(0.02)
0.12
0.20
0.05
0.03
0.00
0.00
0.00
0.01
0.05
0.04
0.04
-0.01
0.00
0.03
-0.03
0.03
0.01
-0.01
0.01
0.00
0.00
-0.04
0.00
-0.01
0.02
(0.00)
0.05
(0.00)
0.01
(0.04)
(0.01)
0.01
(0.04)
0.06
0.23
0.02
-0.01
0.00
-0.01
-0.01
0.01
0.03
0.04
0.03
0.00
0.00
0.03
-0.02
0.02
0.00
-0.01
0.00
-0.01
-0.01
-0.05
-0.01
-0.02
0.001
(0.027)
0.009
0.004
0.008
0.048
0.034
(0.001)
0.021
0.057
(0.032)
0.027
0.035
(0.003)
0.011
0.011
(0.002)
0.020
(0.001)
0.011
(0.002)
(0.002)
0.001
(0.014)
0.009
0.013
0.003
0.007
0.007
0.007
0.009
0.012
0.008
BUY
SELL
BUY
BUY
BUY
BUY
BUY
BUY
BUY
BUY
BUY
BUY
BUY
SELL
BUY
BUY
BUY
BUY
BUY
BUY
BUY
BUY
BUY
SELL
BUY
BUY
BUY
BUY
BUY
BUY
SELL
BUY
BUY
BUY
-
2.77
6.46
7.17
5.60
5.07
8.79
4.02
4.74
8.84
7.91
14.72
6.94
10.83
0.67
0.65
1.22
0.71
0.79
1.64
1.81
1.00
0.60
2.17
2.01
1.33
1.97
0.74
1.16
0.49
2.77
1.31
1.33
1.58
2.75
6.47
7.06
5.58
5.04
8.73
3.98
4.74
8.84
7.69
14.28
6.85
10.79
0.66
0.63
1.18
0.69
0.68
1.56
1.72
1.00
0.59
2.09
2.06
1.25
1.90
0.75
1.12
0.47
2.52
1.35
1.27
1.57
2.73
6.45
7.01
5.58
5.03
8.86
4.03
4.70
8.90
7.70
14.10
6.85
10.81
0.66
0.65
1.16
0.68
0.67
1.50
1.69
1.01
0.60
2.07
2.06
1.27
1.93
0.77
1.13
0.50
2.53
1.46
1.36
1.61
DMI
BUY
SELL
BUY
BUY
BUY
BUY
BUY
SELL
BUY
BUY
SELL
BUY
BUY
SELL
BUY
BUY
SELL
BUY
SELL
BUY
SELL
SELL
BUY
SELL
BUY
BUY
BUY
BUY
BUY
BUY
BUY
BUY
BUY
BUY
SELL
-
The table above is a compilation of actively traded stocks with some popular technical indicators. The technical BUY/SELL signals on the last four columns are auto generated; the first two being
existing or recent signals while the last two represent a signal change from BUY to SELL or the reverse, otherwise no change is indicated by a dash.
INTERPRETATION OF TECHNICAL INDICATORS:
Bollinger Bands: Variable width bands that narrow during less volatile periods and widen during more volatile periods. As a general rule, in a bearish trend, traders should buy when
share price touches the lower band and exit when price touches the middle band. The reverse is true in a bullish trend, ie. Buy when price touches the middle band and sell when price
touches the upper band. Momentum traders tend to buy on price breakouts above the upper band, and sell when price breaks down below the lower band.
14-day Relative Strength Index (RSI): A reading below 30 is considered oversold, above 70 is overbought. A rise above 50 with a corresponding share price surge above the 30-day moving
average should be taken as a bullish move with good short-term upside potential. A fall below 50 and a simultaneous dip below the 30-day average is bearish and imply further near-term
downside risk.
Moving Averages: A stock’s short-term trend is bullish if share price stays above the 10-day moving average, and bearish if it stays below. The medium-term trend is positive if share
price stays above the 30-day average, and negative if it remains below. A longer-term uptrend is intact if share price sustain above the 50-day average, and is deemed broken if it breaches
below this level.
Directional Movement Indicator (DMI): The DMI is an indicator of trend strength. A positive DMI difference (DMI diff) value is bullish and indicate a higher DI+ vs. DI-, while a negative
DMI diff is bearish due to a lower DI+ vs. DI- (DMI diff = DI+ minus DI-). A crossover of DI+ above DI- triggers a BUY signal, while a SELL signal is flashed when the DI+ crosses below the
DI-. The Average Directional Movement Index (ADX) indicates the strength of a trend, whether it is up or down. The higher the value of ADX, the stronger the trend. An ADX value above
25 suggests a trending market or stock, while a value below 20 signal congestion or absence of trend.
Daily Moving Average Convergence Divergence (MACD): The MACD diff value is derived from the difference between the MACD line (the 12-day EMA minus the 26-day EMA) and the
MACD signal line (the 9-day EMA of the MACD). A positive MACD diff value is bullish, while a negative MACD diff is bearish. A BUY signal is generated when the MACD diff rises above
zero, and SELL signal sparked when the MACD diff value falls below zero.
Page 1 of 4
TA Securities
A Member of the TA Group
Technical Comments: Any share price weakness on AMMB below the lower Bollinger band (RM6.23) will be attractive to bargain for
rebound upside towards RM6.48 (76.4%FR), with tougher hurdles from the upper band (RM6.66) and the 61.8%FR (RM6.79) capping
near-term upside. Crucial support is from the 15/12/14 low of RM5.97. A daily stochastics and MACD buy signal on CIMB improves
upside potential towards RM6.08 (38.2%FR), while a confirmed breakout will target RM6.40 (50%FR) ahead. Crucial chart supports
are at the lower Bollinger band (RM5.15) and 12/1/15 low (RM5.05).
AMMB
Upper
Middle
RM6.29 (UNCH)
BOLLINGER BANDS
RM
RM
6.66
6.44
10-day
30-day
RM
6.23
50-day
Lower
DMI
Recent Signal
SELL
6.45
Recent Signal
SELL
Signal Change
CIMB
Recent Signal
Signal Change
RM
DAILY MACD
Signal Change
Upper
Middle
Lower
SIMPLE MOVING AVERAGES
RM 6.46
RM 6.47
BOLLINGER BANDS
RM
RM
RM
DMI
RM5.74 (+0.09)
6.07
5.61
5.15
BUY
SIMPLE MOVING AVERAGES
RM 5.59
RM 5.58
RM 5.58
DAILY MACD
Recent Signal
BUY
Signal Change
BUY
10-day
30-day
50-day
Page 2 of 4
TA Securities
A Member of the TA Group
Daily Money Flow of Technical Stock Picks
Malaysia
THIS REPORT IS STRICTLY FOR INTERNAL CIRCULATION ONLY*
Chartist: Stephen Soo
No
1
2
3
4
5
6
7
8
9
10
11
12
13
14
15
16
17
18
19
20
21
22
23
24
25
26
27
28
29
30
33
31
32
Name
Tel: +603-2167-9607
Total Money Flow (RM'mn)
[email protected]
(A)
Total
5D MF Prv. Chg
www.taonline.com.my
(B)
Cur. Chg
CLOSING PRICE
28-Jan
29-Jan
30-Jan
4-Feb
5-Feb
Chg
(A+B)
DMF
28-Jan
29-Jan
30-Jan
4-Feb
5-Feb
FBMKLCI
16.4
15.6
(47.4)
2.9
5.1
(7.4)
50.2
2.3
1,796
1,782
1,781
1,803
1,803
0.19
IN
AIRASIA
AMBANK
AXIATA
CIMB
GAMUDA
GENTING
GENM
IOICORP
MAYBANK
RHBCAP
TENAGA
TM
UMWH
AIRASIA X
ALAM
ARMADA
AZRB
BENALEC
DIALOG
DRB-HICOM
GLOMAC
HIAPTEK
HUA YANG
MAH SING
MRCB
MUHIBBAH
PANTECH
PERDANA
PERISAI
SKPETRO
UEMS
WASEONG
WCTHG
0.2
(1.2)
(0.8)
1.9
(1.9)
(0.1)
(1.5)
(0.5)
(3.5)
1.0
18.8
(2.1)
(5.5)
(0.0)
0.1
0.1
0.0
0.1
(1.1)
(0.1)
(0.0)
0.0
0.0
0.0
0.1
(0.1)
(0.0)
(0.1)
(0.3)
0.8
0.2
(0.0)
(0.1)
(0.1)
(1.6)
(2.4)
4.6
(0.4)
2.6
(1.7)
0.4
5.8
(0.1)
0.7
(0.3)
(0.2)
0.1
0.2
(0.4)
(0.0)
(0.4)
0.9
0.0
0.1
(0.0)
(0.0)
0.1
0.1
(0.3)
0.0
(0.1)
(0.1)
0.0
(0.0)
0.0
0.0
0.1
(1.8)
(3.4)
(6.2)
2.7
(0.9)
(3.4)
(0.6)
(6.6)
1.6
0.1
0.5
(0.3)
0.1
0.1
(0.2)
(0.0)
0.1
0.3
0.0
0.0
0.0
0.0
(0.0)
0.1
(0.1)
0.0
0.1
(0.1)
(1.0)
0.1
0.0
0.0
0.8
(1.7)
1.9
(1.4)
0.3
1.8
3.1
0.0
4.7
1.0
(3.8)
1.9
2.6
(0.1)
0.2
(0.1)
(0.0)
(0.3)
(0.9)
(0.3)
0.0
0.0
0.0
0.4
(0.0)
(0.4)
0.1
(0.0)
(0.4)
(2.4)
(0.1)
(0.1)
(0.1)
(0.1)
(7.9)
(0.8)
(1.7)
(1.1)
(0.5)
0.9
(0.5)
2.5
0.5
(2.6)
0.8
(0.4)
(0.1)
(0.2)
0.4
(0.0)
(0.2)
(0.1)
0.3
0.0
(0.0)
(0.0)
0.1
0.2
1.2
0.0
(0.1)
0.2
(0.1)
0.0
0.0
(0.1)
0.9
(14.1)
(5.6)
(2.9)
(0.4)
2.9
(2.6)
(1.1)
2.9
4.0
13.4
0.9
(3.8)
0.0
0.4
(0.2)
(0.0)
(0.6)
(1.0)
(0.0)
0.1
0.0
0.0
0.6
0.6
0.4
0.2
(0.2)
(0.6)
(2.6)
0.2
(0.0)
(0.2)
0.8
0.1
5.3
4.8
(2.4)
2.6
6.5
0.6
11.3
(0.6)
(3.9)
1.5
2.9
(0.2)
0.0
0.1
0.0
(0.4)
(1.3)
(0.3)
0.0
0.0
0.0
0.4
(0.2)
(0.3)
0.1
(0.1)
(0.4)
(1.4)
(0.2)
(0.1)
(0.1)
(1.0)
(6.2)
(2.7)
(0.3)
(1.4)
(2.2)
(2.2)
(0.5)
(2.1)
(0.5)
1.2
(1.1)
(3.0)
0.0
(0.3)
0.4
(0.0)
0.1
0.8
0.6
(0.0)
(0.0)
(0.0)
(0.3)
0.2
1.6
(0.1)
(0.1)
0.6
2.2
0.1
0.1
(0.0)
2.77
6.57
7.14
5.56
5.07
8.83
4.10
4.80
8.69
7.81
14.80
7.01
10.84
0.67
0.64
1.24
0.72
0.81
1.67
1.80
1.00
0.60
2.17
1.99
1.30
1.94
0.73
1.16
0.49
2.80
1.27
1.33
1.56
2.75
6.30
7.22
5.50
5.06
8.94
3.96
4.74
8.66
7.85
14.56
7.00
10.80
0.66
0.63
1.22
0.71
0.79
1.63
1.80
1.00
0.59
2.13
1.95
1.32
1.89
0.72
1.14
0.47
2.75
1.27
1.30
1.57
2.80
6.28
7.20
5.50
5.07
8.83
4.06
4.71
8.72
8.16
14.50
6.99
10.90
0.66
0.64
1.20
0.71
0.84
1.62
1.79
0.99
0.59
2.15
1.91
1.35
1.90
0.73
1.14
0.48
2.67
1.27
1.30
1.60
2.76
6.29
7.17
5.65
5.10
8.81
4.17
4.75
8.83
8.26
14.64
6.99
10.98
0.63
0.69
1.24
0.70
0.88
1.65
1.80
0.99
0.59
2.17
1.90
1.34
1.98
0.75
1.18
0.50
2.82
1.29
1.32
1.57
2.78
6.29
7.17
5.74
5.14
8.85
4.16
4.75
8.92
8.14
14.54
7.00
10.88
0.65
0.67
1.20
0.70
0.88
1.63
1.85
0.99
0.58
2.15
1.99
1.33
2.00
0.75
1.16
0.49
2.77
1.30
1.33
1.59
0.02
0.00
0.00
0.09
0.04
0.04
(0.01)
0.00
0.09
(0.12)
(0.10)
0.01
(0.10)
0.02
(0.02)
(0.04)
0.00
(0.01)
(0.02)
0.05
0.00
(0.01)
(0.02)
0.09
(0.01)
0.02
0.01
(0.02)
(0.01)
(0.05)
0.01
0.01
0.02
OUT
OUT
IN
IN
OUT
IN
IN
IN
IN
OUT
OUT
IN
OUT
OUT
OUT
IN
OUT
OUT
OUT
IN
OUT
OUT
OUT
IN
IN
IN
OUT
OUT
IN
IN
OUT
OUT
OUT
Sources: Bloomberg, TA Securities
Daily Money Flow (DMF) Formulation
If previous change (A) + current change (B) > 0, then DMF = “IN”; AND if (A) + (B) < 0, then DMF = “OUT”.
Money Flow (MF) Calculation
The value of money flow is set to zero at the start of the trading day. When a trade is performed, its price is compared to the price of the previous trade (the first
trade of the day is compared to the previous day's close). If the prices differ, the money associated with the trade (price times number of shares) is added to or
subtracted from the money flow. Additions (inflows, buys) are done on upticks; subtractions (outflows, sells) are done on downticks.
Daily Money Flow (DMF) Interpretation
In general, money flow trends confirm price trends. As prices rise, money flows are usually positive. As prices fall, money flows are usually negative. A divergence,
however, between money flow and price trend can be a signal of a future price trend change. For example, a falling stock price with a positive money flow (IN)
can indicate a future rally in the price of the stock. Conversely, a rising stock price with a negative money flow (OUT) implies potential correction in the
stock price.
Page 3 of 4
TA Securities
A Member of the TA Group
Daily Money Flow of FBMKLCI
Malaysia
THIS REPORT IS STRICTLY FOR INTERNAL CIRCULATION ONLY*
Chartist: Stephen Soo
Tel: +603-2167-9607
[email protected]
www.taonline.com.my
\
No
Name
FBMKLCI
1 AMBANK
2 ASTRO
3 AXIATA
4 BAT
5 CIMB
6 DIGI
7 FGV
8 GENTING
9 GENM
10 HLBANK
11 HLFG
12 IHH
13 IOICORP
14 KLK
15 MAYBANK
16 MAXIS
17 MISC
18 PCHEM
19 PETDAG
20 PETGAS
21 PPB
22 PBBANK
23 RHBCAP
24 SKPETRO
25 SIME
26 TM
27 TENAGA
28 KLCC
29 UMW
30 YTLCORP
28-Jan
16.4
(1.2)
0.3
(0.8)
(0.1)
1.9
(0.3)
1.0
(0.1)
(1.5)
0.1
0.2
0.2
(0.5)
(0.7)
(3.5)
2.9
(0.2)
(0.7)
0.3
1.7
0.2
5.9
1.0
0.8
(1.5)
(2.1)
18.8
(0.1)
(5.5)
(0.2)
Total Money Flow (RM'mn)
29-Jan
30-Jan
4-Feb
15.6
(47.4)
2.9
(1.6)
(1.8)
(1.7)
(0.0)
(0.9)
(7.3)
(2.4)
(3.4)
1.9
3.4
(0.3)
(9.0)
4.6
(6.2)
(1.4)
(4.0)
(9.4)
2.7
0.3
(1.0)
0.8
2.6
(0.9)
1.8
(1.7)
(3.4)
3.1
(0.3)
(0.4)
(0.0)
(0.1)
(0.1)
0.1
(0.5)
(0.9)
1.4
0.4
(0.6)
0.0
0.3
(0.6)
0.9
5.8
(6.6)
4.7
(0.2)
(1.1)
(1.3)
0.8
(2.2)
(0.7)
(0.4)
(0.2)
(1.0)
0.1
(0.1)
1.1
1.2
6.3
0.1
0.2
(0.1)
0.2
(10.5)
6.4
7.8
(0.1)
1.6
1.0
(1.0)
(2.4)
0.0
0.0
(2.7)
0.4
(0.3)
0.5
1.9
(3.8)
0.7
0.1
(0.0)
(0.1)
0.2
(0.2)
(0.3)
2.6
(0.8)
(1.2)
0.4
5-Feb
5.1
(7.9)
2.9
(0.8)
1.5
(1.7)
0.3
(0.1)
(0.5)
0.9
(0.0)
0.4
0.3
(0.5)
3.4
2.5
0.8
0.0
0.1
(0.5)
(0.8)
0.1
2.0
0.5
(0.1)
3.5
0.8
(2.6)
1.2
(0.4)
(0.1)
Total
5D MF
(7.4)
(14.1)
(4.9)
(5.6)
(4.6)
(2.9)
(10.8)
1.1
2.9
(2.6)
(0.7)
0.4
0.5
(1.1)
3.4
2.9
1.1
(2.4)
(2.1)
0.8
8.5
0.5
11.6
4.0
(2.6)
(0.2)
0.9
13.4
1.2
(3.8)
(1.9)
(A)
Prv. Chg
50.2
0.1
(6.4)
5.3
(8.7)
4.8
12.1
1.8
2.6
6.5
0.4
0.3
2.3
0.6
1.5
11.3
(0.2)
1.5
(0.8)
1.1
(6.2)
0.3
16.9
(0.6)
(1.4)
3.1
1.5
(3.9)
0.3
2.9
1.5
(B)
Cur. Chg
2.3
(6.2)
10.2
(2.7)
10.5
(0.3)
(2.4)
(0.9)
(2.2)
(2.2)
0.0
0.2
(1.1)
(0.5)
2.5
(2.1)
2.1
0.8
1.0
(1.6)
(0.9)
(0.1)
(4.5)
(0.5)
2.2
3.1
(1.1)
1.2
1.0
(3.0)
(0.5)
28-Jan
1,796
6.57
2.94
7.14
66.50
5.56
6.44
2.51
8.83
4.10
14.20
17.16
5.23
4.80
23.00
8.69
7.13
7.80
5.32
17.60
22.22
15.02
18.14
7.81
2.80
9.55
7.01
14.80
6.90
10.84
1.71
29-Jan
1,782
6.30
2.94
7.22
66.50
5.50
6.41
2.44
8.94
3.96
14.00
16.50
5.20
4.74
23.02
8.66
7.10
7.62
5.13
17.72
22.20
14.90
18.08
7.85
2.75
9.40
7.00
14.56
6.90
10.80
1.76
CLOSING PRICE
30-Jan
4-Feb
1,781
1,803
6.28
6.29
2.92
2.96
7.20
7.17
66.00
67.50
5.50
5.65
6.41
6.49
2.44
2.40
8.83
8.81
4.06
4.17
14.02
14.28
16.92
16.90
5.20
5.30
4.71
4.75
22.66
22.90
8.72
8.83
7.10
7.15
7.75
7.75
5.10
5.30
17.64
17.98
22.20
22.48
14.56
14.80
18.14
18.36
8.16
8.26
2.67
2.82
9.40
9.55
6.99
6.99
14.50
14.64
6.90
7.05
10.90
10.98
1.76
1.74
5-Feb
1,803
6.29
2.98
7.17
68.00
5.74
6.49
2.35
8.85
4.16
14.26
16.90
5.24
4.75
23.00
8.92
7.07
7.70
5.29
18.06
22.44
14.80
18.44
8.14
2.77
9.54
7.00
14.54
6.92
10.88
1.74
Chg
0.19
0.00
0.02
0.00
0.50
0.09
0.00
(0.05)
0.04
(0.01)
(0.02)
0.00
(0.06)
0.00
0.10
0.09
(0.08)
(0.05)
(0.01)
0.08
(0.04)
0.00
0.08
(0.12)
(0.05)
(0.01)
0.01
(0.10)
(0.13)
(0.10)
0.00
(A+B)
DMF
IN
OUT
IN
IN
IN
IN
IN
IN
IN
IN
IN
IN
IN
IN
IN
IN
IN
IN
IN
OUT
OUT
IN
IN
OUT
IN
IN
IN
OUT
IN
OUT
IN
(RM'mn)
INFLOW
35.2
28.0
8.5
31.5
21.1
124.3
OUTFLOW
(18.9)
16.4
(12.4)
15.6
(55.9)
(47.4)
(28.6)
2.9
(15.9)
5.1
(131.7)
(7.4)
14
(16)
14
(16)
4
(26)
20
(10)
17
(13)
NET FLOW
Daily Trading Participation
COMPANIES
INFLOW
OUTFLOW
Date
Retail
Institution
Foreign
Total
28-Jan
29-Jan
30-Jan
4-Feb
5-Feb
21.0%
19.3%
18.1%
21.5%
16.1%
50.4%
52.0%
48.4%
40.4%
49.5%
28.6%
28.7%
33.5%
38.1%
34.4%
100%
100%
100%
100%
100%
Sources: Bloomberg, TA Securities
Daily Money Flow (DMF) Formulation
If previous change (A) + current change (B) > 0, then DMF = “IN”; AND if (A) + (B) < 0, then DMF = “OUT”.
Money Flow (MF) Calculation
The value of money flow is set to zero at the start of the trading day. When a trade is performed, its price is compared to the price of the previous trade (the first
trade of the day is compared to the previous day's close). If the prices differ, the money associated with the trade (price times number of shares) is added to or
subtracted from the money flow. Additions (inflows, buys) are done on upticks; subtractions (outflows, sells) are done on downticks.
Daily Money Flow (DMF) Interpretation
In general, money flow trends confirm price trends. As prices rise, money flows are usually positive. As prices fall, money flows are usually negative. A divergence,
however, between money flow and price trend can be a signal of a future price trend change. For example, a falling stock price with a positive money flow (IN)
can indicate a future rally in the price of the stock. Conversely, a rising stock price with a negative money flow (OUT) implies potential correction in the
stock price.
Disclaimer
The information in this report has been obtained from sources believed to be reliable. Its accuracy or completeness is not guaranteed and opinions are subject to
change without notice. This report is for information only and not to be construed as a solicitation for contracts. We accept no liability for any direct or indirect
loss arising from the use of this document. We, our associates, directors, employees may have an interest in the securities and/or companies mentioned herein.
for TA SECURITIES HOLDINGS BERHAD (14948-M)
MENARA TA ONE, 22 JALAN P. RAMLEE, 50250 KUALA LUMPUR, MALAYSIA TEL: +603-20721277 / FAX: +603-20325048
(A Participating Organisation of Bursa Malaysia Securities Berhad)
Kaladher Govindan – Head of Research
Page 4 of 4
T e c h n i c a l
TA Securities
V i e w
Friday, February 06, 2015
A Member of the TA Group
MENARA TA ONE, 22 JALAN P. RAMLEE, 50250 KUALA LUMPUR, MALAYSIA TEL: +603-20721277 / FAX: +603-20325048
Daily Money Flow of Stocks Under Coverage low of Stocks Under C
Malaysia
FBMKLCI: 1,803.21 (+0.19, +0.01%)
THIS REPORT IS STRICTLY FOR INTERNAL CIRCULATION ONLY*
Chartist: Stephen Soo
Name
FBM KLCI
28-Jan
0.9
MAYBANK
PBANK
RHBCAP
BURSA
CONSTRUCTION
BPURI
GAMUDA
IJM
NAIM
SENDAI
TRC
WCT
LITRAK
CONSUMER
Brewery
CARLSBG
GUINESS
Retail
AEON
AMWAY
F&N
NESTLE
PARKSON
QL
Tobacco
BAT
GAMING
Casino
GENTING
GENM
NFO
BJTOTO
HEALTHCARE
Hospital
IHH
KPJ
RUBBER GLOVES
HARTA
KOSSAN
SUPERMX
TOPGLOV
KAREX
INDUSTRIAL
SCIENTX
SKPRES
UNIMECH
MEDIA
MEDIA PRIMA
STAR
Total Money Flow (RM' mn)
29-Jan
30-Jan
4-Feb
[email protected]
5-Feb
Total
5D MF
(A)
Prv. Chg
(B)
Cur. Chg
15.6
(47.4)
2.9
5.1
(22.8)
50.2
2.3
(0.0)
(0.0)
(0.2)
0.0
0.0
(0.3)
0.0
(0.0)
2.6
(0.0)
0.0
(0.4)
(0.0)
(0.1)
1.4
0.0
(0.0)
2.9
(0.5)
(0.1)
(1.0)
(3.0)
0.2
(0.3)
(0.1)
0.0
(1.6)
4.6
(0.3)
5.8
(0.8)
0.0
(1.8)
(6.2)
(0.4)
(6.6)
(0.3)
0.1
(1.7)
(1.4)
(0.0)
4.7
0.6
0.0
(7.9)
(1.7)
(0.0)
(1.1)
0.1
(13.9)
(7.8)
(0.6)
(5.4)
(1.6)
0.1
7.8
(0.1)
(0.7)
(10.5)
1.6
(4.0)
6.4
1.0
0.3
2.5
2.0
0.5
0.1
0.1
(0.0)
(0.1)
(0.0)
2.3
(1.0)
(0.1)
(0.1)
0.0
(0.4)
2.8
0.1
(0.0)
0.0
2.7
(11.2)
(0.0)
(0.0)
(0.0)
0.3
(2.3)
0.1
(0.0)
(0.0)
(0.3)
0.0
0.0
0.0
0.0
0.0
(0.0)
0.2
0.1
(0.0)
(0.1)
0.0
0.2
(0.4)
28-Jan
29-Jan
www.taonline.com.my
CLOSING PRICE
30-Jan
4-Feb
5-Feb
Chg
1,782.2
1,781.3
1,803.0
1,803.2
(0.0)
0.0
(3.0)
0.78
3.24
10.88
0.77
3.15
10.80
0.79
3.16
10.90
0.79
3.14
10.98
0.76
3.18
10.88
(0.03) OUT
0.04 OUT
(0.10) OUT
0.5
0.1
0.1
4.8
0.4
0.9
(0.1)
(6.2)
(0.3)
0.0
11.3
16.9
(0.6)
4.3
(2.1)
(4.5)
(0.5)
(0.3)
4.78
2.85
6.30
5.50
14.00
8.66
4.78
2.87
6.28
5.50
14.02
8.72
4.75
2.87
6.29
5.65
14.28
8.83
4.78
2.87
6.29
5.74
14.26
6.1
0.2
1.4
(4.2)
4.79
2.89
6.60
5.54
14.40
8.92
18.12
7.81
8.19
18.08
7.85
8.21
18.14
8.16
8.20
18.36
8.26
8.08
0.03
IN
0.00
IN
0.00 OUT
0.09
IN
(0.02) IN
0.09
IN
0.08
IN
(0.12) OUT
0.11
IN
(0.0)
(1.1)
(1.3)
(0.0)
(0.0)
0.0
3.8
(13.0)
0.1
(0.2)
0.0
(2.4)
8.9
0.1
0.0
0.0
(1.4)
1.0
(0.1)
0.0
0.62
0.61
0.60
0.59
(0.0)
(0.4)
0.0
(0.0)
(0.1)
(0.0)
(0.0)
(0.0)
0.0
5.06
6.84
2.98
0.61
0.41
5.07
6.90
3.00
0.61
0.41
5.10
6.89
3.04
0.60
0.41
(0.1)
0.0
(0.0)
(0.1)
0.0
5.04
6.80
3.01
0.61
0.42
1.59
3.80
1.57
3.80
1.60
3.80
1.57
3.80
0.0
(0.1)
(0.1)
0.0
0.0
(0.0)
(0.1)
0.1
0.1
(0.0)
11.78
12.12
11.78
12.08
11.78
12.22
0.16
0.1
11.66
12.16
11.94
0.0
12.20
(0.02)
0.1
0.0
0.3
1.0
0.0
(0.0)
0.1
(0.0)
(0.0)
0.1
0.5
0.3
0.0
0.1
0.1
0.0
0.1
1.2
(0.1)
0.1
0.4
0.0
0.0
(0.4)
0.0
(0.0)
0.0
0.1
0.1
0.2
(0.1)
(0.0)
(0.1)
3.01
10.98
18.86
72.40
0.0
0.0
0.3
0.1
0.1
2.99
10.98
18.52
71.50
0.00
0.00
0.08
1.1
0.2
0.4
3.00
10.96
18.50
71.54
3.01
10.98
18.94
0.2
0.1
0.1
3.04
10.78
18.52
71.40
2.48
3.49
2.49
3.46
2.48
3.50
2.47
3.51
73.30
2.47
3.60
0.90
0.00
0.09
(0.2)
3.4
(0.3)
(9.0)
1.5
(4.7)
(8.7)
10.5
66.50
66.50
66.00
67.50
68.00
0.50
IN
0.5
(0.1)
2.6
(1.7)
(0.9)
(3.4)
1.8
3.1
(0.5)
0.9
3.5
(1.2)
2.6
6.5
(2.2)
(2.2)
8.84
3.93
8.94
3.96
8.83
4.06
8.81
4.17
8.85
4.16
0.04
(0.01)
IN
IN
0.1
(0.3)
(0.5)
0.0
0.0
(0.7)
0.5
0.0
3.50
3.40
3.39
3.37
3.40
0.03
IN
0.4
(0.5)
(0.5)
(0.1)
(0.9)
0.1
1.4
(0.1)
0.3
(0.1)
0.7
(0.6)
2.3
(0.2)
(1.1)
(0.0)
4.77
3.88
4.77
4.00
4.77
3.93
4.77
3.94
4.77
3.96
0.00
0.02
IN
OUT
8.92
18.44
8.14
8.19
0.58
5.14
6.92
3.06
0.61
0.40
1.59
3.80
0.19
(A+B)
DMF
1,803.2
AUTOMOBILE
EPMB
0.0
MBMR
(0.1)
UMW
(0.3)
BANKS & FINANCIAL SERVICES
AFG
AFFIN
AMBANK
CIMB
HLBANK
Tel: +603-2167 9607
IN
(0.01) IN
0.04 OUT
0.03
IN
0.02 OUT
0.01
IN
(0.01) OUT
0.02 OUT
0.00 OUT
OUT
IN
OUT
IN
IN
IN
IN
OUT
0.0
0.1
(0.0)
(0.1)
0.0
0.5
0.1
(0.0)
0.0
7.51
5.29
2.20
4.97
3.94
5.18
2.24
4.98
3.90
5.22
2.25
4.98
4.00
5.18
2.23
4.89
4.07
7.51
5.18
2.20
4.84
4.07
0.00
0.00
(0.03)
(0.05)
0.00
OUT
(0.1)
(0.2)
0.0
0.1
(0.1)
(0.7)
(0.3)
0.1
(0.0)
7.59
0.6
0.1
(0.1)
0.1
(0.1)
0.2
(0.3)
(0.2)
0.1
7.59
0.3
(0.1)
(0.1)
(0.1)
(0.1)
0.4
(0.2)
0.0
0.1
7.40
(0.9)
0.1
0.1
(0.1)
(0.1)
(0.1)
(0.1)
0.0
(0.1)
(0.1)
(0.1)
(0.1)
0.9
0.1
0.1
0.1
(0.3)
0.1
(0.3)
(0.4)
(0.2)
0.5
0.2
0.2
(0.8)
(0.4)
(0.0)
(0.1)
6.74
0.76
1.58
6.58
0.77
1.58
6.63
0.78
1.57
6.57
0.76
1.57
6.61
0.77
1.57
0.04
0.01
0.00
OUT
IN
OUT
(0.1)
(0.1)
0.9
0.1
(0.4)
(0.1)
1.89
0.0
(0.8)
0.0
1.87
0.0
0.5
(0.0)
1.88
(0.0)
(0.3)
(0.0)
1.85
(0.0)
2.52
2.52
2.55
2.55
1.89
2.53
0.00 OUT
(0.02) OUT
Page 1 of 2
OUT
OUT
IN
OUT
TA Securities
A Member of the TA Group
Name
OIL & GAS
ICON
MHB
PANTECH
28-Jan
Total Money Flow (RM' mn)
29-Jan
30-Jan
4-Feb
5-Feb
Total
5D MF
(A)
Prv. Chg
(B)
Cur. Chg
(0.1)
(0.1)
0.0
(0.3)
(0.4)
0.2
(0.2)
(0.1)
0.1
0.2
0.1
(0.1)
0.1
0.2
(0.1)
0.1
(1.6)
(0.3)
0.5
1.2
(0.8)
(0.4)
(1.4)
(1.4)
1.0
0.6
2.2
0.1
(0.0)
(0.1)
0.1
1.4
(0.1)
1.8
0.0
(0.9)
(0.0)
(0.5)
3.4
(0.0)
3.5
0.0
0.3
0.8
3.6
(0.0)
1.6
(0.1)
(0.1)
0.6
1.5
(0.0)
3.1
0.0
(0.1)
(0.5)
2.5
0.0
3.1
0.0
0.0
0.1
(0.0)
0.7
0.7
0.8
(0.3)
(0.0)
0.0
0.0
0.2
0.4
0.0
(0.7)
(0.0)
(0.1)
0.0
(0.1)
(0.0)
4.0
(0.0)
(0.2)
0.0
(0.4)
(0.1)
0.0
0.0
0.0
0.0
(0.2)
(0.1)
(1.0)
(0.2)
(0.1)
0.1
(1.0)
(0.4)
(2.4)
(0.3)
(0.0)
1.4
0.0
0.1
1.3
0.0
1.4
(0.5)
(0.1)
0.3
0.0
0.4
0.3
0.1
(1.0)
0.2
(0.6)
(0.6)
(0.0)
0.8
0.1
0.0
0.9
0.0
0.3
(0.0)
0.0
0.0
(0.0)
0.0
(2.7)
(0.0)
(0.0)
0.4
(0.0)
(0.0)
0.0
(0.0)
(0.0)
0.1
(0.0)
0.1
0.0
0.0
0.0
0.0
0.0
0.0
0.2
0.1
(0.1)
(0.4)
0.1
0.7
0.0
0.3
(0.0)
(0.0)
0.3
0.5
0.4
0.0
(0.4)
0.0
0.0
(0.0)
0.3
0.1
(0.0)
(0.1)
(0.1)
(0.5)
0.0
(0.0)
(0.3)
(0.1)
(0.1)
(0.2)
(0.0)
(0.1)
(0.5)
(0.8)
0.5
(1.3)
(1.3)
YTLPOWR
(0.1)
TELECOMMUNICATIONS
AXIATA
1.8
DIGI
8.3
MAXIS
(1.4)
TM
(3.3)
TECHNOLOGY
0.1
1.2
0.7
(0.1)
(0.1)
6.3
0.1
(0.5)
1.1
0.1
(3.8)
(0.6)
(0.5)
(0.8)
(2.6)
(2.4)
(4.0)
(3.4)
(9.4)
1.9
2.7
(0.2)
(0.3)
(1.1)
0.5
0.1
(0.0)
(0.0)
PCHEM
PERISAI
SKPETRO
UMWOG
PLANTATIONS
BSTEAD
FGV
IJMPLANT
IOICORP
KLK
KWANTAS
SIME
UMCCA
PROPERTY
CRESNDO
GLOMAC
HUAYANG
IOIPG
MAHSING
SPSETIA
SUNWAY
REIT
SUNREIT
CMMT
POWER & UTILITIES
PETDAG
PETGAS
TENAGA
Semiconductor & Electronics
IRIS
(0.0)
MPI
(0.0)
UNISEM
(0.6)
TRANSPORTATION
Airlines
AIRASIA
0.1
AIRPORT
0.2
Freight & Tankers
MISC
WSPRT
Name
(1.1)
0.7
28-Jan
29-Jan
CLOSING PRICE
30-Jan
4-Feb
(1.36)
1.49
0.73
5.55
0.50
2.80
1.26
1.52
0.72
5.13
0.47
2.75
(0.40)
1.57
0.73
5.10
0.48
2.67
(6.00)
1.59
0.75
5.30
0.50
2.82
2.70
2.73
2.70
2.66
4.68
2.40
3.68
4.77
22.82
4.59
2.44
3.48
4.74
23.02
4.65
2.44
3.50
4.71
22.66
4.60
2.40
3.50
4.75
22.90
1.99
9.53
6.39
1.99
9.40
6.38
1.99
9.40
6.35
1.95
9.55
6.37
0.0
(0.0)
(0.0)
(0.2)
(0.3)
(0.0)
0.2
2.40
1.00
2.19
2.43
1.00
2.13
2.42
0.99
2.15
2.44
0.99
2.17
2.19
2.04
3.55
3.36
2.08
1.95
3.55
3.26
2.06
1.91
3.52
3.33
0.2
(0.1)
0.1
0.0
1.58
1.59
1.56
1.51
1.0
5.5
(6.7)
1.1
(6.2)
(3.9)
(1.6)
(0.9)
1.2
(0.3)
(1.5)
(0.2)
0.4
17.62
22.34
15.00
1.64
(1.3)
1.9
(0.8)
0.3
0.8
0.8
(2.9)
(2.2)
(3.2)
(0.4)
5.3
12.1
(0.2)
1.5
(2.7)
(2.4)
2.1
(1.1)
(0.1)
(0.0)
(0.3)
(0.1)
(0.1)
(0.1)
(0.1)
0.1
(1.0)
(0.2)
(0.1)
(2.0)
0.0
(0.1)
0.2
(0.1)
4.9
0.1
(0.1)
0.8
(0.3)
(0.1)
0.1
0.8
4.6
0.8
(0.3)
(2.2)
(0.2)
(0.7)
(2.3)
0.0
1.8
5-Feb
Total Money Flow (S$' mn)
29-Jan
30-Jan
4-Feb
5-Feb
0.80
1.53
0.75
5.29
0.49
2.77
2.69
4.60
2.35
3.50
4.75
23.00
1.95
9.54
6.37
1.60
1.42
1.56
1.43
(0.04) IN
0.01 OUT
17.72
22.20
14.56
1.61
17.64
22.20
14.50
1.60
17.98
22.48
14.64
1.60
18.06
22.44
14.54
1.57
0.08 OUT
(0.04) OUT
(0.10) OUT
(0.03) IN
7.20
6.39
7.22
6.41
7.20
6.41
7.17
6.49
7.10
7.00
7.10
6.99
7.15
6.99
0.00
0.00
(0.08)
0.01
IN
IN
7.16
7.02
7.17
6.49
7.07
7.00
(0.0)
0.2
(0.9)
0.33
5.76
1.98
0.34
5.79
2.05
0.34
5.79
2.03
0.34
5.69
2.03
0.34
5.74
2.10
0.00
0.05
0.07
OUT
IN
OUT
0.8
(0.2)
(1.0)
0.4
2.77
7.18
2.75
7.23
2.80
7.16
2.76
7.16
2.78
7.16
0.02
0.00
OUT
IN
(3.3)
(0.3)
1.5
(2.2)
0.8
4.1
7.81
3.52
7.62
3.50
7.75
3.50
7.75
3.50
7.70
3.50
(0.05)
0.00
IN
IN
Total
5D MF
(A)
Prv. Chg
(B)
Cur. Chg
28-Jan
29-Jan
CLOSING PRICE
30-Jan
4-Feb
3,412.2
3,419.1
3,408.0
3,417.6
5-Feb
3,406.6
(0.90)
(1.99)
(1.19)
(1.07)
(0.78)
1.05
1.19
1.01
0.0
5.1
(1.1)
1.1
(0.38)
(0.90)
(1.17)
0.02
6.31
(0.11)
1.16
(0.4)
0.0
0.0
0.0
(2.9)
0.1
(0.1)
(0.0)
0.4
0.0
(0.16)
(0.03)
(1.99)
0.01
(0.34)
0.04
(0.40)
0.02
0.02
0.02
(0.9)
(1.2)
(2.0)
0.0
(0.3)
0.0
0.00 OUT
(0.05) IN
0.00 OUT
0.00
IN
0.10
IN
0.00 OUT
(0.01) IN
0.00
IN
1.55
1.44
2.0
(0.0)
1.2
1.2
1.0
6.80 OUT
(0.06) OUT
0.01 OUT
(0.01) IN
(0.01) IN
(0.05) IN
0.03 OUT
2.09
1.90
3.59
3.31
4.6
(1.1)
(1.3)
(0.8)
1.1
(A+B)
DMF
0.05
0.00
(0.02)
(0.01)
0.09
0.01
0.02
6.3
(0.1)
1.2
(1.2)
(1.1)
Chg
2.49
0.99
2.15
2.08
1.99
3.60
3.33
FSSTI
BANKS & FINANCIAL SERVICES
DBS
(0.9)
OCBC
(2.0)
UOB
(0.4)
PLANTATIONS
WILMAR
(0.2)
IFAR
(0.0)
28-Jan
Chg
OUT
OUT
OUT
IN
IN
OUT
OUT
IN
IN
(A+B)
DMF
(10.99)
5.12
IN
(1.12) OUT
1.14
IN
0.42
0.00
IN
OUT
Sources: Bloomberg, TA Securities
Daily Money Flow (DMF) Formulation
If previous change (A) + current change (B) > 0, then DMF = “IN”; AND if (A) + (B) < 0, then DMF = “OUT”.
Money Flow (MF) Calculation
The value of money flow is set to zero at the start of the trading day. When a trade is performed, its price is compared to the price of the previous trade (the first trade
of the day is compared to the previous day's close). If the prices differ, the money associated with the trade (price times number of shares) is added to or subtracted
from the money flow. Additions (inflows, buys) are done on upticks; subtractions (outflows, sells) are done on downticks.
Daily Money Flow (DMF) Interpretation
In general, money flow trends confirm price trends. As prices rise, money flows are usually positive. As prices fall, money flows are usually negative. A divergence,
however, between money flow and price trend can be a signal of a future price trend change. For example, a falling stock price with a positive money flow (IN) can
indicate a future rally in the price of the stock. Conversely, a rising stock price with a negative money flow (OUT) implies potential correction in the stock
price.
Page 2 of 2
Technical View
TA Securities
Friday, February 06, 2015
A Member of the TA Group
MENARA TA ONE, 22 JALAN P. RAMLEE, 50250 KUALA LUMPUR, MALAYSIA TEL: +603-20721277 / FAX: +603-20325048
Daily Money Flow of the Plantation Sector
Malaysia
THIS REPORT IS STRICTLY FOR INTERNAL CIRCULATION ONLY*
Chartist: Stephen Soo
Tel: +603-2167 9607
www.taonline.com.my
(B)
29-Jan
30-Jan
4-Jan
5-Jan
Total
5D MF
(A)
28-Jan
Prv. Chg
Cur. Chg
KL PLANT
2.5
1.9
(2.0)
1.6
2.5
6.5
3.6
0.9
BKAWAN
(0.0)
(0.0)
0.0
0.0
0.0
0.0
0.0
0.0
(0.0)
0.0
0.0
(0.0)
0.0
(0.0)
0.0
0.0
0.0
(0.0)
0.0
(0.0)
0.0
0.0
(0.0)
0.0
0.0
0.1
0.1
(0.1)
0.0
(0.1)
0.0
1.4
0.0
1.8
0.0
(0.9)
2.40
2.44
2.44
2.40
8.20
2.35
(0.2)
0.0
(0.0)
(0.2)
(0.1)
10.48
10.40
10.16
10.30
10.42
0.1
0.0
0.0
(0.1)
0.0
0.0
1.05
0.89
1.05
1.00
1.05
1.18
1.07
1.20
1.07
1.22
Name
BLDPLNT
CEPAT
Total Money Flow (RM' mn)
[email protected]
(0.0)
(0.0)
0.0
0.0
CHINTEK
(0.0)
(0.0)
0.0
0.0
DUTALND
(0.0)
0.0
(0.0)
0.0
0.0
0.0
0.1
0.0
FAREAST
FGV
1.3
0.3
(1.0)
0.8
GENP
0.2
0.1
0.1
(0.1)
GLBHD
GOPENG
0.0
(0.0)
0.0
(0.0)
0.0
0.1
0.0
(0.0)
HSPLANT
0.0
0.0
(0.0)
(0.0)
HARNLEN
0.0
(0.0)
0.0
0.0
IJMPLNT
INCKEN
0.0
0.0
0.0
0.0
0.2
(0.0)
0.1
(0.0)
IOICORP
1.4
0.4
(0.6)
0.0
0.0
(0.5)
KMLOONG
(0.0)
0.0
(0.0)
0.0
0.0
0.0
0.0
0.0
0.0
0.0
0.0
(0.0)
0.0
0.0
KLK
(0.5)
0.3
(0.6)
0.9
(0.0)
3.4
KULIM
(0.2)
0.0
0.3
0.0
0.2
0.0
(0.1)
(0.0)
0.0
(0.0)
(0.0)
0.0
NSOP
0.0
0.0
0.0
0.0
NPC
0.0
0.0
0.0
0.0
0.0
0.0
0.0
0.0
0.0
0.0
0.0
0.0
RSAWIT
(0.0)
(0.0)
0.0
(0.0)
RVIEW
SOP
0.2
(0.0)
0.2
(0.0)
0.0
(0.0)
0.0
(0.1)
KLUANG
KRETAM
KWANTAS
MHC
PINEPAC
PLS
SWKPLNT
0.0
0.0
(0.0)
0.0
SBAGAN
(0.0)
(0.0)
0.0
(0.0)
TDM
THPLANT
(0.0)
0.0
0.4
0.0
(0.3)
0.0
(0.0)
0.0
TWSPLNT
0.0
0.0
0.0
0.0
TSH
0.0
0.0
(0.0)
(0.0)
CLOSING PRICE
28-Jan
29-Jan
30-Jan
4-Jan
5-Jan
7,995.2
7,990.8
7,941.5
7,974.2
7,980.3
18.10
7.90
18.28
8.00
18.28
8.00
18.32
8.00
18.34
0.83
0.82
0.82
0.82
9.25
9.25
9.25
9.25
9.25
0.53
8.20
0.51
8.20
0.51
8.20
0.52
8.20
0.52
8.00
0.82
0.0
2.57
2.59
2.55
2.54
2.54
1.08
1.06
1.08
1.08
1.06
0.3
0.0
(0.1)
(0.0)
(0.1)
0.0
3.68
0.73
3.48
0.73
3.50
0.74
3.50
0.73
3.50
0.74
(0.02) OUT
0.00 OUT
0.01 IN
0.00
0.8
0.6
(0.5)
4.77
4.74
4.71
4.75
4.75
0.1
(0.0)
0.0
0.0
0.0
0.0
(0.0)
2.73
3.32
2.76
3.32
2.76
3.32
2.78
0.0
0.0
2.72
3.32
0.49
0.46
0.47
0.47
3.32
0.46
3.6
22.82
23.02
22.66
22.90
23.00
0.0
(0.0)
0.0
0.0
0.0
3.03
1.99
3.03
1.99
3.03
1.95
3.01
(0.0)
(0.0)
3.03
1.99
0.99
1.00
0.99
1.00
(0.0)
0.0
0.0
0.0
(0.0)
5.10
5.10
0.00
0.00
4.91
0.0
0.0
0.0
0.0
0.0
0.0
0.0
(0.0)
0.0
2.75
0.32
0.00
0.32
0.00
0.34
0.00
0.0
0.0
2.75
0.33
0.00
1.02
1.02
1.02
0.32
1.02
(0.0)
(0.0)
(0.0)
(0.0)
(0.0)
0.55
0.56
0.56
0.57
0.56
0.4
(0.1)
0.0
(0.1)
(0.0)
0.1
4.00
5.60
4.05
5.61
4.05
5.60
4.05
5.42
3.90
5.46
2.21
(0.0)
0.0
(0.0)
0.0
(0.0)
0.0
(0.1)
0.0
(0.0)
(0.0)
(0.0)
(0.0)
UTDPLT
0.0
(0.1)
0.0
0.0
0.0
(0.1)
0.00 IN
0.02 OUT
0.00 IN
(0.0)
2.5
0.1
0.0
0.00 IN
0.00 OUT
(0.05) IN
0.12 OUT
0.0
1.5
UNICO
UMCCA
0.02 OUT
0.00 OUT
(0.01) OUT
0.00 IN
(0.0)
(0.2)
0.0
0.0
IN
0.0
0.2
(0.0)
(0.0)
6.07
(A+B)
DMF
(0.0)
(0.0)
(0.0)
0.0
0.0
(0.0)
Chg
1.95
1.00
0.0
0.0
(0.0)
2.18
2.22
2.18
2.25
(0.1)
(0.0)
0.0
3.29
3.13
3.19
3.16
3.16
(0.1)
0.0
0.3
(0.0)
0.0
0.0
0.81
1.61
0.78
1.60
0.79
1.60
0.82
1.60
0.84
1.60
0.00
0.0
0.0
0.0
0.00
0.00
0.00
0.00
0.0
(0.0)
(0.1)
0.0
(0.1)
0.0
0.0
0.0
0.0
2.25
0.00
2.25
0.00
2.25
0.00
2.26
0.00
(0.1)
0.0
(0.1)
Sources: Bloomberg, TA Securities
Page 1 of 4
2.25
6.39
6.38
6.35
6.37
0.00
6.37
24.40
24.42
24.42
24.32
24.90
IN
0.02 OUT
0.00 OUT
(0.01) OUT
0.10 IN
(0.02) OUT
0.00 OUT
0.00 IN
4.91 OUT
0.00 OUT
(0.03) OUT
0.00 OUT
(0.00) OUT
(0.15) OUT
0.04 IN
(0.04) OUT
0.00 OUT
0.02 IN
0.00 OUT
0.00 OUT
(0.01) OUT
0.00 OUT
0.00 IN
0.58 OUT
TA Securities
A Member of the TA Group
Daily Money Flow of the Construction Sector
Malaysia
THIS REPORT IS STRICTLY FOR INTERNAL CIRCULATION ONLY*
Chartist: Stephen Soo
Name
28-Jan
Tel: +603-2167 9607
Total Money Flow (RM' mn)
29-Jan
30-Jan
4-Jan
[email protected]
5-Jan
Total
5D MF
(A)
Prv. Chg
(B)
Cur. Chg
28-Jan
29-Jan
www.taonline.com.my
CLOSING PRICE
30-Jan
4-Jan
5-Jan
Chg
KL CONSTR
1.7
1.3
(8.7)
(2.4)
(1.5)
(9.5)
6.3
0.9
289.0
289.1
291.0
292.4
293.9
1.52
AZRB
ARK
BENALEC
BDB
BGYEAR
BPURI
BREM
CRESBLD
DKLS
EKOVEST
SENDAI
(0.0)
0.0
0.2
(0.0)
0.0
0.1
(0.1)
(0.0)
0.0
0.0
(0.1)
0.0
(0.0)
0.0
(0.4)
0.0
0.0
(0.0)
(0.0)
(0.0)
(0.0)
(0.1)
(0.0)
(0.0)
(0.0)
0.0
0.1
(0.0)
0.0
(0.1)
0.0
(0.0)
(0.0)
0.0
(0.0)
(0.1)
(0.0)
0.0
(0.3)
(0.0)
0.0
(0.0)
0.0
(0.0)
0.0
(0.0)
(0.0)
0.0
(0.0)
0.0
(0.2)
0.0
0.0
(0.0)
(0.0)
(0.0)
(0.0)
0.0
(0.0)
(0.0)
0.0
(0.5)
0.0
0.0
0.0
(0.1)
(0.1)
(0.0)
(0.0)
(0.2)
0.0
0.0
(0.4)
(0.0)
0.0
0.0
0.0
0.0
0.0
(0.0)
0.0
(0.0)
0.0
0.1
0.0
0.0
0.0
(0.0)
0.0
(0.0)
0.0
0.0
0.0
(0.0)
(0.1)
(0.4)
0.0
(0.0)
2.8
0.0
(0.0)
0.0
0.0
0.0
0.0
0.1
0.0
(0.0)
0.0
2.7
0.1
0.0
(11.2)
(0.0)
(0.1)
0.0
0.0
(0.0)
0.0
0.1
(0.0)
0.0
(0.0)
0.3
(0.1)
(0.1)
(2.3)
0.0
0.0
0.0
0.0
0.1
0.0
(0.0)
(0.0)
0.0
(0.0)
(0.0)
(1.4)
0.1
0.1
1.0
(0.0)
(0.0)
(0.0)
(0.0)
(0.1)
0.0
0.70
0.00
0.88
0.73
0.00
0.59
1.04
1.19
1.82
1.15
0.60
0.45
(0.0)
(0.0)
(0.0)
2.3
0.2
(0.0)
(1.0)
(0.0)
0.1
(0.0)
(0.0)
0.0
0.0
0.2
0.1
(0.0)
0.0
(0.0)
(2.4)
(0.1)
(0.1)
8.9
0.0
0.1
(0.0)
0.0
0.1
0.0
0.71
0.00
0.84
0.73
0.00
0.60
1.03
1.20
1.77
1.14
0.61
0.44
0.00
0.00
(0.01)
(0.01)
0.00
(0.01)
0.00
0.01
(0.04)
0.00
0.01
(0.1)
(0.0)
(0.0)
(0.1)
3.8
0.2
(0.1)
(13.0)
(0.0)
(0.0)
0.0
0.0
0.0
0.0
0.71
0.00
0.79
0.72
0.00
0.61
1.03
1.18
1.80
1.14
0.61
0.44
0.70
0.00
0.88
0.72
0.00
0.58
1.04
1.20
1.78
1.15
0.61
0.0
0.0
0.0
(0.0)
(1.1)
0.0
(0.0)
(1.3)
(0.0)
(0.0)
0.0
(0.0)
(0.0)
0.0
0.72
0.00
0.78
0.73
0.00
0.62
1.03
1.22
1.82
1.15
0.61
0.44
(0.0)
(0.0)
(0.2)
0.0
0.1
(0.4)
(0.0)
0.2
0.0
(0.0)
0.3
(0.0)
(0.0)
(0.0)
0.2
0.0
0.0
0.1
(0.0)
(0.1)
1.6
0.0
(0.3)
(0.0)
(0.0)
(0.5)
0.0
(0.0)
1.10
1.23
1.52
5.10
1.40
1.69
6.89
0.63
0.54
1.32
1.07
0.46
0.00
1.34
0.0
0.0
(0.2)
(0.0)
0.0
(0.1)
0.1
(0.1)
0.0
0.0
(0.0)
0.0
(0.0)
0.0
(0.2)
(0.0)
(0.0)
0.1
0.0
0.1
(0.3)
(0.1)
0.3
(0.0)
(0.0)
0.3
(0.0)
(0.0)
1.12
1.23
1.53
5.07
1.40
1.69
6.90
0.62
0.51
1.30
1.07
0.43
0.00
1.35
(0.0)
0.0
(0.1)
0.0
(0.0)
(0.3)
(0.1)
0.0
(0.0)
(0.0)
(0.1)
(0.0)
0.0
(0.0)
0.7
(0.0)
0.0
(0.5)
0.0
0.2
0.6
(0.0)
0.1
0.0
(0.0)
0.0
(0.0)
(0.0)
1.10
1.24
1.52
5.06
1.40
1.70
6.84
0.63
0.51
1.29
1.07
0.43
0.00
1.32
(0.0)
0.0
0.0
0.0
0.1
0.1
0.0
(0.0)
0.0
0.0
(0.0)
(0.0)
0.0
0.0
0.2
0.0
0.0
(0.1)
(0.0)
(0.1)
1.2
(0.0)
(0.0)
0.0
(0.0)
(0.2)
0.0
(0.0)
1.10
1.26
1.51
5.04
1.42
1.74
6.80
0.63
0.53
1.32
1.07
0.44
0.00
1.29
(0.0)
(0.1)
(0.0)
(0.0)
(0.0)
0.0
(0.0)
0.3
(0.0)
1.05
0.33
1.25
0.34
1.67
1.98
0.89
4.42
1.74
0.17
1.59
0.38
0.41
1.11
0.0
0.0
(0.0)
(0.0)
(0.0)
(0.0)
(0.1)
0.0
0.0
1.06
0.35
1.20
0.33
1.62
1.90
0.86
4.47
1.74
0.16
1.55
0.38
0.41
1.11
0.0
0.0
(0.0)
(0.0)
(0.0)
(0.0)
(0.4)
0.2
(0.1)
1.09
0.35
1.16
0.34
1.62
1.89
0.84
4.40
1.72
0.16
1.54
0.37
0.41
1.12
(0.0)
(0.3)
(0.0)
(0.0)
(0.0)
(0.0)
(0.1)
0.3
(0.0)
1.09
0.35
1.10
0.32
1.60
1.95
0.84
4.39
1.79
0.16
1.52
0.38
0.42
1.20
0.85
1.59
0.90
0.32
0.87
1.57
0.91
0.34
0.87
1.60
0.91
0.35
0.86
1.57
0.88
0.34
FAJAR
FUTUTEC
GBGAQRS
GADANG
GAMUDA
HOHUP
HSL
IJM
IREKA
JAKS
KIMLUN
KEURO
JETSON
LEBTECH
MRCB
MELATI
MERGE
MITRA
MTDACPI
MUDAJYA
MUHIBAH
PESONA
PTARAS
PLB
PSIPTEK
PRTASCO
SYCAL
TRC
TRIPLC
TSRCAP
WCT
ZECON
ZELAN
Sources: Bloomberg, TA Securities
Page 2 of 4
(A+B)
DMF
IN
0.45
1.15
1.23
1.48
5.14
1.39
1.68
6.92
0.64
0.53
1.32
1.06
0.46
0.00
OUT
OUT
OUT
IN
OUT
IN
OUT
IN
OUT
IN
IN
0.00 IN
0.05 OUT
0.00 IN
(0.04) OUT
0.04 OUT
(0.01) OUT
(0.01) OUT
0.03 IN
0.01 IN
(0.01) IN
0.00 OUT
(0.01) OUT
0.00 OUT
0.00 OUT
1.33
1.04
0.33
1.24
0.33
1.74
2.00
0.93
4.27
1.71
0.16
1.72
0.38
0.40
(0.01)
(0.01)
0.00
(0.01)
(0.02)
0.07
0.02
0.04
(0.15)
(0.03)
(0.01)
0.13
0.00
(0.01)
1.08
0.94
1.59
0.89
0.34
IN
OUT
OUT
IN
OUT
OUT
IN
OUT
IN
OUT
OUT
OUT
IN
OUT
(0.03) OUT
0.08 OUT
0.02 OUT
0.01 IN
0.00 IN
TA Securities
A Member of the TA Group
Daily Money Flow of the Property Sector
Malaysia
THIS REPORT IS STRICTLY FOR INTERNAL CIRCULATION ONLY*
Chartist: Stephen Soo
Tel: +603-2167 9607
www.taonline.com.my
(B)
29-Jan
30-Jan
4-Jan
5-Jan
Total
5D MF
(A)
28-Jan
Prv. Chg
Cur. Chg
KL PROP
(0.2)
0.8
0.5
0.7
(0.2)
1.6
0.2
(0.9)
1,312.7
1,297.3
1,294.4
1,304.8
1,306.5
A&M
(0.0)
0.0
0.0
0.0
(0.0)
(0.0)
0.0
(0.0)
0.86
0.86
0.89
0.88
0.86
AMPROP
ASAS
0.0
0.0
0.0
0.0
0.0
0.0
(0.0)
0.0
0.0
0.0
0.0
0.0
(0.0)
0.0
0.0
0.0
0.82
0.00
0.81
0.00
0.81
0.00
0.79
0.00
0.80
0.00
ASIAPAC
BCB
0.0
(0.0)
0.1
(0.0)
(0.0)
0.0
0.0
0.0
(0.0)
(0.0)
0.0
(0.0)
0.0
0.0
(0.0)
(0.0)
0.24
0.99
0.23
0.99
0.23
0.98
0.23
0.98
0.24
0.97
BJASSET
BERTAM
CHHB
(0.0)
0.0
(0.0)
0.0
(0.0)
(0.0)
(0.0)
(0.0)
0.83
0.78
(0.0)
0.1
(0.0)
(0.0)
0.0
0.85
0.78
0.0
(0.0)
0.0
0.0
(0.0)
0.84
0.73
0.0
(0.1)
(0.0)
(0.0)
(0.0)
0.84
0.72
0.0
0.0
(0.0)
(0.0)
(0.0)
0.0
0.0
(0.1)
0.0
1.23
2.64
0.1
(0.0)
0.1
(0.0)
1.22
2.57
(0.0)
0.0
(0.0)
0.0
1.23
2.55
(0.0)
(0.0)
(0.0)
0.0
1.22
2.85
0.82
0.78
1.16
0.01 OUT
(0.01) OUT
(0.01) OUT
0.00 OUT
(0.07) OUT
(0.0)
0.0
0.0
0.0
(0.0)
0.0
(0.0)
0.0
2.44
2.61
(0.0)
0.0
0.0
(0.0)
2.42
2.57
0.00
0.05
0.0
(0.0)
2.43
2.58
2.64
2.49
(0.0)
(0.0)
2.40
2.60
1.00
0.00
ENCORP
EUPE
0.2
0.0
(0.0)
0.0
(0.1)
1.00
0.00
0.5
(0.0)
0.0
0.0
(0.3)
0.98
0.00
0.1
0.0
0.0
0.0
0.4
1.00
0.00
(0.5)
0.0
0.0
0.0
0.2
0.0
0.0
(0.0)
0.0
0.0
(0.0)
0.0
0.0
2.07
1.25
0.80
2.22
1.25
0.78
2.29
1.24
0.78
2.37
1.30
0.80
FARLIM
FOCAL
0.0
0.0
0.0
0.0
0.0
0.0
(0.0)
0.0
0.0
0.0
0.0
0.0
(0.0)
0.0
0.0
0.0
0.54
0.00
0.52
0.00
0.53
0.00
0.52
0.00
0.53
0.00
0.00
IN
(0.01) OUT
0.01 OUT
0.00 OUT
GOB
GLOMAC
0.1
0.0
0.1
0.1
0.0
0.0
0.0
0.0
0.0
0.0
0.2
0.1
(0.0)
0.0
0.0
(0.0)
0.54
1.00
0.53
1.00
0.54
0.99
0.53
0.99
0.54
0.99
0.01
0.00
OUT
OUT
GPLUS
HOOVER
0.0
(0.0)
0.0
(0.0)
0.0
0.0
0.0
0.0
0.0
0.0
0.0
(0.0)
0.0
0.0
0.0
0.0
0.00
0.53
0.00
0.53
0.00
0.00
0.00
0.00
0.00
0.00
0.00
0.00
OUT
OUT
GMUTUAL
GUOCO
(0.0)
0.0
(0.0)
(0.0)
(0.0)
0.0
0.0
0.0
0.0
(0.0)
(0.0)
0.0
0.0
0.0
0.0
(0.0)
0.40
1.32
0.39
1.32
0.39
1.29
0.39
1.29
0.40
1.28
HUAYANG
HUNZPTY
(0.0)
(0.0)
(0.0)
0.0
0.0
0.0
0.0
0.0
(0.0)
0.0
(0.0)
(0.0)
0.0
0.0
(0.0)
0.0
2.19
1.87
2.13
1.88
2.15
1.88
2.17
1.88
2.15
1.88
0.01
IN
(0.01) OUT
(0.02) OUT
0.00
IN
IBHD
IBRACO
0.0
0.0
(0.0)
0.0
(0.0)
0.0
0.0
0.0
0.0
(0.0)
(0.0)
0.0
0.1
(0.0)
(0.0)
(0.0)
0.63
1.70
0.62
1.69
0.62
1.77
0.61
1.70
0.61
1.70
0.00
0.00
IGB
IJMLAND
(0.0)
(0.0)
(0.0)
(0.1)
0.0
0.0
0.0
0.4
(0.0)
0.1
(0.0)
0.4
0.0
0.4
(0.0)
(0.4)
2.63
3.54
2.64
3.55
2.64
3.57
2.67
3.57
2.71
3.55
IVORY
KBUNAI
(0.0)
0.0
(0.0)
0.0
0.0
0.0
(0.0)
0.0
0.0
0.0
(0.0)
0.0
(0.0)
0.0
0.0
0.0
0.44
0.07
0.43
0.07
0.42
0.07
0.43
0.07
0.43
0.07
0.04 OUT
(0.02) IN
(0.01) IN
0.00
IN
KELADI
KEN
(0.0)
(0.0)
(0.0)
(0.0)
0.0
0.0
(0.0)
0.0
(0.0)
(0.0)
(0.0)
(0.0)
(0.0)
0.0
0.0
(0.0)
0.29
0.94
0.30
0.93
0.30
0.94
0.30
0.94
0.30
0.92
KLCCP
KASSETS
0.0
0.0
0.0
0.0
0.0
0.0
0.0
0.0
0.0
0.0
0.0
0.0
0.0
0.0
0.0
0.0
0.00
0.00
0.00
0.00
0.00
0.00
0.00
0.00
0.00
0.00
0.01 OUT
(0.02) OUT
0.00 OUT
0.00 OUT
KSL
KHSB
L&G
0.3
0.0
(0.0)
0.0
(0.1)
0.0
(0.3)
0.0
2.03
0.00
(0.1)
0.0
(0.0)
(0.0)
(0.0)
(0.1)
0.53
1.37
(0.0)
(0.0)
(0.0)
0.1
0.53
1.35
(0.0)
0.0
0.0
(0.2)
0.54
1.35
0.01
0.00
0.02
(0.0)
(0.1)
0.54
1.36
2.04
0.00
0.55
IN
OUT
0.0
(0.0)
0.3
0.0
0.1
2.01
0.00
(0.0)
0.0
(0.2)
0.0
0.1
2.07
0.00
0.0
0.0
(0.2)
0.0
0.2
2.06
0.00
0.0
0.0
(0.1)
0.0
0.1
1.55
0.33
0.0
0.4
0.0
(0.0)
1.54
0.33
(0.0)
(0.0)
(0.0)
0.1
1.55
0.32
(0.0)
0.1
0.0
(0.0)
1.57
0.33
(0.1)
0.2
0.0
0.0
(0.0)
(0.0)
0.0
(0.2)
(0.0)
(0.1)
(0.0)
0.0
0.33
0.25
0.85
0.34
0.26
0.84
0.32
0.25
0.84
0.33
0.28
0.85
0.09
0.00
MPCORP
MALTON
0.0
0.0
(0.1)
1.99
0.33
IN
0.0
0.0
0.0
(0.3)
0.0
0.94
1.90
0.0
(0.0)
0.0
0.4
0.0
0.93
1.91
(0.0)
0.0
(0.1)
0.7
0.0
0.94
1.95
0.33
0.94
0.1
0.0
0.92
2.04
IN
(0.05) OUT
0.00
IN
0.00
IN
0.00
IN
MEDAINC
MENANG
0.0
(0.0)
0.0
0.0
(0.0)
(0.0)
0.0
0.0
0.0
0.0
0.0
(0.0)
0.0
0.0
0.0
0.0
0.58
0.75
0.58
0.72
0.57
0.73
0.57
0.74
0.58
0.75
MKLAND
MKH
(0.2)
0.1
(0.0)
0.0
0.0
(0.1)
0.0
(0.0)
(0.1)
(0.0)
(0.3)
0.1
0.0
0.1
(0.1)
0.0
0.43
2.86
0.43
2.85
0.43
2.73
0.45
2.81
0.47
2.78
MUIPROP
MULPHAL
0.0
(0.0)
0.0
0.0
0.0
(0.0)
(0.0)
0.0
0.0
0.0
0.0
(0.0)
(0.0)
0.0
0.0
0.0
0.40
0.40
0.40
0.41
0.39
0.40
0.38
0.41
0.38
0.42
0.02 OUT
(0.03) IN
0.01
IN
0.02
IN
NADAYU
NAIM
0.0
(0.1)
0.0
0.1
0.0
(0.0)
0.0
0.1
0.0
(0.0)
0.0
0.1
0.0
0.1
0.0
(0.1)
0.00
3.01
0.00
2.98
0.00
3.00
0.00
3.04
0.00
3.06
0.00
0.02
OIB
OSKPROP
(0.0)
0.0
0.0
0.0
0.0
(0.0)
0.0
0.0
0.0
(0.0)
(0.0)
0.0
0.0
0.0
0.0
(0.0)
2.28
1.84
2.28
1.84
2.28
1.84
2.28
1.88
2.28
1.86
PMIND
PARAMON
0.0
0.0
0.0
0.0
0.0
0.0
0.0
0.0
0.0
0.0
0.0
0.0
0.0
0.0
0.0
(0.0)
0.00
1.48
0.00
1.47
0.00
1.45
0.00
1.47
0.00
1.47
0.00 OUT
(0.02) OUT
0.00 OUT
0.00 OUT
PASDEC
0.1
(0.0)
(0.0)
(0.0)
0.0
0.0
(0.0)
0.0
0.47
0.46
0.47
0.47
0.47
0.00
Name
CVIEW
CRESNDO
DAIMAN
DBHD
DIJACOR
E&O
LBICAP
LBS
LIENHOE
MAGNA
MAHSING
MJPERAK
Total Money Flow (RM' mn)
[email protected]
Sources: Bloomberg, TA Securities
Page 3 of 4
CLOSING PRICE
28-Jan
29-Jan
30-Jan
4-Jan
5-Jan
2.59
0.97
0.00
2.31
1.30
0.79
1.32
1.55
0.27
0.84
Chg
1.73
(A+B)
DMF
OUT
(0.02) OUT
0.01
IN
0.00 OUT
OUT
OUT
(0.02) OUT
(0.04) OUT
0.00 OUT
(0.06) OUT
IN
OUT
IN
(0.02) OUT
(0.01) OUT
0.01
IN
0.02
IN
OUT
OUT
IN
TA Securities
A Member of the TA Group
Name
28-Jan
Total Money Flow (RM' mn)
29-Jan
30-Jan
4-Jan
5-Jan
Total
5D MF
(A)
Prv. Chg
(B)
Cur. Chg
28-Jan
29-Jan
CLOSING PRICE
30-Jan
4-Jan
5-Jan
Chg
(A+B)
DMF
PRDUREN
0.0
(0.0)
0.0
(0.0)
(0.0)
(0.0)
(0.0)
(0.0)
1.63
1.63
1.63
1.63
1.63
0.00 OUT
PTGTIN
0.0
(0.0)
(0.0)
0.0
(0.0)
(0.0)
0.0
(0.0)
0.0
0.0
(0.2)
(0.0)
(0.1)
0.25
1.46
0.25
1.47
0.24
1.50
0.00
(0.1)
0.26
1.49
0.24
PJDEV
0.0
(0.0)
PLENITU
(0.0)
0.0
0.0
0.0
(0.0)
0.0
(0.0)
(0.0)
2.35
2.27
2.28
2.30
2.33
SAPRES
SBCCORP
0.0
(0.0)
(0.0)
(0.0)
0.92
(0.0)
0.0
0.0
0.93
(0.0)
(0.0)
(0.0)
0.93
(0.0)
0.0
(0.0)
0.94
(0.0)
(0.0)
0.0
1.03
0.99
0.99
0.99
0.92
1.01
SDRED
0.0
(0.0)
0.0
0.0
(0.0)
0.0
0.0
(0.1)
1.03
1.06
1.07
1.07
1.05
SPB
0.0
(0.0)
(0.0)
0.0
(0.0)
(0.0)
0.0
(0.0)
5.80
5.78
5.61
5.61
5.61
0.00
SNTORIA
(0.0)
0.0
(0.1)
0.0
(0.0)
(0.0)
(0.0)
(0.1)
0.0
0.0
(0.0)
(0.0)
0.0
1.17
3.02
1.14
3.04
1.13
3.07
0.01
0.0
1.19
3.02
1.14
SHL
(0.0)
(0.0)
SMI
(0.0)
(0.0)
0.0
0.0
0.0
(0.0)
0.0
0.0
0.16
0.16
0.16
0.16
0.15
SPSETIA
0.1
0.7
(0.0)
0.0
(0.0)
0.8
0.0
(0.0)
3.55
3.55
3.52
3.59
3.60
SUNWAY
SYMLIFE
(0.1)
0.0
0.3
(0.4)
3.31
0.0
0.2
(0.0)
3.33
0.0
(0.7)
(0.0)
3.26
(0.0)
(0.3)
0.0
3.36
0.0
(0.1)
(0.0)
0.86
0.84
0.84
0.84
3.33
0.85
TAGB
0.0
(0.0)
(0.0)
0.1
(0.0)
0.1
0.1
(0.1)
0.34
0.33
0.33
0.33
0.32
0.01 OUT
0.02 OUT
0.01 OUT
(0.01) IN
TAHPS
0.0
0.0
(0.0)
0.0
(0.0)
(0.0)
0.0
(0.0)
6.80
6.80
6.70
6.65
6.50
(0.15)
IN
TAMBUN
0.0
0.0
(0.0)
(0.0)
0.0
(0.0)
0.0
0.1
0.0
0.0
(0.0)
(0.0)
0.0
1.89
0.15
1.86
0.15
1.90
0.15
0.01
0.0
1.99
0.16
1.91
TANCO
0.1
0.0
0.14
(0.00)
IN
IN
TEBRAU
0.0
0.0
0.0
0.0
0.0
0.0
0.0
0.0
0.00
0.00
0.00
0.00
0.00
TRINITY
UEMLAND
0.0
0.0
0.0
0.0
0.00
0.0
0.0
0.0
0.00
0.0
0.0
0.0
0.00
0.0
0.0
0.0
0.00
0.0
0.0
0.0
0.00
0.00
0.00
0.00
0.00
0.00
0.00 OUT
0.00 OUT
0.00 OUT
UOADEV
(0.1)
0.1
0.1
0.1
0.0
0.1
0.0
(0.1)
2.10
2.11
2.10
2.10
2.11
WINGTM
(0.0)
(0.0)
0.0
0.0
(0.0)
(0.0)
0.0
(0.0)
1.71
1.71
1.70
1.75
1.71
Y&G
0.0
(0.1)
0.0
0.0
0.0
(0.0)
0.0
0.1
0.0
0.0
0.0
0.0
(0.0)
0.0
0.1
(0.1)
1.00
1.97
0.85
1.98
0.76
1.93
0.76
1.97
0.76
YNHPROP
YTLLAND
(0.0)
(0.0)
(0.0)
0.0
0.0
(0.0)
0.0
(0.0)
0.84
0.82
0.82
0.83
0.83
1.49
3.02
1.95
IN
(0.01) OUT
0.03 OUT
0.00 OUT
0.02 IN
(0.02) OUT
IN
IN
(0.05) OUT
(0.01) OUT
0.01 OUT
(0.04) OUT
0.00 OUT
(0.02) OUT
0.00 IN
Sources: Bloomberg, TA Securities
Daily Money Flow (DMF) Formulation
If previous change (A) + current change (B) > 0, then DMF = “IN”; AND if (A) + (B) < 0, then DMF = “OUT”.
Money Flow (MF) Calculation
The value of money flow is set to zero at the start of the trading day. When a trade is performed, its price is compared to the price of the previous trade (the first
trade of the day is compared to the previous day's close). If the prices differ, the money associated with the trade (price times number of shares) is added to or
subtracted from the money flow. Additions (inflows, buys) are done on upticks; subtractions (outflows, sells) are done on downticks.
Daily Money Flow (DMF) Interpretation
In general, money flow trends confirm price trends. As prices rise, money flows are usually positive. As prices fall, money flows are usually negative. A divergence,
however, between money flow and price trend can be a signal of a future price trend change. For example, a falling stock price with a positive money flow (IN)
can indicate a future rally in the price of the stock. Conversely, a rising stock price with a negative money flow (OUT) implies potential correction in the stock
price.
Disclaimer
The information in this report has been obtained from sources believed to be reliable. Its accuracy or completeness is not guaranteed and opinions are subject to
change without notice. This report is for information only and not to be construed as a solicitation for contracts. We accept no liability for any direct or indirect
loss arising from the use of this document. We, our associates, directors, employees may have an interest in the securities and/or companies mentioned herein.
for TA SECURITIES HOLDINGS BERHAD (14948-M)
MENARA TA ONE, 22 JALAN P. RAMLEE, 50250 KUALA LUMPUR, MALAYSIA TEL: +603-20721277 / FAX: +603-20325048
(A Participating Organisation of Bursa Malaysia Securities Berhad)
Kaladher Govindan – Head of Research
Page 4 of 4
T e c h n i c a l
TA Securities
V i e w
Friday, February 06, 2015
FBMKLCI: 1,803.21
A Member of the TA Group
MENARA TA ONE, 22 JALAN P. RAMLEE, 50250 KUALA LUMPUR, MALAYSIA TEL: +603-20721277 / FAX: +603-20325048
Daily Stock Screen
s
Malaysia
End Day Census of 05.02.2015
THIS REPORT IS STRICTLY FOR INTERNAL CIRCULATION ONLY*
Chartist: Stephen Soo
Tel: +603-2167 9607
[email protected]
www.taonline.com.my
Report Description:
The Daily Stock Screen is a retail product which can be a very useful guide for momentum trading and trading ideas .The following list is
derived from the screening of more than 1000 stocks currently listed on Bursa Malaysia to identify: the top 20 breakout, 20 breakdown, and
30 ‘potential’ breakout stocks which just climbed above the middle Bollinger band, with potential to appreciate toward the upper Bollinger
band.
[MIDDLE BOLLINGER RANGEBOUND]
List of 30 Potential Breakout Stocks (Short-term BUY for upside toward Upper Bollinger Band or higher to TAKE PROFIT/SELL)
No
1
2
3
4
5
6
7
8
9
10
11
12
13
14
15
16
17
18
19
20
21
22
23
24
25
26
27
28
29
30
Stock Name
Price
GLOBALTEC FORMAT
MEDIA SHOPPE BHD
SUMATEC RESOURCE
ASTRO MALAYSIA
KARAMBUNAI CORP
GENETEC TECH BHD
NEXGRAM HOLDINGS
PDZ HOLDINGS BHD
DIVERSIFIED GATE
MLABS SYSTEMS
ES CERAMICS TECH
SINOTOP HOLDING
EA HOLDINGS
PUC FOUNDER MSC
TALAM TRANSFORM
XINGHE HOLDINGS
AT SYSTEMATIZATI
LONDON BISCUITS
RGB INTERNATIONA
UEM SUNRISE BHD
INGENUITY CONSOL
AE MULTI HOLDING
MULTI SPORTS HOL
BERJAYA CORP BHD
BERJAYA AUTO BHD
FRONTKEN CORP
SONA PETROLEUM B
LEWEKO RESOURCES
HIAP HUAT HOLDIN
MARCO HOLDINGS B
0.08
0.07
0.22
2.98
0.07
0.16
0.08
0.16
0.09
0.10
0.23
0.07
0.13
0.15
0.09
0.10
0.10
0.65
0.15
1.30
0.06
0.16
0.13
0.41
3.36
0.17
0.43
0.17
0.14
0.18
RSI
Bollinger Band
Moving Average
Lower
Middle
Upper
14-day
10-day
30-day
50-day
0.05
0.04
0.20
2.91
0.06
0.13
0.07
0.13
0.06
0.09
0.18
0.05
0.11
0.12
0.07
0.06
0.08
0.59
0.13
1.22
0.05
0.14
0.11
0.39
3.29
0.15
0.41
0.14
0.12
0.16
0.07
0.05
0.21
2.97
0.06
0.15
0.08
0.15
0.08
0.10
0.22
0.06
0.12
0.13
0.08
0.09
0.09
0.64
0.15
1.29
0.06
0.15
0.13
0.40
3.36
0.16
0.42
0.16
0.13
0.17
0.08
0.07
0.23
3.03
0.07
0.17
0.08
0.17
0.10
0.11
0.26
0.07
0.14
0.15
0.09
0.11
0.10
0.69
0.16
1.37
0.06
0.16
0.14
0.42
3.42
0.17
0.43
0.17
0.14
0.18
58.74
58.82
48.33
47.70
50.43
61.41
55.92
55.38
60.54
49.80
55.85
57.13
55.74
55.42
58.25
58.96
59.82
53.92
57.10
42.33
55.98
52.33
54.61
46.77
51.49
63.26
54.14
56.56
53.90
58.15
0.07
0.06
0.22
2.95
0.07
0.16
0.08
0.16
0.09
0.10
0.23
0.06
0.13
0.14
0.08
0.09
0.09
0.64
0.15
1.31
0.06
0.15
0.13
0.41
3.37
0.16
0.43
0.16
0.13
0.17
0.07
0.05
0.21
3.00
0.06
0.14
0.07
0.15
0.07
0.10
0.21
0.06
0.12
0.14
0.08
0.08
0.09
0.63
0.14
1.35
0.05
0.15
0.12
0.40
3.34
0.15
0.42
0.15
0.13
0.16
0.07
0.06
0.22
3.10
0.07
0.14
0.07
0.15
0.07
0.10
0.21
0.06
0.12
0.15
0.08
0.08
0.09
0.64
0.14
1.47
0.06
0.16
0.12
0.42
3.32
0.15
0.41
0.15
0.13
0.16
Vol
49,704,900
34,567,200
19,168,800
11,489,600
7,332,300
6,957,500
5,313,400
4,924,600
4,828,900
4,657,000
4,569,200
3,457,600
3,331,200
3,329,700
3,299,400
3,169,000
3,096,000
3,071,600
3,026,500
3,009,400
2,691,300
2,373,000
2,270,600
2,090,500
2,047,700
2,019,200
1,935,900
1,810,800
1,710,000
1,610,000
20-day avg vol
10,737,510
19,239,260
38,396,580
5,997,950
583,700
4,676,520
7,955,385
16,129,340
9,566,060
574,680
5,640,430
1,238,560
4,920,175
7,992,595
8,784,080
4,625,865
3,563,440
994,685
4,806,575
4,946,200
4,189,800
2,767,540
3,160,495
8,112,130
1,248,090
4,847,430
7,386,365
375,940
1,837,205
3,974,775
Raw data sourced from Bloomberg
*Note: To qualify in this list above, the first sorting criteria is stock price must have just climbed or stayed ABOVE the middle Bollinger Band, followed by a second
criteria that trading volume for the day must be significantly strong. This is a good watch list for momentum traders looking for short-term BUY ideas, as they
are laggards with good upside potential towards the upper Bollinger band or higher to TAKE PROFIT/SELL. Caveat: Some stocks may continue to stay range
bound and trade sideways, hence traders should refer to their respective charts to spot accumulation (volume growth) or breakout patterns.
INTERPRETATION OF TECHNICAL INDICATORS:
Moving Averages: A stock’s short-term trend is bullish if share price stays above the 10-day moving average, and bearish if it stays below. The mediumterm trend is positive if share price stays above the 30-day, and negative if it remains below this average.
14-day RSI: A reading below 30 is considered oversold, above 70 is overbought. A rise above 50 with a corresponding share price surge above the 30-day
SMA should be taken as a bullish move with good short-term upside potential. A fall below 50 and a simultaneous dip below the 30-day SMA is bearish and
imply further near-term downside risk.
Bollinger Bands: Variable width bands that narrow during less volatile periods and widen during more volatile periods. As a general rule, in a bearish
trend, traders should buy when share price touches the lower band and exit when price touches the middle band. The reverse is true in a bullish trend, ie.
Buy when price touches the middle band and sell when price touches the upper band. Momentum traders will buy on price breaks above the upper band,
and sell when price breaks below the lower band. Alternatively, a sharp move that originates at one band tends to go all the way to the other band, a useful
observation when projecting price targets.
Page 1 of 2
TA Securities
A Member of the TA Group
*Note: To qualify in the breakout list below, the first sorting criteria is stock price must close ABOVE the upper Bollinger Band, followed by a second criteria that
trading volume for the day must be significantly higher than the 20-day average volume, which signal a bullish breakout. Caveat: We would caution momentum
traders that a highly overbought 14-day RSI reading (> 80) and share price pullback BELOW the upper Bollinger Band are early warning signals to exit buy
breakout trades.
[UPPER BOLLINGER BREAKOUT]
Top 20 Breakout Stocks (Generally BULLISH, but can be short-term TAKE PROFIT/SELL guide)
No
Stock Name
Price
19
KANGER INTERNATI
MK LAND HLDGS
UMS-NEIKEN GRP
PROTASCO BHD
IDEAL JACOBS MAL
TRANSOCEAN HLDGS
ECM LIBRA FINANC
SUNSURIA BHD
PENTAMASTER CORP
SUPER ENT HLDGS
COMINTEL CORP BH
ECOFIRST CONSOLI
HOVID BHD
MALPAC HLDG
MUDAJAYA GROUP
KUMPULAN JETSON
UNISEM (M) BHD
KAF SEAGROATT
IGB REIT
20
TASEK CORP BHD
0.46
0.47
0.98
1.72
0.36
0.51
1.05
1.51
0.52
1.48
0.24
0.33
0.42
1.82
1.74
0.46
2.10
1.74
1.36
15.60
1
2
3
4
5
6
7
8
9
10
11
12
13
14
15
16
17
18
RSI
Bollinger Band
Moving Average
Lower
Middle
Upper
14-day
10-day
30-day
50-day
0.34
0.38
0.64
1.42
0.26
0.37
0.95
1.29
0.37
1.16
0.18
0.29
0.35
1.73
1.40
0.42
1.86
1.62
1.24
15.19
0.39
0.42
0.77
1.53
0.30
0.43
0.99
1.37
0.43
1.31
0.21
0.31
0.38
1.77
1.55
0.44
1.98
1.67
1.30
15.34
0.44
0.45
0.90
1.65
0.34
0.49
1.02
1.46
0.49
1.46
0.24
0.33
0.41
1.81
1.71
0.46
2.10
1.72
1.36
15.50
65.44
75.57
84.03
68.81
64.07
58.89
68.07
79.77
71.40
67.37
67.36
64.94
69.58
56.87
70.13
61.81
66.68
58.68
70.50
61.54
0.39
0.42
0.78
1.53
0.30
0.43
0.99
1.39
0.44
1.33
0.21
0.31
0.38
1.78
1.59
0.44
2.01
1.66
1.31
15.32
0.38
0.41
0.75
1.51
0.30
0.44
0.98
1.35
0.41
1.32
0.20
0.30
0.37
1.78
1.51
0.44
1.91
1.71
1.29
15.39
0.38
0.41
0.75
1.52
0.32
0.44
0.98
1.33
0.41
1.33
0.20
0.31
0.37
1.80
1.59
0.45
1.88
1.76
1.29
15.52
Vol
9,293,000
18,468,100
2,325,100
10,033,100
3,992,300
38,600
765,900
478,800
15,921,000
42,400
1,571,800
4,062,200
11,556,500
21,700
834,100
2,192,500
7,129,800
132,500
3,009,000
26,700
20-day avg vol
259,245
914,140
117,020
791,715
400,265
4,780
106,635
81,520
2,738,440
8,190
344,880
980,490
2,941,080
5,815
310,725
837,210
2,745,745
51,835
1,235,455
11,230
Raw data sourced from Bloomberg
*Note: As for the top 20 breakdown list below, the sole sorting criteria is stock price must close significantly BELOW the lower Bollinger Band, with the largest
distance from the lower band at the top of the table, signaling a severe sell-off which is bearish. Caveat: A stock should bottom out if share price moves ABOVE the
falling lower Bollinger Band, which can be a good buy signal for technical rebound upside after the sharp sell-off.
[LOWER BOLLINGER BREAKDOWN]
Top 20 Breakdown Stocks (Generally BEARISH, but can be short-term BUY guide)
No
1
2
3
4
5
6
7
8
9
10
11
12
13
14
15
16
17
18
19
20
Stock Name
Price
METROD
TEO GUAN LEE COR
MICROLINK SOLUT
AUTOAIR HLDGS
IRM GROUP BHD
KWANTAS CORP BHD
MELEWAR INDUSTRI
Y&G CORP BHD
YLI HLDGS BHD
CARING PHARMACY
MASTERSKILL EDUC
YINSON HLDGS BHD
PINEAPPLE RESOUR
SMTRACK BHD
TIGER SYNERGY BH
MALAYSIAN GENOMI
NETX HOLDINGS BH
COMPUGATES HOLDI
DPS RESOURCES BH
ANN JOO RESOURCE
1.79
1.42
0.50
0.02
0.02
1.95
0.28
0.76
0.73
1.11
0.62
2.78
0.27
0.08
0.13
0.39
0.06
0.05
0.08
1.05
Bollinger Band
RSI
Moving Average
Lower
Middle
Upper
14-day
10-day
30-day
50-day
1.85
1.48
0.54
0.05
0.03
1.96
0.29
0.77
0.73
1.12
0.62
2.78
0.27
0.08
0.13
0.39
0.06
0.05
0.08
1.05
1.99
1.58
0.62
0.12
0.05
2.00
0.31
0.89
0.78
1.19
0.68
2.86
0.34
0.08
0.13
0.45
0.06
0.05
0.09
1.10
2.13
1.68
0.71
0.19
0.07
2.04
0.33
1.02
0.83
1.27
0.73
2.93
0.42
0.09
0.14
0.50
0.06
0.06
0.10
1.15
32.61
25.48
29.38
25.86
24.45
38.54
39.03
40.19
30.26
32.32
39.22
46.02
41.13
29.76
40.57
41.25
41.73
43.76
39.68
37.68
1.97
1.55
0.61
0.11
0.05
1.98
0.31
0.92
0.77
1.20
0.67
2.87
0.32
0.08
0.14
0.44
0.06
0.05
0.09
1.11
1.99
1.59
0.63
0.14
0.06
2.00
0.31
0.88
0.79
1.19
0.67
2.81
0.35
0.09
0.13
0.45
0.06
0.05
0.09
1.09
1.95
1.61
0.66
0.14
0.07
2.02
0.31
0.86
0.79
1.21
0.68
2.75
0.35
0.09
0.13
0.43
0.06
0.05
0.10
1.10
Vol
400
3,200
5,000
323,700
3,178,200
2,100
36,700
100
55,000
240,400
3,283,800
3,224,200
5,000
205,000
17,916,000
1,000
50,000
632,100
1,814,100
305,400
20-day avg vol
8,020
410
90
630
132,700
9,925
47,345
120
62,710
51,485
6,524,490
2,653,380
310
118,945
20,112,660
65
1,211,225
1,554,315
3,476,040
98,180
Raw data sourced from Bloomberg
Disclaimer
The information in this report has been obtained from sources believed to be reliable. Its accuracy or completeness is not guaranteed and opinions are subject to
change without notice. This report is for information only and not to be construed as a solicitation for contracts. We accept no liability for any direct or indirect
loss arising from the use of this document. We, our associates, directors, employees may have an interest in the securities and/or companies mentioned herein.
for TA SECURITIES HOLDINGS BERHAD (14948-M)
MENARA TA ONE, 22 JALAN P. RAMLEE, 50250 KUALA LUMPUR, MALAYSIA TEL: +603-20721277 / FAX: +603-20325048
(A Participating Organisation of Bursa Malaysia Securities Berhad)
Kaladher Govindan – Head of Research
Page 2 of 2
Friday, 06 February, 2015
For Internal Circulation Only
TA RESEARCH’S ‘DAILY COMPILED FOREIGN TECHNICAL REPORTS’
Asian Technical Reports
a. Foreign Technical Stock Watch (AUS)
b. Foreign Technical Stock Watch (HK)
c. Foreign Technical Stock Watch (FSSTI)
Disclaimer
The information in this report has been obtained from sources believed to be reliable. Its accuracy or completeness is not guaranteed and opinions are subject to change
without notice. This report is for information only and not to be construed as a solicitation for contracts. We accept no liability for any direct or indirect loss arising
from the use of this document. We, our associates, directors, employees may have an interest in the securities and/or companies mentioned herein.
for TA SECURITIES HOLDINGS BERHAD (14948-M)
MENARA TA ONE, 22 JALAN P. RAMLEE, 50250 KUALA LUMPUR, MALAYSIA TEL: +603-20721277 / FAX: +603-20325048
(A Participating Organisation of Bursa Malaysia Securities Berhad)
Kaladher Govindan – Head of Research
T e c h n i c a l
TA Securities
V i e w
Friday, February 06, 2015
A Member of the TA Group
MENARA TA ONE, 22 JALAN P. RAMLEE, 50250 KUALA LUMPUR, MALAYSIA TEL: +603-20721277 / FAX: +603-20325048
Foreign Technical Stock Watch
Australia
ASX: 5,810.98 (+33.64, +0.58%)
THIS REPORT IS STRICTLY FOR INTERNAL CIRCULATION ONLY*
Chartist: Stephen Soo
Stock
Name
ASX 200
BHP BILLITON
RIO TINTO
COMMONW BK AUSTR
WESTPAC BANKING
AUST AND NZ BANK
NATL AUST BANK
SINGAP TELEC-CDI
WESFARMERS
WOODSIDE PETRO
NEWCREST MINING
WESTFIELD GROUP
FORTESCUE METALS
QBE INSURANCE
ORIGIN ENERGY
AMP
SANTOS
MACQUARIE GROUP
SUNCORP GROUP
ORICA
OIL SEARCH
COCA-COLA AMATIL
AMCOR
STOCKLAND
ALUMINA
COMPUTERSHARE
ASCIANO
QANTAS AIRWAYS
SIMS METAL MGMT
CENTAURUS METALS
CITIGOLD CORP
DRILLSEARCH ENERGY
GINDALBIE METALS
KANGAROO RESOURCES
LYNAS CORP
SOVEREIGN GOLD
TIARO COAL
Tel: +603-2167 9607
[email protected]
Close
Bollinger Bands
RSI
Moving Averages
DMI
Change High Low
5-Feb
Lower Mid Upper 14d
10d
30d
50d
DI + DI ADX
Diff
5810.98
33.64 5819.10 5757.90 5185.48 5488.47 5791.45 78.55 5610.06 5463.10 5392.58 51.27 13.56 28.28 37.71
31.36
60.20
93.27
36.44
34.98
36.97
3.91
44.71
35.26
14.39
10.22
2.51
11.20
11.86
6.05
8.09
65.43
14.78
19.45
8.23
9.84
13.04
4.60
2.03
11.60
6.06
2.50
10.67
0.05
0.02
0.96
0.02
0.01
0.05
0.01
0.00
-0.63
-0.53
2.48
0.21
0.36
0.47
0.00
0.18
-0.61
0.51
0.14
-0.07
0.15
-0.24
0.11
-0.27
0.68
-0.01
0.11
-0.24
0.02
0.08
0.07
-0.03
0.04
-0.03
0.12
-0.23
0.00
0.00
-0.02
0.00
0.00
0.00
0.00
0.00
31.50
60.42
93.30
36.54
35.08
37.03
3.93
45.07
35.34
14.42
10.28
2.55
11.26
12.00
6.07
8.19
65.59
14.92
19.57
8.28
9.89
13.10
4.60
2.09
11.68
6.12
2.52
10.85
0.05
0.02
0.97
0.02
0.01
0.05
0.01
0.00
31.18
59.63
90.92
35.93
34.43
36.09
3.89
44.54
34.71
13.98
10.10
2.45
10.97
11.66
5.95
7.95
64.19
14.71
19.21
8.13
9.79
12.92
4.50
2.02
11.42
6.06
2.42
10.55
0.05
0.02
0.92
0.02
0.01
0.04
0.01
0.00
26.16
52.94
81.02
31.77
30.39
32.47
3.43
41.62
32.38
11.79
8.89
1.97
10.23
9.99
5.15
7.00
54.09
13.62
16.92
6.81
8.93
12.36
4.00
1.76
11.29
5.77
2.22
10.51
0.04
0.01
0.62
0.02
0.00
0.04
0.00
0.00
28.82
56.96
86.67
33.99
32.49
34.66
3.70
43.20
34.75
13.25
9.62
2.37
10.75
10.95
5.59
7.65
59.93
14.28
18.13
7.62
9.43
12.89
4.30
1.91
11.80
5.97
2.42
11.05
0.06
0.02
0.78
0.02
0.01
0.05
0.01
0.01
31.47
60.99
92.32
36.21
34.59
36.85
3.98
44.78
37.11
14.70
10.34
2.77
11.26
11.91
6.02
8.30
65.76
14.94
19.33
8.42
9.93
13.42
4.59
2.05
12.31
6.16
2.62
11.58
0.08
0.02
0.93
0.02
0.01
0.07
0.01
0.01
64.36
64.07
84.14
79.32
81.14
83.47
72.45
69.73
49.93
72.38
69.13
53.41
60.38
60.52
73.21
52.18
78.79
68.55
64.15
60.06
74.50
53.41
73.31
64.47
46.96
56.88
56.70
40.34
39.38
54.63
69.74
45.58
34.20
40.46
45.15
31.08
29.79
57.87
88.90
34.93
33.22
35.59
3.82
43.86
34.61
13.83
9.89
2.28
10.69
11.09
5.76
7.90
62.37
14.55
18.39
7.95
9.65
12.76
4.42
1.95
11.64
6.02
2.45
10.97
0.05
0.02
0.83
0.02
0.01
0.05
0.01
0.01
28.92
57.16
86.27
33.67
32.33
34.25
3.67
42.75
35.78
12.52
9.49
2.48
10.88
11.18
5.57
7.82
59.34
14.19
18.40
7.68
9.37
13.11
4.26
1.88
11.80
5.99
2.43
11.32
0.06
0.02
0.79
0.02
0.01
0.06
0.01
0.01
29.31
56.86
84.34
33.21
32.06
33.46
3.63
42.27
35.92
11.66
9.12
2.54
10.89
11.39
5.55
8.26
59.07
14.15
18.20
7.69
9.24
12.93
4.21
1.80
11.61
5.91
2.31
11.14
0.06
0.02
0.81
0.02
0.01
0.06
0.01
0.03
43.95
39.33
47.60
45.74
46.20
45.95
33.01
31.26
31.24
38.90
37.82
28.26
29.90
37.82
38.32
33.06
43.46
30.41
34.85
36.61
32.74
18.91
35.11
31.86
16.71
30.84
34.26
11.82
33.16
40.14
40.10
21.52
38.65
21.26
27.65
27.73
24.55
24.54
9.31
10.21
10.15
11.96
11.82
9.99
30.44
19.86
7.63
25.40
24.29
26.33
12.44
24.87
13.64
19.80
16.23
25.66
12.04
20.88
7.06
16.21
21.67
20.68
22.90
28.68
45.73
18.17
17.95
15.92
42.20
27.85
48.92
62.30
20.88
13.06
35.37
28.59
26.96
30.05
28.21
27.86
19.96
34.68
42.58
24.01
17.52
26.98
24.55
22.92
29.80
16.63
19.02
15.86
28.11
18.97
31.43
16.94
14.22
17.60
25.04
25.51
17.70
34.26
24.24
27.42
15.76
20.63
40.15
41.08
19.40
14.79
38.29
35.53
36.05
33.99
21.19
21.27
0.79
19.04
30.19
2.86
5.60
11.49
25.88
8.19
29.82
10.61
18.61
10.95
20.70
(1.97)
28.05
15.65
(4.96)
10.15
11.36
(16.87)
(12.56)
21.98
22.14
5.60
(3.55)
(6.58)
(21.27)
(34.57)
www.taonline.com.my
MACD
Line Signal Diff
98.74 59.87 38.867
0.46
0.64
1.98
0.76
0.64
0.86
0.09
0.62
-0.36
0.74
0.29
-0.06
-0.03
0.02
0.11
-0.05
1.64
0.19
0.16
0.16
0.17
-0.03
0.10
0.06
-0.04
0.03
0.04
-0.13
0.00
0.00
0.03
0.00
0.00
0.00
0.00
-0.01
0.01
0.12
1.34
0.49
0.32
0.63
0.06
0.47
-0.62
0.73
0.24
-0.10
-0.09
-0.17
0.06
-0.20
0.97
0.12
-0.04
0.05
0.12
-0.05
0.06
0.04
-0.01
0.02
0.05
-0.09
0.00
0.00
0.00
0.00
0.00
0.00
0.00
-0.01
0.453
0.521
0.642
0.271
0.321
0.230
0.027
0.146
0.257
0.004
0.051
0.044
0.063
0.198
0.059
0.151
0.668
0.075
0.201
0.108
0.045
0.018
0.035
0.012
(0.037)
0.013
(0.004)
(0.040)
(0.002)
0.000
0.030
0.000
(0.000)
(0.001)
0.001
0.002
DMI MACD
Recent Signal
BUY
BUY
BUY
BUY
BUY
BUY
BUY
BUY
BUY
BUY
BUY
BUY
BUY
BUY
BUY
BUY
BUY
BUY
BUY
BUY
BUY
BUY
BUY
SELL
BUY
BUY
SELL
BUY
BUY
SELL
SELL
BUY
BUY
BUY
SELL
SELL
SELL
SELL
BUY
BUY
BUY
BUY
BUY
BUY
BUY
BUY
BUY
BUY
BUY
BUY
BUY
BUY
BUY
BUY
BUY
BUY
BUY
BUY
BUY
BUY
BUY
BUY
SELL
BUY
SELL
SELL
SELL
BUY
BUY
BUY
SELL
SELL
BUY
BUY
DMI MACD
Signal Change
BUY
-
The table below consists of the top 30 ASX 200 Index component stocks, weighted by market capitalization in descending
order, with some popular technical indicators. Some other popularly traded stocks are included at the bottom section.
The technical BUY/SELL signals on the last four columns are auto generated; the first two being existing or recent signals
while the last two represent a signal change from BUY to SELL or the reverse, otherwise no change is indicated by a dash.
Page 1 of 3
TA Securities
A Member of the TA Group
Daily Money Flow of Foreign Technical Stock Picks
Australia
THIS REPORT IS STRICTLY FOR INTERNAL CIRCULATION ONLY*
Chartist: Stephen Soo
Tel: +603-2167 9607
www.taonline.com.my
30-Jan
2-Feb
3-Feb
4-Feb
5-Feb
Total
5D MF
(A)
Prv. Chg
(B)
Cur. Chg
ASX 200
20.6
30.2
14.9
2.9
19.6
88.2
(12.0)
16.6
5,588.3
5,625.3
5,707.4
5,777.3
5,811.0
1 BHP BILLITON
(1.6)
0.9
2.5
1.4
(2.1)
1.1
(0.5)
3.4
4.0
2.3
1.6
4.5
(4.7)
5.4
4.8
(2.2)
2.4
(7.0)
(2.5)
12.5
30.65
58.58
31.36
7.7
13.5
28.95
57.05
31.99
0.9
10.3
30.65
58.58
90.40
88.76
90.40
60.73
90.79
60.20
93.27
5.0
2.2
2.9
3.0
5.1
0.5
1.0
(1.0)
(0.2)
13.8
(4.1)
(1.2)
4.9
2.3
(3.1)
35.26
34.11
(0.3)
(1.5)
5.2
34.64
32.95
(1.6)
6.0
5.4
35.26
34.11
0.5
1.3
1.9
36.23
35.50
36.23
0.1
2.2
(0.0)
1.3
(0.0)
(0.0)
0.0
1.5
(0.0)
0.0
0.0
(0.0)
(2.7)
(1.1)
1.5
1.5
0.5
(2.9)
3.92
44.17
(3.2)
6.9
(14.6)
3.79
43.70
(3.5)
2.0
(4.1)
3.92
44.17
35.69
33.74
35.69
2.2
3.0
2.3
3.1
0.3
1.8
(1.7)
(0.7)
0.4
3.5
(2.0)
2.1
1.8
0.8
(2.2)
14.00
10.23
(0.9)
(2.5)
2.8
13.70
9.88
(0.9)
7.4
(3.0)
14.00
10.23
(2.7)
0.2
(0.4)
1.4
(0.1)
0.9
2.1
0.2
1.8
1.6
0.5
0.8
5.0
1.4
(0.8)
3.2
0.6
0.0
(0.5)
0.8
(3.3)
5.1
0.0
(1.3)
(0.6)
0.3
(2.7)
4.2
3.7
2.1
3.9
0.9
4.4
0.3
(2.1)
1.3
8.8
(0.6)
1.0
1.1
0.5
0.3
(0.6)
3.1
2.2
13.1
3.5
(6.5)
(0.9)
5.1
2.8
0.3
0.3
(0.4)
0.7
0.1
(0.8)
(0.1)
(0.2)
0.9
1.0
(0.2)
1.0
(5.5)
(1.5)
(2.8)
0.4
0.4
(1.1)
0.4
(10.4)
0.6
3.1
0.5
(1.5)
2.8
1.0
1.4
0.8
0.8
0.5
0.2
(0.7)
1.3
1.0
0.0
(0.5)
1.1
2.7
0.3
1.3
0.1
1.1
(0.0)
0.4
(0.0)
(0.0)
No
Name
2 RIO TINTO
3 COMMONW BK AUSTR
4 WESTPAC BANKING
5 AUST AND NZ BANK
6 NATL AUST BANK
7 SINGAP TELEC-CDI
8 WESFARMERS
9 WOODSIDE PETRO
10 NEWCREST MINING
11 WESTFIELD GROUP
12 FORTESCUE METALS
13 QBE INSURANCE
14 ORIGIN ENERGY
15 AMP
16 SANTOS
17 MACQUARIE GROUP
18 SUNCORP GROUP
19 ORICA
20 OIL SEARCH
22 AMCOR
23 STOCKLAND
24 ALUMINA
25 COMPUTERSHARE
26 ASCIANO
27 QANTAS AIRWAYS
28 SIMS METAL MGMT
29 CENTAURUS METALS
30 CITIGOLD CORP
31 DRILLSEARCH ENERGY
32 GINDALBIE METALS
33 KANGAROO RESOURCES
34 LYNAS CORP
35 SOVEREIGN GOLD
36 TIARO COAL
Total Money Flow (AUD' mn)
[email protected]
(0.5)
4.7
(0.6)
(0.7)
(0.6)
0.3
0.9
2.2
(1.2)
(0.5)
0.2
0.7
(0.4)
(1.0)
(0.5)
0.5
(0.5)
(0.1)
0.8
5.0
(2.1)
1.8
0.3
0.6
0.0
0.0
0.0
(0.0)
0.0
(0.0)
(0.4)
0.0
0.8
0.0
0.3
0.0
(1.0)
0.0
0.0
(0.0)
(0.0)
0.0
(0.0)
0.0
(0.0)
(0.1)
(0.0)
0.0
0.0
0.0
0.0
0.0
0.0
0.0
(0.2)
(0.0)
(0.2)
(0.0)
(0.0)
0.0
(0.2)
(0.0)
0.0
0.0
0.0
0.0
(0.0)
(0.0)
(0.0)
0.0
0.0
0.0
0.0
0.0
0.0
0.0
0.0
0.0
0.0
0.0
(0.0)
0.0
0.0
0.0
(0.0)
0.0
0.0
0.0
0.0
0.0
CLOSING PRICE
30-Jan
2-Feb
3-Feb
2.37
2.23
2.37
10.68
11.70
10.53
10.60
10.68
11.70
5.85
5.80
5.85
8.21
63.87
7.73
61.75
8.21
63.87
14.68
14.58
14.68
18.85
8.33
17.82
7.70
18.85
8.33
12.86
12.75
12.86
4.57
1.98
4.34
1.95
4.57
1.98
11.48
11.64
11.48
6.00
2.41
6.05
2.57
10.71
4-Feb
5-Feb
(A+B)
DMF
Chg
33.64
IN
(0.63) IN
(0.53) OUT
2.48 IN
36.23
36.44
34.62
36.50
34.98
36.97
3.91
3.91
44.53
35.87
44.71
35.26
IN
0.00 OUT
0.18 IN
(0.61) OUT
13.88
14.39
0.51
10.08
2.58
10.22
2.51
11.05
11.20
12.10
5.94
11.86
6.05
8.36
8.09
64.75
14.79
65.43
14.78
19.34
19.45
8.47
12.96
8.23
13.04
4.53
4.60
2.06
11.56
2.03
11.60
6.00
2.41
6.09
6.06
2.38
2.50
11.14
10.71
0.05
0.02
0.05
0.02
0.05
0.02
10.90
0.05
10.67
0.05
0.90
0.78
0.90
0.02
0.01
0.02
0.00
0.02
0.01
0.04
0.05
0.04
0.01
0.01
0.01
0.00
0.01
0.01
0.02
0.02
0.98
0.02
0.96
0.02
0.01
0.01
0.05
0.01
0.05
0.01
0.00
0.00
0.21 OUT
IN
0.36
0.47
IN
0.14 OUT
(0.07) IN
0.15 IN
(0.24) OUT
0.11 OUT
(0.27) IN
0.68 OUT
(0.01) IN
0.11 IN
(0.24) IN
0.08 IN
0.07 OUT
(0.03) OUT
0.04 IN
(0.03) OUT
0.12 OUT
(0.23) OUT
0.00 IN
(0.00) IN
(0.02) OUT
(0.00) OUT
0.00 OUT
(0.00) IN
(0.00) OUT
0.00 OUT
Sources: Bloomberg, TA Securities
Daily Money Flow (DMF) Formulation
If previous change (A) + current change (B) > 0, then DMF = “IN”; AND if (A) + (B) < 0, then DMF = “OUT”.
Money Flow (MF) Calculation
The value of money flow is set to zero at the start of the trading day. When a trade is performed, its price is compared to the price of the previous trade (the first
trade of the day is compared to the previous day's close). If the prices differ, the money associated with the trade (price times number of shares) is added to or
subtracted from the money flow. Additions (inflows, buys) are done on upticks; subtractions (outflows, sells) are done on downticks.
Daily Money Flow (DMF) Interpretation
In general, money flow trends confirm price trends. As prices rise, money flows are usually positive. As prices fall, money flows are usually negative. A divergence,
however, between money flow and price trend can be a signal of a future price trend change. For example, a falling stock price with a positive money flow (IN)
can indicate a future rally in the price of the stock. Conversely, a rising stock price with a negative money flow (OUT) implies potential correction in the
stock price.
Page 2 of 3
TA Securities
A Member of the TA Group
INTERPRETATION OF TECHNICAL INDICATORS:
Bollinger Bands: Variable width bands that narrow during less volatile periods and widen during more volatile periods. As a general rule, in a bearish trend, traders should buy
when share price touches the lower band and exit when price touches the middle band. The reverse is true in a bullish trend, ie. Buy when price touches the middle band and sell
when price touches the upper band. Momentum traders tend to buy on price breakouts above the upper band, and sell when price breaks down below the lower band.
14-day Relative Strength Index (RSI): A reading below 30 is considered oversold, above 70 is overbought. A rise above 50 with a corresponding share price surge above the 30-day
moving average should be taken as a bullish move with good short-term upside potential. A fall below 50 and a simultaneous dip below the 30-day average is bearish and imply
further near-term downside risk.
Moving Averages: A stock’s short-term trend is bullish if share price stays above the 10-day moving average, and bearish if it stays below. The medium-term trend is positive if
share price stays above the 30-day average and negative if it remains below. A longer-term uptrend is intact if share price sustain above the 50-day average, and is deemed broken
if it breaches below this level.
Directional Movement Indicator (DMI): The DMI is an indicator of trend strength. A positive DMI difference (DMI diff) value is bullish and indicate a higher DI+ vs. DI-, while a
negative DMI diff is bearish due to a lower DI+ vs. DI- (DMI diff = DI+ minus DI-). A crossover of DI+ above DI- triggers a BUY signal, while a SELL signal is flashed when the DI+
crosses below the DI-. The Average Directional Movement Index (ADX) indicates the strength of a trend, whether it is up or down. The higher the value of ADX, the stronger the
trend. An ADX value above 25 suggests a trending market or stock, while a value below 20 signal congestion or absence of trend.
Daily Moving Average Convergence Divergence (MACD): The MACD diff value is derived from the difference between the MACD line (the 12-day EMA minus the 26-day EMA) and the
MACD signal line (the 9-day EMA of the MACD). A positive MACD diff value is bullish, while a negative MACD diff is bearish. A BUY signal is generated when the MACD diff rises
above zero, and SELL signal sparked when the MACD diff value falls below zero.
Fundamentals of Foreign Technical Picks
Bloomberg Ticker Stock Name
BHP AU BHP BILLITON LTD
RIO AU RIO TINTO LTD
CBA AU COMMONW BK AUSTR
WBC AU WESTPAC BANKING
ANZ AU AUST AND NZ BANK
NAB AU NATL AUST BANK
SGT AU SINGAP TELEC-CDI
WES AU WESFARMERS LTD
WPL AU WOODSIDE PETRO
NCM AU NEWCREST MINING
WFD AU WESTFIELD GROUP
FMG AU FORTESCUE METALS
QBE AU QBE INSURANCE
ORG AU ORIGIN ENERGY
AMP AU AMP LTD
STO AU SANTOS LTD
MQG AU MACQUARIE GROUP
SUN AU SUNCORP GROUP LT
ORI AU ORICA LTD
OSH AU OIL SEARCH LTD
CCL AU COCA-COLA AMATIL
AMC AU AMCOR LTD
SGP AU STOCKLAND
AWC AU ALUMINA LTD
CPU AU COMPUTERSHARE LT
AIO AU ASCIANO LTD
QAN AU QANTAS AIRWAYS
SGM AU SIMS METAL MGMT
CTM AU CENTAURUS METALS LTD
CTO AU CITIGOLD CORP LTD
DLS AU DRILLSEARCH ENERGY LTD
GBG AU GINDALBIE METALS LTD
KRL AU KANGAROO RESOURCES LTD
LYC AU LYNAS CORP LTD
SOC AU SOVEREIGN GOLD CO LTD
TCM AU TIARO COAL LTD
EPS ($)
PER(x)
Div Yield(%)
52week Price
6%
8%
-13%
-6%
-1%
0%
1%
0%
4%
-18%
-9%
11%
6%
10%
-2%
27%
1%
-2%
3%
9%
-6%
0%
-7%
-1%
9%
12%
18%
17%
2015
1.64
4.83
5.55
2.51
2.66
2.76
0.23
2.17
3.03
0.55
0.45
0.24
0.67
0.64
0.35
0.53
4.42
1.05
1.58
0.34
0.50
0.70
0.26
0.02
0.62
0.41
0.22
0.63
2016
1.58
3.76
5.74
2.60
2.79
2.88
0.24
2.43
1.29
0.90
0.46
0.21
0.86
0.79
0.37
0.30
4.69
1.10
1.69
0.27
0.52
0.75
0.28
0.10
0.67
0.47
0.36
0.89
2015
14.9
9.7
16.8
14.5
13.1
13.4
18.0
20.6
9.0
26.3
22.5
8.3
13.0
18.5
17.5
15.1
14.8
14.0
12.3
19.0
19.7
18.6
17.8
N/A
14.6
14.7
N/A
17.0
2016
15.4
12.5
16.3
14.0
12.5
12.9
16.9
18.4
21.3
16.0
22.3
9.5
10.1
15.0
16.3
26.8
13.9
13.5
11.5
23.6
19.0
17.4
16.7
N/A
13.5
12.8
N/A
12.0
2015
4.059
3.530
4.518
5.206
5.297
5.561
4.297
4.959
7.025
0.014
2.808
2.629
2.938
4.224
4.314
4.450
4.687
6.644
4.781
1.361
4.421
3.865
5.217
0.985
2.466
3.086
0.000
2.746
2016
4.190
3.701
4.711
5.409
5.535
5.751
4.552
5.073
2.915
0.570
2.984
2.869
3.821
4.486
4.694
4.438
5.031
6.177
5.111
1.495
4.512
4.110
5.283
4.236
2.647
4.340
0.000
3.852
High
39.79
71.30
93.30
36.54
35.08
37.03
3.94
45.48
44.23
14.42
10.66
6.23
13.23
16.21
6.07
15.32
65.59
15.08
24.63
9.88
11.93
13.78
4.70
2.10
13.17
6.61
2.65
12.30
Low
26.50
51.99
72.14
30.00
28.84
31.33
3.00
39.38
31.97
8.51
6.23
1.92
10.13
10.28
4.11
6.96
52.92
11.55
16.87
6.87
8.19
9.88
3.59
1.14
10.78
5.13
1.03
9.15
% Chg
YTD
6.78
3.79
8.90
9.89
9.01
10.03
8.01
7.17
-7.23
32.14
13.30
-8.39
-0.09
1.63
10.00
-1.94
12.25
5.12
2.64
4.31
5.58
-3.98
11.65
13.09
-1.69
0.17
4.17
-11.31
N/A
N/A
17%
N/A
N/A
31%
N/A
N/A
N/A
N/A
0.11
N/A
N/A
-0.02
N/A
N/A
0.00
N/A
0.09
N/A
N/A
0.00
N/A
N/A
N/A
N/A
N/A
N/A
N/A
54.8
N/A
N/A
N/A
N/A
10.4
N/A
N/A
N/A
N/A
N/A
N/A
N/A
N/A
N/A
N/A
0.000
N/A
N/A
0.000
N/A
N/A
N/A
N/A
0.000
N/A
N/A
0.20
0.05
1.74
0.11
0.02
0.32
0.15
0.17
0.05
0.01
0.65
0.02
0.01
0.04
0.00
0.00
-1.96
26.67
18.52
0.00
-16.67
-32.35
14.29
-40.00
Close
Target Price
% upside
31.36
60.20
93.27
36.44
34.98
36.97
3.91
44.71
35.26
14.39
10.22
2.51
11.20
11.86
6.05
8.09
65.43
14.78
19.45
8.23
9.84
13.04
4.60
2.03
11.60
6.06
2.50
10.67
33.22
65.43
82.67
34.36
34.51
36.95
3.96
44.90
36.54
12.23
9.35
2.82
11.90
13.20
5.94
11.10
66.11
14.47
19.96
9.05
9.26
13.01
4.31
2.02
12.69
6.85
3.03
12.79
0.05
0.02
0.96
0.02
0.01
0.05
0.01
0.00
N/A
N/A
1.16
N/A
N/A
0.07
N/A
N/A
Note : The above data is based on Bloomberg consensus.
Disclaimer
The information in this report has been obtained from sources believed to be reliable. Its accuracy or completeness is not guaranteed and opinions are subject to
change without notice. This report is for information only and not to be construed as a solicitation for contracts. We accept no liability for any direct or indirect
loss arising from the use of this document. We, our associates, directors, employees may have an interest in the securities and/or companies mentioned herein.
for TA SECURITIES HOLDINGS BERHAD (14948-M)
MENARA TA ONE, 22 JALAN P. RAMLEE, 50250 KUALA LUMPUR, MALAYSIA TEL: +603-20721277 / FAX: +603-20325048
(A Participating Organisation of Bursa Malaysia Securities Berhad)
Kaladher Govindan – Head of Research
Page 3 of 3
T e c h n i c a l
TA Securities
V i e w
Friday, February 06, 2015
A Member of the TA Group
MENARA TA ONE, 22 JALAN P. RAMLEE, 50250 KUALA LUMPUR, MALAYSIA TEL: +603-20721277 / FAX: +603-20325048
Foreign Technical Stock Watch
Hong Kong
HSI: 24,765.49 (+85.73, +0.35%)
THIS REPORT IS STRICTLY FOR INTERNAL CIRCULATION ONLY*
Chartist: Stephen Soo
Stock
Close
Name
5-Feb
HANG SENG
24,765.49
HSBC
CH MOBILE
CCONB
ICBC
CNOOC
CH LIFE
BOC
SHK PROP
PETRO CH
TENCENT
HKSE
CH KONG
HUTCHISON
PING AN
SINOPEC CORP
CH SHENHUA
CLP
LI & FUNG
BOC HK
HS BANK
HK&CH GAS
SWIRE
HL PROP
WHARF
CH OV LAND
POWER ASSETS
BELLE
HENDERSON
BOCOMM
CH COAL
CH UNICOM
BK EASIA
ESPRIT
MTR
SINO LAND
CH RES
NEW WORLD
CH RES LAND
CH MERCHANT
CH RES POWER
ALCORP
CATHAY
CITIC
COSCO
FIH MOBILE LTD
GENHK
72.20
108.30
6.39
5.67
10.86
31.05
4.40
124.40
8.56
135.20
178.00
146.50
102.50
83.00
6.19
20.90
67.50
7.40
26.95
144.90
17.48
104.70
22.35
61.95
23.70
80.70
8.82
55.00
6.46
4.28
12.88
32.20
8.21
34.35
12.70
16.54
9.36
20.40
28.20
20.00
3.51
17.44
13.32
11.16
3.51
2.81
Change
Tel: +603-2167 9607
High
Lower
85.73
(0.20)
2.70
0.12
0.10
(0.24)
0.30
0.07
(0.20)
(0.20)
1.30
(0.30)
(0.90)
(0.50)
0.00
(0.09)
(0.50)
(0.75)
(0.10)
(0.35)
1.40
(0.14)
0.40
(0.25)
0.25
0.25
(1.30)
0.00
0.05
(0.10)
(0.01)
0.42
(0.15)
(0.44)
0.15
0.02
(0.12)
0.01
0.68
0.10
(1.35)
(0.01)
0.06
0.08
0.06
0.01
0.00
RSI
Bollinger Bands
Low
Mid
[email protected]
Upper
14d
Moving Averages
10d
30d
www.taonline.com.my
DMI
50d
DI +
DMI
MACD
DI -
ADX
Diff
Line
Signal
Diff
MACD
Recent Signal
DMI
MACD
Signal Change
25,048.26
24,642.81
23,728.10
24,415.57
25,103.04
61.39
24,701.71
24,148.50
23,878.99 33.02
18.16
19.60
14.86
254.06
258.73
(4.668)
BUY
SELL
-
-
72.40
108.50
6.50
5.75
11.12
31.95
4.57
125.90
8.85
137.00
180.00
148.90
103.80
86.05
6.33
21.70
69.00
7.62
27.50
148.40
17.72
105.80
22.75
62.75
24.60
82.80
9.07
55.75
6.87
4.35
13.00
32.60
8.75
34.50
12.84
16.92
9.43
21.10
28.40
21.10
3.69
17.66
13.42
11.52
3.53
2.81
71.65
106.40
6.36
5.63
10.72
30.85
4.37
124.10
8.51
133.00
176.50
145.80
101.60
82.70
6.14
20.70
67.40
7.28
26.80
143.00
17.42
104.00
22.15
61.70
23.60
80.50
8.69
54.85
6.46
4.24
12.62
31.90
8.20
34.10
12.66
16.48
9.30
20.30
27.85
19.70
3.48
17.28
13.22
10.98
3.47
2.80
69.58
93.56
6.14
5.47
10.12
29.55
4.23
117.98
8.36
121.10
175.48
133.22
92.42
80.03
6.06
20.57
66.92
7.07
25.80
124.56
17.47
100.59
20.59
58.95
22.57
74.89
8.65
52.16
6.32
4.07
11.05
30.45
8.12
32.51
12.10
15.07
8.91
19.31
25.52
19.30
3.41
16.86
13.14
10.90
3.42
2.77
71.60
101.11
6.34
5.67
10.53
31.10
4.39
123.62
8.66
130.68
178.33
143.39
99.72
84.24
6.20
21.69
68.35
7.45
26.66
133.53
17.71
103.07
21.88
61.15
23.96
79.34
8.97
54.45
6.66
4.42
11.83
31.51
8.72
33.60
12.69
16.56
9.17
20.74
27.52
20.88
3.74
17.62
13.50
11.20
3.58
2.83
73.61
108.67
6.54
5.87
10.94
32.64
4.56
129.26
8.96
140.25
181.17
153.56
107.02
88.45
6.34
22.81
69.78
7.82
27.51
142.49
17.95
105.55
23.16
63.36
25.34
83.80
9.29
56.74
7.00
4.77
12.61
32.57
9.32
34.68
13.27
18.04
9.42
22.17
29.51
22.46
4.08
18.38
13.86
11.50
3.75
2.89
48.70
72.09
54.89
53.08
56.77
53.99
53.86
56.55
48.09
62.64
51.74
61.99
65.41
52.56
48.86
36.02
44.72
44.98
55.70
89.99
42.50
62.04
56.16
61.62
51.03
60.61
47.35
55.08
43.28
36.24
77.00
61.39
34.31
66.06
50.47
49.33
64.87
49.45
59.24
41.13
40.32
50.24
45.55
51.50
42.67
51.18
72.41
104.21
6.31
5.66
10.54
31.25
4.40
126.05
8.62
134.92
179.16
146.69
102.44
84.11
6.21
21.27
68.76
7.60
27.03
136.96
17.74
104.01
22.46
62.04
23.53
81.35
8.86
55.50
6.61
4.28
12.05
32.00
8.61
34.02
12.95
17.16
9.25
20.36
28.40
21.44
3.62
17.85
13.37
11.26
3.53
2.83
72.14
97.82
6.35
5.66
10.52
30.69
4.38
121.65
8.66
125.87
177.01
138.68
96.16
82.66
6.22
22.19
67.79
7.37
26.35
131.76
17.68
102.02
21.76
59.66
23.80
77.70
8.90
54.20
6.80
4.60
11.40
31.33
8.84
33.01
12.59
16.42
9.08
20.87
27.00
20.53
3.75
17.33
13.48
11.14
3.56
2.79
73.55
95.59
6.21
5.52
10.57
29.25
4.26
118.28
8.54
122.26
175.24
137.37
94.64
77.96
6.22
22.30
67.07
7.65
26.43
130.02
17.73
102.33
21.90
57.88
23.38
76.00
8.78
53.21
6.71
4.73
11.23
31.18
9.05
32.29
12.54
16.18
9.05
20.30
26.72
20.69
3.61
17.22
13.47
10.93
3.66
2.75
31.65
12.51
23.64
23.93
27.15
21.15
20.20
15.03
27.22
15.49
16.46
15.49
15.79
22.78
23.27
24.43
15.13
20.72
13.58
5.25
18.03
11.26
15.53
16.50
20.20
8.35
18.38
13.25
23.84
27.77
12.21
8.91
31.73
11.59
12.52
17.79
12.04
19.72
18.26
23.91
24.25
27.97
20.04
18.05
22.36
34.03
18.48
33.80
19.30
18.26
14.04
21.91
23.91
34.09
14.23
26.16
10.64
40.40
40.62
20.13
10.73
20.77
26.74
30.28
25.74
43.03
12.82
25.59
25.43
46.44
19.81
38.71
15.83
26.03
18.57
32.37
30.72
24.86
25.49
44.07
16.96
27.07
26.01
22.73
22.01
27.52
16.47
18.36
12.86
21.18
13.97
19.38
2.32
22.94
6.72
2.55
3.63
5.09
6.96
7.89
1.57
8.75
(0.04)
24.74
17.72
5.32
(1.48)
(9.17)
(1.12)
3.72
8.95
50.80
(4.66)
14.13
6.92
12.24
6.64
15.91
2.94
12.43
1.75
(12.11)
26.85
16.20
(14.57)
13.15
2.95
8.83
12.22
4.38
10.69
(2.46)
(1.88)
(2.07)
(0.92)
6.53
(4.20)
(9.54)
-0.30
3.16
0.01
0.02
0.02
0.50
0.02
2.22
-0.01
4.01
0.91
3.56
2.81
1.35
-0.01
-0.37
0.42
-0.02
0.29
3.22
-0.01
0.81
0.26
1.25
-0.04
1.77
-0.02
0.67
-0.07
-0.15
0.34
0.32
-0.16
0.59
0.11
0.19
0.08
-0.14
0.57
0.23
-0.05
0.18
-0.06
0.06
-0.04
0.01
-0.50
2.79
0.03
0.04
-0.04
0.74
0.05
2.45
0.00
3.96
1.13
3.29
2.56
2.17
-0.02
-0.32
0.58
-0.04
0.23
2.09
0.01
0.64
0.16
1.35
0.10
1.72
0.02
0.67
-0.03
-0.14
0.28
0.24
-0.16
0.58
0.12
0.23
0.05
0.04
0.56
0.28
0.00
0.25
-0.03
0.10
-0.04
0.02
0.198
0.371
(0.018)
(0.025)
0.063
(0.238)
(0.021)
(0.228)
(0.010)
0.046
(0.226)
0.268
0.246
(0.821)
0.003
(0.053)
(0.166)
0.021
0.058
1.136
(0.018)
0.161
0.099
(0.097)
(0.140)
0.055
(0.039)
(0.001)
(0.035)
(0.006)
0.064
0.090
0.001
0.018
(0.007)
(0.039)
0.029
(0.175)
0.011
(0.047)
(0.050)
(0.068)
(0.034)
(0.040)
(0.000)
(0.008)
BUY
BUY
BUY
BUY
BUY
BUY
BUY
BUY
BUY
BUY
SELL
BUY
BUY
BUY
SELL
SELL
SELL
BUY
BUY
BUY
SELL
BUY
BUY
BUY
BUY
BUY
BUY
BUY
BUY
SELL
BUY
BUY
SELL
BUY
BUY
BUY
BUY
BUY
BUY
SELL
SELL
SELL
SELL
BUY
SELL
SELL
BUY
BUY
SELL
SELL
BUY
SELL
SELL
SELL
SELL
BUY
SELL
BUY
BUY
SELL
BUY
SELL
SELL
BUY
BUY
BUY
SELL
BUY
BUY
SELL
SELL
BUY
SELL
SELL
SELL
SELL
BUY
BUY
BUY
BUY
SELL
SELL
BUY
SELL
BUY
SELL
SELL
SELL
SELL
SELL
SELL
SELL
BUY
BUY
BUY
SELL
SELL
BUY
BUY
BUY
BUY
SELL
BUY
-
SELL
SELL
SELL
-
33.97
35.45
30.36
26.48
30.78
26.23
27.16
22.93
28.79
24.24
16.42
40.23
33.51
28.10
21.79
15.25
14.01
24.44
22.53
56.04
13.37
25.40
22.45
28.74
26.84
24.26
21.32
25.68
25.59
15.66
39.06
25.12
17.16
24.74
15.47
26.62
24.26
24.10
28.95
21.44
22.37
25.90
19.12
24.58
18.16
24.49
The table above consists of the 45 HKSE Hang Seng Index component stocks, sorted by market capitalization in descending
order, with some popular technical indicators. Some other popularly traded stocks are included at the bottom section.
The technical BUY/SELL signals on the last four columns are auto generated; the first two being existing or recent signals
while the last two represent a signal change from BUY to SELL or the reverse, otherwise no change is indicated by a dash.
Page 1 of 4
TA Securities
A Member of the TA Group
Company News: FIH Mobile trades at 22x consensus forward P/E, the highest among Asia-Pacific electronics assemblers. Its profit probably
rose 78% in the second half of last year and may climb 91% in the first half of this year, based on consensus, aided by a focus on phone
customers in emerging markets, such as China, Indonesia and India. – Bloomberg.
Technical Comments: FIH Mobile needs to overcome the 50-day moving average (HKD3.66) to enhance upside momentum towards the
upper Bollinger band (HKD3.75) or the 23.6%FR (HKD3.77), with a confirmed breakout to challenge the 38.2%FR (HKD4.01) and
50%FR (HKD4.20) levels, respectively. Crucial support is spotted at the low of 23/12/14 (HKD3.40).
FIH MOBILE LTD
HKD3.51 (+0.01)
\\
Upper
Middle
Lower
Recent Signal
Signal Change
BOLLINGER BANDS
HKD
HKD
HKD
DMI
3.75
3.58
3.42
10-day
30-day
50-day
SELL
Recent Signal
Signal Change
Page 2 of 4
SIMPLE MOVING AVERAGES
HKD 3.53
HKD 3.56
HKD 3.66
DAILY MACD
SELL
TA Securities
A Member of the TA Group
Daily Money Flow of Foreign Technical Stock Picks
Hong Kong
THIS REPORT IS STRICTLY FOR INTERNAL CIRCULATION ONLY*
Chartist: Stephen Soo
No
Name
HANG SENG
Tel: +603-2167 9607
Total Money Flow (HKD' mn)
30-Jan
2-Feb
[email protected]
(B)
4-Feb
5-Feb
Total
5D MF
(A)
3-Feb
Prv. Chg
Cur. Chg
www.taonline.com.my
CLOSING PRICE
30-Jan
2-Feb
3-Feb
4-Feb
5-Feb
(A+B)
DMF
Chg
(5.7)
35.2
36.5
(97.5)
141.9
110.3
(134.0)
239.3
24,507.1
24,484.7
24,554.8
24,679.8
24,765.5
85.73
IN
1 HSBC
(6.1)
(10.6)
(18.7)
(0.1)
(8.3)
(43.8)
18.5
(8.1)
71.50
72.30
71.50
72.40
72.20
(0.20)
IN
2 CH MOBILE
3 CCONB
4 ICBC
7.4
9.1
6.0
11.5
(6.6)
19.8
(25.1)
9.6
105.60
6.27
33.6
29.9
(23.3)
(6.2)
4.0
6.1
5.57
11.10
11.5
31.8
27.7
(56.9)
5.58
10.64
6.6
(7.6)
(100.3)
11.3
5.60
10.20
2.70
0.12
0.10
(4.6)
(17.2)
5.58
10.64
108.30
6.39
5.67
IN
IN
(80.7)
(8.6)
81.5
24.8
145.7
103.00
6.24
(8.6)
(36.3)
(18.5)
(10.2)
(72.1)
104.30
6.25
(13.9)
(24.8)
38.2
84.4
(91.0)
103.00
6.24
(52.8)
(26.0)
56.4
34.4
65.0
30.75
4.33
2.6
(2.5)
6.9
(14.1)
1.7
31.25
4.32
(1.6)
(6.6)
53.8
(36.1)
4.2
30.75
4.35
6.6
(12.4)
106.0
27.5
3.6
31.25
4.32
(8.2)
(8.4)
181.6
(20.3)
4.3
(33.5)
(15.6)
(63.4)
332.7
4.0
(47.0)
(31.0)
(22.5)
125.00
8.60
135.10
128.20
8.42
134.60
125.00
8.60
135.10
124.60
8.76
133.90
1.9
6.5
4.0
(9.0)
0.7
(4.3)
(9.3)
(12.2)
178.30
147.40
1.6
17.6
10.1
15.4
(1.2)
178.70
148.80
(1.8)
(18.2)
(10.0)
(7.9)
3.4
178.30
145.40
(15.5)
(52.1)
(1.8)
(15.7)
(13.3)
178.70
148.80
2.0
(63.9)
0.8
3.2
0.4
103.00
83.00
(36.9)
8.9
0.3
63.6
28.5
104.10
83.40
(8.4)
6.8
0.3
35.8
(28.5)
101.90
82.95
(13.2)
8.8
2.5
(35.2)
(90.8)
104.10
83.40
(23.8)
11.0
1.9
81.2
(8.5)
14.3
(5.0)
49.8
0.1
2.1
(0.0)
5.4
(5.2)
6.18
21.20
68.25
6.17
21.15
69.50
6.18
21.20
68.25
6.28
21.40
68.25
(0.0)
(9.9)
(2.6)
(4.3)
1.1
(4.4)
1.6
(7.4)
7.50
27.30
20.5
7.6
(3.1)
(1.5)
(22.2)
7.45
27.20
2.6
1.5
0.6
(3.0)
17.9
7.61
26.70
0.2
(2.0)
(1.4)
(34.9)
29.7
7.45
27.20
8.1
(10.8)
(1.5)
(8.9)
(1.7)
143.50
17.62
7.2
0.7
0.6
(9.1)
(7.3)
136.40
17.66
(4.1)
(2.8)
(1.4)
6.0
11.3
135.90
17.88
3.0
(4.2)
(3.3)
(5.2)
9.7
136.40
17.66
3.6
(3.6)
(11.4)
(1.6)
(0.0)
1.3
1.1
(8.6)
(14.4)
3.4
2.0
0.7
0.6
103.80
22.50
61.25
104.40
22.75
62.70
103.80
22.50
61.25
104.30
22.60
61.70
(3.8)
(0.3)
2.5
2.4
0.3
2.6
6.0
7.2
23.45
82.00
1.7
1.2
(7.1)
(1.0)
(1.2)
23.25
82.00
0.9
0.8
5.7
4.6
0.8
22.90
82.25
4.8
3.2
3.8
18.1
10.1
23.25
82.00
2.3
(1.3)
(1.1)
6.2
0.4
8.82
54.95
30 CH COAL
31 CH UNICOM
0.1
(0.3)
17.1
1.4
(4.8)
8.66
55.50
4.9
(2.3)
0.2
0.4
(4.8)
8.84
55.50
0.8
(6.0)
2.9
6.7
5.6
8.66
55.50
4.6
(6.2)
9.6
2.6
(4.7)
(0.8)
13.0
(15.6)
42.8
2.0
16.8
(0.5)
(4.1)
6.50
4.19
11.94
6.45
4.24
11.74
6.50
4.19
11.94
6.56
4.29
12.46
4.28
12.88
32 BK EASIA
33 ESPRIT
0.5
0.2
(0.2)
(0.5)
0.7
(0.4)
0.4
(0.4)
0.8
(2.2)
2.2
(3.4)
(0.2)
0.0
0.4
(1.8)
31.90
8.74
32.25
8.75
31.90
8.74
32.35
8.65
32.20
8.21
34 MTR
35 SINO LAND
36 CH RES
(4.5)
(4.3)
(2.8)
0.6
0.7
(0.0)
(2.0)
(0.1)
34.20
12.68
(1.5)
(2.1)
4.7
(1.0)
(0.3)
34.20
12.74
2.4
1.2
(2.7)
(0.1)
(4.0)
34.60
13.08
3.1
(0.1)
(5.8)
(4.9)
7.6
34.20
12.74
5.4
2.1
2.7
(1.1)
(1.8)
2.2
(1.0)
2.8
(0.5)
(7.4)
16.66
9.35
7.5
(2.0)
(0.3)
(3.3)
(5.3)
16.62
9.36
13.8
(3.0)
(0.1)
(1.4)
29.4
17.40
9.12
11.2
(4.6)
(4.3)
(2.5)
(5.2)
16.62
9.36
34.35
12.70
16.54
(0.2)
0.6
(10.8)
(1.3)
1.0
3.1
0.8
(2.2)
19.60
28.00
21.40
20.20
28.55
21.85
19.60
28.00
21.40
19.72
28.10
21.35
(4.3)
(5.4)
(3.5)
(6.8)
(1.3)
(6.1)
0.3
0.0
3.52
17.38
(0.8)
0.1
(1.8)
0.0
(1.8)
0.7
(0.7)
3.46
17.32
0.7
(0.7)
0.2
0.0
1.6
6.2
(1.5)
3.62
18.00
1.0
(1.5)
0.4
(0.0)
(10.2)
(17.5)
(5.5)
3.46
17.32
(4.9)
(3.3)
(1.6)
(0.0)
(1.4)
0.7
(1.5)
2.1
(0.6)
(0.0)
(3.3)
(3.3)
(0.1)
0.8
(1.9)
0.0
1.9
1.2
(0.0)
13.22
11.04
3.51
2.78
13.36
11.26
3.55
2.82
13.22
11.04
3.51
2.78
13.24
11.10
3.50
2.81
5 CNOOC
6 CH LIFE
7 BOC
8 SHK PROP
9 PETRO CH
10 TENCENT
11 HKSE
12 CH KONG
13 HUTCHISON
14 PING AN
15 SINOPEC CORP
16 CH SHENHUA
17 CLP
18 LI & FUNG
19 BOC HK
20 HS BANK
21 HK&CH GAS
22 SWIRE
23 HL PROP
24 WHARF
25 CH OV LAND
26 POWER ASSETS
27 BELLE
28 HENDERSON
29 BOCOMM
37 NEW WORLD
38 CH RES LAND
39 CH MERCHANT
40 CH RES POWER
41 ALCORP
42 CATHAY
43 CITIC
44 COSCO
45 FIH MOBILE
46 GENHK
10.86
31.05
4.40
124.40
8.56
135.20
178.00
146.50
102.50
83.00
6.19
20.90
67.50
7.40
26.95
144.90
17.48
104.70
22.35
61.95
23.70
80.70
8.82
55.00
6.46
IN
(0.24) IN
0.30 OUT
0.07 OUT
(0.20) IN
(0.20) OUT
1.30 OUT
(0.30) IN
(0.90) IN
(0.50) IN
0.00 IN
(0.09) OUT
(0.50) IN
(0.75) OUT
(0.10) OUT
(0.35) OUT
1.40 OUT
(0.14) OUT
0.40 IN
(0.25) IN
0.25 IN
0.25 OUT
(1.30) IN
0.00 OUT
0.05 IN
(0.10) OUT
(0.01) IN
0.42 IN
(0.15) IN
(0.44) OUT
9.36
20.40
0.15 IN
0.02 OUT
(0.12) OUT
0.01 OUT
0.68 OUT
28.20
20.00
0.10
(1.35)
3.51
17.44
13.32
(0.01) OUT
0.06 IN
0.08 OUT
0.06 IN
0.01 OUT
0.00 OUT
11.16
3.51
2.81
IN
IN
Sources: Bloomberg, TA Securities
Daily Money Flow (DMF) Formulation
If previous change (A) + current change (B) > 0, then DMF = “IN”; AND if (A) + (B) < 0, then DMF = “OUT”.
Money Flow (MF) Calculation
The value of money flow is set to zero at the start of the trading day. When a trade is performed, its price is compared to the price of the previous trade (the first
trade of the day is compared to the previous day's close). If the prices differ, the money associated with the trade (price times number of shares) is added to or
subtracted from the money flow. Additions (inflows, buys) are done on upticks; subtractions (outflows, sells) are done on downticks.
Daily Money Flow (DMF) Interpretation
In general, money flow trends confirm price trends. As prices rise, money flows are usually positive. As prices fall, money flows are usually negative. A divergence,
however, between money flow and price trend can be a signal of a future price trend change. For example, a falling stock price with a positive money flow (IN)
can indicate a future rally in the price of the stock. Conversely, a rising stock price with a negative money flow (OUT) implies potential correction in the
stock price.
Page 3 of 4
TA Securities
A Member of the TA Group
INTERPRETATION OF TECHNICAL INDICATORS:
Bollinger Bands: Variable width bands that narrow during less volatile periods and widen during more volatile periods. As a general rule, in a bearish trend, traders should
buy when share price touches the lower band and exit when price touches the middle band. The reverse is true in a bullish trend, ie. Buy when price touches the middle band
and sell when price touches the upper band. Momentum traders tend to buy on price breakouts above the upper band, and sell when price breaks down below the lower band.
14-day Relative Strength Index (RSI): A reading below 30 is considered oversold, above 70 is overbought. A rise above 50 with a corresponding share price surge above the 30day moving average should be taken as a bullish move with good short-term upside potential. A fall below 50 and a simultaneous dip below the 30-day average is bearish and
imply further near-term downside risk.
Moving Averages: A stock’s short-term trend is bullish if share price stays above the 10-day moving average, and bearish if it stays below. The medium-term trend is positive
if share price stays above the 30-day average and negative if it remains below. A longer-term uptrend is intact if share price sustain above the 50-day average, and is deemed
broken if it breaches below this level.
Directional Movement Indicator (DMI): The DMI is an indicator of trend strength. A positive DMI difference (DMI diff) value is bullish and indicate a higher DI+ vs. DI-, while a
negative DMI diff is bearish due to a lower DI+ vs. DI- (DMI diff = DI+ minus DI-). A crossover of DI+ above DI- triggers a BUY signal, while a SELL signal is flashed when the DI+
crosses below the DI-. The Average Directional Movement Index (ADX) indicates the strength of a trend, whether it is up or down. The higher the value of ADX, the stronger
the trend. An ADX value above 25 suggests a trending market or stock, while a value below 20 signal congestion or absence of trend.
Daily Moving Average Convergence Divergence (MACD): The MACD diff value is derived from the difference between the MACD line (the 12-day EMA minus the 26-day EMA)
and the MACD signal line (the 9-day EMA of the MACD). A positive MACD diff value is bullish, while a negative MACD diff is bearish. A BUY signal is generated when the MACD
diff rises above zero, and SELL signal sparked when the MACD diff value falls below zero.
Fundamentals of Foreign Technical Picks
Bloomberg
Ticker
5
HK
941
HK
939
HK
1398
HK
883
HK
2628
HK
3988
HK
16
HK
857
HK
700
HK
388
HK
1
HK
13
HK
2318
HK
386
HK
1088
HK
2
HK
494
HK
2388
HK
11
HK
3
HK
19
HK
101
HK
4
HK
688
HK
6
HK
1880
HK
12
HK
3328
HK
1898
HK
762
HK
23
HK
330
HK
66
HK
83
HK
291
HK
17
HK
1109
HK
144
HK
836
HK
2600
HK
293
HK
267
HK
1199
HK
2038
HK
678
HK
Stock Name
HSBC
CH MOBILE
CCONB
ICBC
CNOOC
CH LIFE
BOC
SHK PROP
PETRO CH
TENCENT
HKSE
CH KONG
HUTCHISON
PING AN
SINOPEC CORP
CH SHENHUA
CLP
LI & FUNG
BOC HK
HS BANK
HK&CH GAS
SWIRE
HL PROP
WHARF
CH OV LAND
POWER ASSETS
BELLE
HENDERSON
BOCOMM
CH COAL
CH UNICOM
BK EASIA
ESPRIT
MTR
SINO LAND
CH RES
NEW WORLD
CH RES LAND
CH MERCHANT
CH RES POWER
ALCORP
CATHAY
CITIC
COSCO
FIH MOBILE LTD
GENHK
Close
Target
Price
% upside
72.20
108.30
6.39
5.67
10.86
31.05
4.40
124.40
8.56
135.20
178.00
146.50
102.50
83.00
6.19
20.90
67.50
7.40
26.95
144.90
17.48
104.70
22.35
61.95
23.70
80.70
8.82
55.00
6.46
4.28
12.88
32.20
8.21
34.35
12.70
16.54
9.36
20.40
28.20
20.00
3.51
17.44
13.32
11.16
3.51
2.81
81.75
105.78
7.70
6.74
10.86
33.80
4.92
129.10
8.84
149.64
188.08
165.14
118.55
96.10
6.29
24.61
62.80
8.86
29.42
138.22
17.45
109.33
25.21
67.07
27.89
79.17
9.57
54.62
6.95
4.22
13.38
33.02
9.71
33.05
14.34
18.18
10.91
24.55
32.10
25.06
3.33
18.97
13.76
12.68
4.85
3.11
12%
-2%
17%
16%
0%
8%
11%
4%
3%
10%
5%
11%
14%
14%
2%
15%
-7%
17%
8%
-5%
0%
4%
11%
8%
15%
-2%
8%
-1%
7%
-1%
4%
2%
15%
-4%
11%
9%
14%
17%
12%
20%
-5%
8%
3%
12%
28%
10%
EPS ($)
2015
0.9
5.4
0.9
0.8
1.2
1.3
0.6
7.8
0.7
2.6
4.4
15.4
8.4
4.8
0.5
2.0
4.2
0.1
2.3
8.7
0.7
6.8
1.4
3.9
2.8
4.1
0.5
3.1
0.9
0.1
0.5
2.7
0.1
1.8
0.9
0.2
0.8
1.9
1.7
2.5
-0.5
0.9
1.8
0.1
0.0
0.0
2016
0.9
5.6
1.0
0.8
0.6
1.5
0.6
8.4
0.4
3.4
5.9
14.5
8.1
5.2
0.4
2.0
4.3
0.1
2.6
9.7
0.8
7.5
1.4
4.4
3.2
4.2
0.6
3.2
0.9
0.1
0.6
2.8
0.3
1.8
0.9
0.3
0.9
2.3
1.9
2.7
-0.2
1.5
2.1
0.1
0.0
0.0
PER(x)
2015
10.7
16.1
5.6
5.8
7.5
19.9
6.0
15.9
10.6
42.3
40.4
9.5
12.1
14.0
9.5
8.6
16.1
16.2
11.6
16.6
25.0
15.4
15.5
16.0
8.5
19.6
13.2
17.6
6.0
55.7
19.1
11.7
N/A
18.9
14.5
103.4
11.3
10.6
16.7
8.0
N/A
19.8
7.6
12.7
N/A
19.1
2016
10.1
15.6
5.3
5.5
14.6
17.1
5.6
14.8
15.9
31.8
30.1
10.1
12.7
13.0
13.6
8.6
15.8
13.8
10.6
15.0
23.2
14.0
16.1
14.2
7.4
19.2
12.7
17.2
5.7
39.7
16.9
11.6
31.9
18.6
14.0
53.9
10.3
9.0
15.2
7.3
N/A
11.6
6.2
11.2
N/A
14.5
Div Yield(%)
2015
0.7
2.2
5.0
4.9
3.6
1.2
4.7
2.7
3.4
0.2
2.2
2.5
2.6
0.8
3.3
3.7
3.9
0.6
4.1
3.8
2.0
3.6
3.5
3.0
2.2
3.2
4.5
1.9
3.9
0.6
1.5
3.5
0.7
2.8
4.0
0.8
4.5
2.5
2.5
4.0
0.0
1.7
2.7
0.4
0.0
N/A
2016
0.8
2.2
5.3
5.1
2.1
1.4
5.0
2.8
2.3
0.3
3.0
2.6
2.6
1.0
2.5
3.8
4.0
0.7
4.4
3.7
2.2
3.8
3.5
3.2
2.6
3.3
3.6
2.0
4.1
0.9
1.7
3.5
1.9
2.9
4.0
1.0
4.5
2.8
2.8
4.5
0.0
3.0
3.1
0.5
0.0
N/A
52week Price
High
84.90
108.50
6.62
5.90
15.88
32.80
4.57
129.40
11.70
138.00
189.00
152.00
108.50
88.70
8.23
24.40
69.60
10.70
27.95
148.40
18.90
108.00
26.45
63.90
26.70
82.80
10.00
57.20
7.36
5.44
14.22
34.45
15.24
34.70
14.16
24.55
10.48
23.60
29.70
24.90
4.28
18.30
16.88
11.92
5.00
4.22
Low
69.75
63.65
4.89
4.33
9.72
19.72
3.03
90.35
7.32
93.00
112.80
105.95
85.90
55.60
5.74
19.12
56.00
7.06
21.50
117.60
13.91
80.55
19.80
46.35
17.52
57.85
7.00
36.46
4.53
3.72
9.03
28.50
8.10
26.55
9.83
15.12
7.15
13.62
22.75
17.56
2.54
13.56
9.35
9.40
3.40
2.22
% Chg
YTD
-2.43
19.67
0.31
0.18
4.02
1.97
0.69
5.16
-0.47
20.18
3.67
12.43
14.85
4.93
-0.96
-8.93
0.37
1.93
3.85
12.15
-1.58
3.66
2.76
10.63
2.82
7.24
1.15
1.29
-10.77
-11.93
23.85
3.04
-11.53
8.02
1.44
1.85
4.93
-0.24
8.05
0.00
-2.23
3.20
0.76
1.27
0.57
2.93
Note : The above data is based on Bloomberg consensus.
Disclaimer
The information in this report has been obtained from sources believed to be reliable. Its accuracy or completeness is not guaranteed and opinions are subject to
change without notice. This report is for information only and not to be construed as a solicitation for contracts. We accept no liability for any direct or indirect
loss arising from the use of this document. We, our associates, directors, employees may have an interest in the securities and/or companies mentioned herein.
for TA SECURITIES HOLDINGS BERHAD (14948-M)
MENARA TA ONE, 22 JALAN P. RAMLEE, 50250 KUALA LUMPUR, MALAYSIA TEL: +603-20721277 / FAX: +603-20325048
(A Participating Organisation of Bursa Malaysia Securities Berhad)
Kaladher Govindan – Head of Research
Page 4 of 4
T e c h n i c a l
TA Securities
V i e w
Friday, February 06, 2015
A Member of the TA Group
MENARA TA ONE, 22 JALAN P. RAMLEE, 50250 KUALA LUMPUR, MALAYSIA TEL: +603-20721277 / FAX: +603-20325048
•
Foreign Technical Stock Watch
FSSTI: 3,406.58 (-10.99, -0.32%)
Singapore
THIS REPORT IS STRICTLY FOR INTERNAL CIRCULATION ONLY*
Chartist: Stephen Soo
Stock
Name
FSSTI
SINGTEL
DBS
OCBC
UOB
JARDINE M.
WILMAR
HK LAND
CAPLAND
GENSP
KEPPEL
SGX
SIA
NOBLE
CITY DEV
JARDINE S.
SG PRESS
JARDINE C&C
GOLDEN AGRI
SG TECH
OLAM INT
CAP TRUST
SEMBCORP
SEMCORP M.
CMFT DELGRO
NOL
STARHUB
SMRT
SIA ENG
IFOOD AGRI
YZJ
ASIASONS
BLUMONT
LIONGOLD
Close
Change
5-Feb
3,406.58 (10.99)
4.09
19.42
10.49
23.40
64.09
3.21
7.85
3.55
1.06
8.86
7.95
12.16
1.09
10.10
35.06
4.10
41.95
0.43
3.44
1.98
2.17
4.26
3.05
2.97
1.01
4.26
1.80
4.15
0.71
1.26
0.03
0.02
0.02
0.00
(0.18)
(0.09)
0.00
0.36
(0.02)
0.00
0.03
(0.02)
(0.08)
(0.01)
0.05
(0.02)
(0.12)
0.28
0.01
(0.26)
0.00
(0.01)
0.00
0.03
(0.11)
(0.08)
0.05
(0.01)
(0.01)
0.03
(0.02)
0.00
(0.02)
0.00
0.00
0.00
Tel: +603-2167 9607
[email protected]
www.taonline.com.my
3,415.14 3,394.95
Bollinger Bands
Lower
Mid
Upper
3,292.12 3,373.19 3,454.25
RSI
14d
57.66
Moving Averages
10d
30d
50d
DI +
3,410.71 3,362.88 3,339.95 25.45
DI 18.27
ADX
20.36
Diff
7.18
MACD
Line Signal Diff
24.13 21.67 2.461
DMI MACD
Recent Signal
BUY BUY
DMI MACD
Signal Change
-
4.11
19.50
10.60
23.45
64.16
3.25
7.92
3.55
1.07
8.86
7.97
12.30
1.10
10.20
35.06
4.10
42.38
0.43
3.46
1.98
2.18
4.32
3.08
3.00
1.04
4.29
1.80
4.15
0.72
1.28
0.03
0.02
0.02
3.83
19.50
10.22
23.01
61.15
3.16
7.30
3.14
0.99
7.84
7.69
11.93
0.97
9.91
33.96
4.06
38.05
0.41
3.34
1.95
2.05
4.08
2.90
2.43
0.91
4.04
1.51
4.04
0.69
1.23
0.03
0.02
0.02
66.07
37.13
54.16
48.50
55.22
48.60
69.51
67.16
51.16
62.24
56.96
49.64
52.54
48.53
50.25
45.80
56.63
41.95
59.81
44.64
58.35
47.58
48.65
65.44
61.67
68.93
76.38
41.21
46.30
52.90
43.74
48.67
35.45
4.06
19.82
10.48
23.36
64.86
3.24
7.65
3.53
1.06
8.55
7.87
12.48
1.06
10.20
35.59
4.11
42.07
0.43
3.40
1.98
2.15
4.31
3.04
2.87
1.02
4.22
1.73
4.34
0.72
1.26
0.03
0.02
0.02
13.10
34.37
14.92
18.13
18.64
20.92
12.50
12.70
25.11
25.46
17.99
27.86
26.43
19.92
16.76
14.79
20.36
23.54
19.11
21.37
19.47
24.03
30.64
4.28
16.13
12.41
9.70
34.21
18.57
11.84
22.40
9.58
23.88
25.15
11.57
11.49
7.02
33.83
10.85
43.62
36.08
18.53
27.30
11.66
26.26
22.55
18.03
31.82
11.70
22.32
23.42
18.39
10.59
32.55
18.57
15.35
39.52
43.39
25.26
42.99
25.44
16.07
20.29
26.22
20.77
17.26
10.72
(14.26)
7.20
(0.76)
10.25
(8.26)
23.27
20.13
(1.88)
13.32
1.34
(5.37)
(4.31)
4.53
7.98
0.63
6.32
(5.35)
2.84
(3.71)
7.67
1.58
0.29
25.01
16.44
16.81
30.04
(14.64)
1.06
4.03
4.36
8.60
(0.92)
0.05
-0.09
0.05
-0.11
0.93
0.01
0.18
0.08
0.00
0.07
0.06
0.17
0.00
0.02
0.19
-0.01
0.38
-0.01
0.01
-0.02
0.02
0.00
-0.01
0.10
0.04
0.04
0.05
0.03
0.00
0.01
0.00
0.00
0.00
BUY
SELL
BUY
SELL
BUY
SELL
BUY
BUY
SELL
BUY
BUY
SELL
SELL
BUY
BUY
BUY
BUY
SELL
BUY
SELL
BUY
BUY
BUY
BUY
BUY
BUY
BUY
SELL
BUY
BUY
BUY
BUY
SELL
SELL
-
High
Low
4.07
19.32
10.49
23.31
63.13
3.19
7.81
3.52
1.05
8.75
7.89
12.06
1.07
10.08
34.50
4.08
41.69
0.42
3.41
1.97
2.13
4.23
3.03
2.94
1.00
4.24
1.76
4.08
0.71
1.25
0.03
0.02
0.02
3.99
19.89
10.41
23.33
63.83
3.22
7.57
3.41
1.04
8.39
7.86
12.39
1.05
10.16
35.24
4.11
40.79
0.44
3.39
1.98
2.15
4.24
3.02
2.74
0.99
4.17
1.67
4.27
0.72
1.26
0.03
0.02
0.02
4.14
20.28
10.61
23.65
66.52
3.28
7.85
3.68
1.09
8.95
8.03
12.85
1.13
10.40
36.53
4.15
43.54
0.46
3.43
2.01
2.25
4.40
3.13
3.05
1.08
4.29
1.83
4.50
0.75
1.29
0.03
0.02
0.02
3.96
20.01
10.41
23.61
62.63
3.22
7.33
3.36
1.05
8.53
7.83
12.16
1.07
10.17
34.81
4.13
41.00
0.44
3.39
2.00
2.11
4.28
3.09
2.69
0.94
4.15
1.64
4.24
0.72
1.25
0.03
0.02
0.02
3.94
19.88
10.38
23.78
61.56
3.21
7.12
3.32
1.06
8.53
7.69
11.77
1.10
10.09
34.71
4.16
41.42
0.45
3.37
2.03
2.06
4.29
3.07
2.64
0.89
4.13
1.62
4.14
0.72
1.23
0.03
0.02
0.02
23.82
20.11
22.12
17.38
28.89
12.65
35.77
32.83
23.23
38.78
19.33
22.49
22.12
24.46
24.74
15.42
26.68
18.19
21.95
17.66
27.14
25.61
30.93
29.29
32.58
29.22
39.74
19.57
19.63
15.87
26.77
18.18
22.96
DMI
0.04
-0.02
0.04
-0.13
1.10
0.01
0.17
0.07
0.00
-0.03
0.06
0.25
-0.02
0.04
0.28
-0.02
0.18
-0.01
0.00
-0.02
0.03
-0.01
-0.03
0.07
0.04
0.03
0.04
0.05
0.00
0.01
0.00
0.00
0.00
0.011
(0.069)
0.012
0.021
(0.165)
(0.001)
0.005
0.008
0.005
0.094
(0.004)
(0.080)
0.011
(0.015)
(0.089)
0.002
0.193
(0.001)
0.007
0.004
(0.008)
0.015
0.015
0.027
(0.007)
0.011
0.015
(0.023)
(0.001)
(0.003)
(0.000)
(0.000)
(0.000)
BUY
SELL
BUY
BUY
SELL
SELL
BUY
BUY
BUY
BUY
SELL
SELL
BUY
SELL
SELL
BUY
BUY
SELL
BUY
BUY
SELL
BUY
BUY
BUY
SELL
BUY
BUY
SELL
SELL
SELL
SELL
SELL
SELL
SELL
BUY
-
The table above consists of the revamped 30 SGX FTSE Straits Times Index component stocks, sorted by market capitalization
in descending order, with some popular technical indicators. Some other popularly traded stocks are included at the bottom
section.
The technical BUY/SELL signals on the last four columns are auto generated; the first two being existing or recent signals
while the last two represent a signal change from BUY to SELL or the reverse, otherwise no change is indicated by a dash.
Page 1 of 3
Daily Money Flow of Foreign Technical Stock Picks
Singapore
THIS REPORT IS STRICTLY FOR INTERNAL CIRCULATION ONLY*
Chartist: Stephen Soo
Tel: +603-2167 9607
Total Money Flow (SGD' mn)
[email protected]
(7.3)
(A)
Prv. Chg
(4.8)
(B)
Cur. Chg
17.9
3.0
6.3
(4.4)
6.5
(2.6)
2.0
1.0
0.0
(0.0)
(0.1)
1.2
0.1
4.9
0.7
1.3
(0.3)
0.4
(1.6)
(0.4)
0.4
(0.1)
0.0
0.1
1.0
0.5
2.2
(0.1)
0.1
0.3
(0.2)
(0.4)
0.8
(0.1)
(0.2)
1.4
(0.2)
0.2
1.2
(0.1)
(0.3)
0.3
(0.1)
15 JARDINE S.
16 SG PRESS
17 JARDINE C&C
0.0
(1.0)
0.1
0.2
(0.2)
0.1
18 GOLDEN AGRI
19 SG TECH
20 OLAM INT
(2.0)
0.3
(0.0)
21 CAP TRUST
22 SEMBCORP
23 SEMCORP M.
30-Jan
2-Feb
3-Feb
4-Feb
5-Feb
Total
5D MF
FSSTI
(12.9)
2.4
(1.7)
(6.5)
11.4
1 SINGTEL
2 DBS
(6.1)
(0.5)
(1.1)
0.3
1.1
(0.8)
(1.4)
1.2
3 OCBC
4 UOB
5 JARDINE M.
1.6
0.2
0.7
1.4
0.5
0.5
1.1
(1.2)
(0.0)
6 WILMAR
7 HK LAND
8 CAPLAND
(0.4)
0.2
(6.5)
(0.5)
0.7
(2.2)
9 GENSP
10 KEPPEL
11 SGX
0.2
2.3
(0.1)
12 SIA
13 NOBLE
14 CITY DEV
No
Name
24 CMFT DELGRO
25 NOL
26 STARHUB
27 SMRT
28 SIA ENG
29 IFOOD AGRI
30 YZJ
31 ASIASONS
32 BLUMONT
33 LIONGOLD
www.taonline.com.my
CLOSING PRICE
30-Jan
2-Feb
3-Feb
4-Feb
5-Feb
(A+B)
DMF
Chg
(10.99) IN
3,391.2
3,423.4
3,408.0
3,417.6
3,406.6
4.4
5.1
4.05
20.02
4.12
19.72
4.07
19.54
4.09
19.60
4.09
19.42
0.00
(0.18)
(0.0)
1.2
0.0
(1.1)
1.1
0.2
10.50
23.40
65.44
10.51
23.50
64.80
10.52
23.16
64.18
10.58
23.40
63.73
10.49
23.40
64.09
(1.6)
1.8
(9.4)
(0.1)
0.1
1.6
0.4
(0.4)
1.1
3.26
7.59
3.55
3.25
7.60
3.52
3.21
7.70
3.54
3.23
7.85
3.52
3.21
7.85
3.55
(0.09) OUT
0.00 IN
0.36 IN
(0.02) IN
0.00 OUT
0.03 IN
0.1
0.5
(0.3)
0.5
6.1
(0.8)
(0.4)
0.6
0.1
0.4
(0.3)
(0.2)
1.06
8.38
7.85
1.06
8.72
7.89
1.07
8.85
7.82
1.07
8.94
7.96
1.06
8.86
7.95
(0.2)
(1.0)
(0.1)
0.1
0.2
0.1
(0.4)
2.1
(0.3)
0.1
(1.3)
(0.0)
0.4
1.2
0.2
12.56
1.05
10.25
12.61
1.10
10.12
12.25
1.08
10.16
12.11
1.10
10.22
12.16
1.09
10.10
0.1
(0.3)
(0.0)
(0.1)
(0.1)
(0.0)
0.3
(0.1)
(0.2)
0.6
(1.5)
(0.1)
(0.2)
0.2
(0.0)
0.3
0.0
(0.1)
36.29
4.14
42.35
35.59
4.11
42.35
34.78
4.10
41.89
34.78
4.09
42.21
35.06
4.10
41.95
(1.2)
0.6
(0.0)
(0.3)
0.4
(0.0)
(1.0)
(0.3)
0.1
0.9
0.3
0.0
(3.6)
1.2
0.0
(0.8)
(0.7)
0.1
1.9
0.6
(0.1)
0.44
3.40
2.00
0.42
3.39
1.97
0.42
3.40
1.99
0.43
3.45
1.98
0.43
3.44
1.98
0.6
(0.6)
(1.9)
1.0
0.2
0.4
(2.2)
1.0
(0.3)
(0.3)
(0.7)
0.5
(1.8)
(0.0)
(1.6)
(0.8)
(3.2)
0.6
(0.3)
(4.5)
0.0
(6.6)
(1.5)
0.3
(0.8)
(1.4)
0.6
1.3
2.14
4.37
3.13
2.17
4.26
3.05
(0.0)
(1.8)
(0.6)
0.3
(0.9)
(0.2)
(0.1)
(0.0)
0.2
(0.4)
(1.0)
0.1
2.2
(0.3)
(3.9)
(1.3)
(0.3)
(1.0)
1.2
0.3
0.8
2.10
4.35
3.06
2.96
2.12
4.34
3.10
0.4
(0.1)
(0.2)
2.15
4.30
3.00
2.78
2.92
1.02
4.27
2.97
1.01
4.26
0.1
0.1
0.2
0.1
0.1
0.5
0.0
0.0
0.4
(0.4)
0.0
1.0
(0.4)
(0.1)
0.2
(0.1)
(0.4)
(0.0)
0.2
0.5
0.0
0.99
4.23
1.80
3.02
0.99
4.27
0.3
0.1
0.0
1.03
4.20
1.72
1.77
4.17
0.71
1.80
4.15
0.71
0.0
0.0
(0.0)
0.0
0.0
(0.0)
0.0
0.0
(0.0)
(0.0)
(0.0)
(0.0)
2.5
0.0
0.1
0.6
(0.0)
(0.0)
(0.7)
0.0
0.0
4.33
0.72
1.26
1.80
4.32
0.71
0.3
(0.0)
0.0
4.43
0.73
1.25
1.28
0.03
0.02
1.26
0.03
0.02
(0.0)
(0.0)
0.0
0.03
0.03
0.02
1.25
0.03
0.02
(0.0)
0.03
0.02
0.02
0.02 IN
(0.02) IN
0.00 OUT
(0.01) OUT
(0.00) OUT
0.00 OUT
0.02
0.02
0.02
0.00
IN
IN
(0.02) OUT
(0.08) IN
(0.01) OUT
0.05 IN
(0.02) OUT
(0.12) IN
0.28 IN
0.01 IN
(0.26) OUT
0.00 IN
(0.01) OUT
0.00 IN
0.03 OUT
(0.11) IN
(0.08) IN
0.05 OUT
(0.00) IN
(0.01) OUT
IN
Sources: Bloomberg, TA Securities
Daily Money Flow (DMF) Formulation
If previous change (A) + current change (B) > 0, then DMF = “IN”; AND if (A) + (B) < 0, then DMF = “OUT”.
Money Flow (MF) Calculation
The value of money flow is set to zero at the start of the trading day. When a trade is performed, its price is compared to the price of the previous trade (the first
trade of the day is compared to the previous day's close). If the prices differ, the money associated with the trade (price times number of shares) is added to or
subtracted from the money flow. Additions (inflows, buys) are done on upticks; subtractions (outflows, sells) are done on downticks.
Daily Money Flow (DMF) Interpretation
In general, money flow trends confirm price trends. As prices rise, money flows are usually positive. As prices fall, money flows are usually negative. A divergence,
however, between money flow and price trend can be a signal of a future price trend change. For example, a falling stock price with a positive money flow (IN)
can indicate a future rally in the price of the stock. Conversely, a rising stock price with a negative money flow (OUT) implies potential correction in the stock
price.
Page 2 of 3
INTERPRETATION OF TECHNICAL INDICATORS:
Bollinger Bands: Variable width bands that narrow during less volatile periods and widen during more volatile periods. As a general rule, in a bearish trend, traders should
buy when share price touches the lower band and exit when price touches the middle band. The reverse is true in a bullish trend, ie. Buy when price touches the middle band
and sell when price touches the upper band. Momentum traders tend to buy on price breakouts above the upper band, and sell when price breaks down below the lower band.
14-day Relative Strength Index (RSI): A reading below 30 is considered oversold, above 70 is overbought. A rise above 50 with a corresponding share price surge above the 30day moving average should be taken as a bullish move with good short-term upside potential. A fall below 50 and a simultaneous dip below the 30-day average is bearish and
imply further near-term downside risk.
Moving Averages: A stock’s short-term trend is bullish if share price stays above the 10-day moving average, and bearish if it stays below. The medium-term trend is positive
if share price stays above the 30-day average and negative if it remains below. A longer-term uptrend is intact if share price sustain above the 50-day average, and is deemed
broken if it breaches below this level.
Directional Movement Indicator (DMI): The DMI is an indicator of trend strength. A positive DMI difference (DMI diff) value is bullish and indicate a higher DI+ vs. DI-, while a
negative DMI diff is bearish due to a lower DI+ vs. DI- (DMI diff = DI+ minus DI-). A crossover of DI+ above DI- triggers a BUY signal, while a SELL signal is flashed when the DI+
crosses below the DI-. The Average Directional Movement Index (ADX) indicates the strength of a trend, whether it is up or down. The higher the value of ADX, the stronger
the trend. An ADX value above 25 suggests a trending market or stock, while a value below 20 signal congestion or absence of trend.
Daily Moving Average Convergence Divergence (MACD): The MACD diff value is derived from the difference between the MACD line (the 12-day EMA minus the 26-day EMA)
and the MACD signal line (the 9-day EMA of the MACD). A positive MACD diff value is bullish, while a negative MACD diff is bearish. A BUY signal is generated when the MACD
diff rises above zero, and SELL signal sparked when the MACD diff value falls below zero.
Fundamentals of Foreign Technical Picks
Bloomberg
Ticker
ST SP
DBS SP
OCBC SP
UOB SP
JM SP
WIL SP
HKL SP
CAPL SP
GENS SP
KEP SP
SGX SP
SIA SP
NOBL SP
CIT SP
JS SP
SPH SP
JCNC SP
GGR SP
STE SP
OLAM SP
CT SP
SCI SP
SMM SP
CD SP
NOL SP
STH SP
MRT SP
SIE SP
IFAR SP
YZJSGD SP
ACAP SP
BLUM SP
LIGO SP
Stock Name
Close
Target Price
% upside
SINGTEL
DBS
OCBC
UOB
JARDINE M.
WILMAR
HK LAND
CAPLAND
GENSP
KEPPEL
SGX
SIA
NOBLE
CITY DEV
JARDINE S.
SG PRESS
JARDINE C&C
GOLDEN AGRI
SG TECH
OLAM INT
CAP TRUST
SEMBCORP
SEMCORP M.
CMFT DELGRO
NOL
STARHUB
SMRT
SIA ENG
IFOOD AGRI
YZJ
ASIASONS
BLUMONT
LIONGOLD
4.09
19.42
10.49
23.40
64.09
3.21
7.85
3.55
1.06
8.86
7.95
12.16
1.09
10.10
35.06
4.10
41.95
0.43
3.44
1.98
2.17
4.26
3.05
2.97
1.01
4.26
1.80
4.15
0.71
1.26
0.03
0.02
0.02
4.17
22.36
11.55
24.86
65.70
3.53
7.89
3.91
1.24
9.18
7.86
11.96
1.44
10.13
38.00
3.90
49.00
0.48
3.65
2.40
2.18
4.85
3.12
2.99
0.99
4.08
1.81
3.92
0.82
1.43
NA
NA
NA
2%
13%
9%
6%
2%
9%
0%
9%
15%
3%
-1%
-2%
24%
0%
8%
-5%
14%
12%
6%
18%
0%
12%
2%
1%
-2%
-4%
1%
-6%
14%
12%
NA
NA
NA
EPS ($)
2015
0.2
1.613
0.9
2.0
4.2
0.2
0.4
0.2
0.0
0.9
0.3
0.3
0.1
0.6
2.7
0.2
2.5
0.0
0.2
0.2
0.1
0.4
0.3
0.1
0.0
0.2
0.1
0.2
601.9
0.9
NA
NA
NA
PER(x)
2016
0.3
1.746
1.0
2.1
4.6
0.2
0.4
0.2
0.1
0.9
0.4
0.6
0.1
0.7
3.0
0.2
2.8
0.0
0.2
0.2
0.1
0.5
0.3
0.1
0.0
0.2
0.1
0.2
677.6
0.8
NA
NA
NA
2015
17.3
12.0
11.1
11.9
15.2
13.4
20.9
22.5
21.5
10.1
25.0
36.3
11.0
15.6
12.8
21.7
12.5
15.8
19.8
11.8
19.4
9.8
11.6
22.0
N/A
20.1
29.0
24.3
11.0
6.7
NA
NA
NA
Div Yield(%)
2016
16.2
11.1
10.8
11.4
14.1
11.2
20.5
20.6
19.2
10.1
22.1
19.8
8.5
14.3
11.9
21.0
11.1
12.1
18.2
9.7
19.2
9.4
11.4
20.3
30.0
19.1
23.9
22.4
9.8
7.4
NA
NA
NA
2015
4.2
3.1
3.4
3.2
2.2
1.5
2.3
2.2
0.9
5.1
3.7
2.0
2.6
1.3
0.8
5.2
2.4
1.4
4.2
2.6
5.2
3.8
4.4
2.6
0.0
4.8
1.8
3.9
9273.0
20.1
0.0
0.0
0.0
2016
4.5
3.3
3.6
3.4
2.3
1.9
2.3
2.3
1.0
4.9
4.2
3.3
2.1
1.3
0.8
5.2
2.7
2.4
4.4
3.0
5.3
3.9
4.5
2.8
0.9
4.8
1.9
4.2
11472.4
18.0
0.0
0.0
0.0
52week Price
High
4.12
20.67
10.63
24.72
67.88
3.56
8.30
3.64
1.44
11.20
8.05
12.91
1.43
11.14
38.10
4.29
49.01
0.62
3.95
2.66
2.26
5.57
4.16
3.10
1.06
4.32
1.82
5.10
1.11
1.30
0.10
0.08
0.16
Low
3.42
15.65
8.85
19.43
51.99
2.92
5.97
2.68
0.99
7.91
6.66
9.18
0.90
8.66
31.05
3.89
33.47
0.41
3.14
1.41
1.80
4.05
2.85
1.89
0.74
4.00
1.01
3.91
0.66
1.00
0.02
0.02
0.02
% Chg
YTD
4.87
-5.73
0.29
-4.61
5.15
-0.93
16.12
7.25
-2.31
0.11
1.79
4.83
-4.82
-1.66
2.51
-2.61
-1.53
-7.61
1.18
-1.98
6.37
-4.27
-6.44
14.23
20.24
2.65
13.61
-1.66
-2.07
4.56
7.69
5.56
-10.00
Note : The above data based on Bloomberg consensus.
Disclaimer
The information in this report has been obtained from sources believed to be reliable. Its accuracy or completeness is not guaranteed and opinions are subject to change without notice.
This report is for information only and not to be construed as a solicitation for contracts. We accept no liability for any direct or indirect loss arising from the use of this document.
We, our associates, directors, employees may have an interest in the securities and/or companies mentioned herein.
for TA SECURITIES HOLDINGS BERHAD (14948-M)
MENARA TA ONE, 22 JALAN P. RAMLEE, 50250 KUALA LUMPUR, MALAYSIA TEL: +603-20721277 / FAX: +603-20325048
(A Participating Organisation of Bursa Malaysia Securities Berhad)
Kaladher Govindan – Head of Research
Page 3 of 3
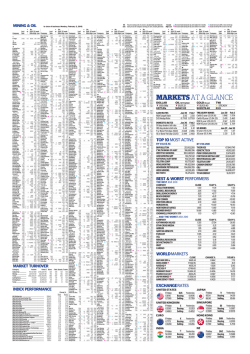
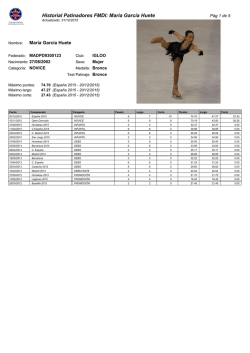
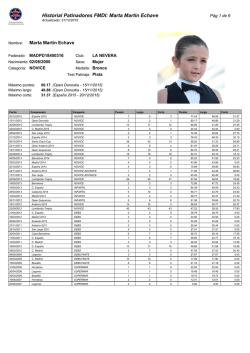
© Copyright 2026