
Iron Isotope Constraints on the Photo
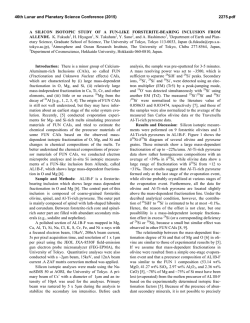
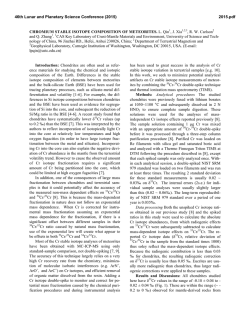
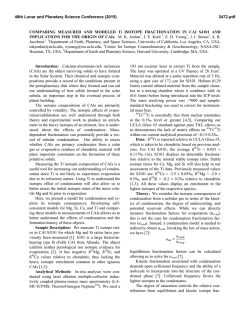
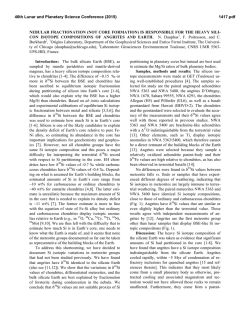
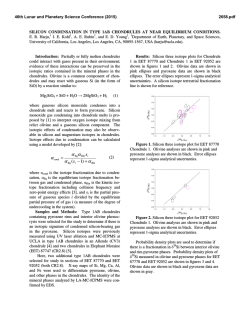
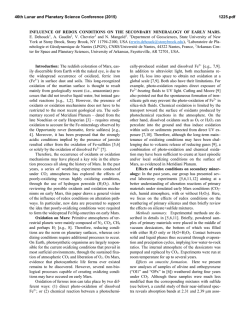
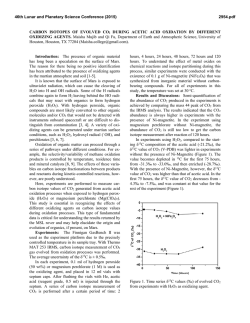
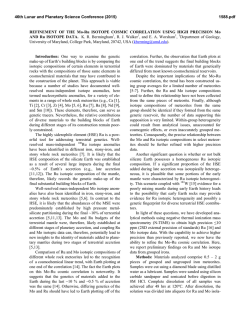
46th Lunar and Planetary Science Conference (2015)
2635.pdf
IRON ISOTOPE CONSTRAINTS ON THE PHOTO-OXIDATION PATHWAY TO BIF FORMATION. N.
X. Nie1 and N. Dauphas1, 1Origins Lab, Department of the Geophysical Sciences and Enrico Fermi Institute, The
University of Chicago, Chicago, IL 60637, USA ([email protected]).
Introduction: Banded iron formations (BIFs) and
associated lithologies are among the most important
sedimentary rocks in the Archaean and Paleoproterozoic. They have been used to constrain the redox state,
biological activity and seawater chemistry on the ancient Earth. BIFs consist of alternating thin layers of
iron-rich minerals (most often magnetite and hematite)
and iron-poor silica. The iron source was probably
hydrothermal ferrous iron Fe(II) [1-3], which was oxidized into Fe(III) and precipitated.
Several mechanisms have been considered to explain the oxidation of iron in an atmosphere/hydrosphere that was globaly anoxic. Some local
“oxygen oasis” could have been produced by photosynthesis in cyanobacteria [4, 5]. Another biogenic alternative is that Fe(II) was used directly as electron donor
by microorganisms during a process known as anoxygenic photosynthesis [6, 7]. However, definitive evidence of bacteria involvement in BIF formation is still
missing [8], and a pure chemical process, photooxidation, has been proposed as a possible Fe(II) oxidation pathway [9, 10]. To investigate whether photooxidation could have played a role in BIF formation,
we performed laboratory photo-oxidation experiment
and measured Fe isotope fractionation during this process. Comparison of experiment results with BIF compositions allow us to test the viability of photooxidation as an oxidation pathway in the Archean
ocean.
Methods: About 350 mL of H3BO3-NaOH buffer
solution at a pH of ~7.3 was added to a 500 mL borosilicate glass reaction vessel, and bubbled with highpurity argon gas (O2 < 0.1 ppm) for 3-4 h. After the
dissolved oxygen was fully evicted, Fe(II) was introduced through one of the three inlets to the reaction
vessel by dissolving salts of (NH4)2Fe(SO4)2.6H2O in
deoxygenated water. The final concentration of the
Fe(II) was around 100 ppm, or 1.8 mM, which is
equivalent to the Fe production of some modern deep
sea vents [11].
A 450 watt Hanovia medium pressure Hg lamp was
inserted into the center of the reaction vessel to irradiate the Fe(II) solution. The lamp delivered a broad UV
spectrum of 220-1370 nm. Around the lamp, an immersion well connected to a chiller was used to keep the
system from over-heating. A thermometer was inserted
into one of the inlets of the reaction vessel to monitor
temperature.
One inlet to the reaction vessel was used to sample
the solutions. One sample consisted of ~ 7 mL solution
aliquot taken with a syringe. A sample was taken before turning on the UV lamp. Another four 7 mL solutions were collected at different times after the UV
lamp was turned on. The time interval between samples
was about 30 min. While still in an anoxic atmosphere,
the samples were filtered with 0.1 μm Sartorius™
Minisart™ HF syringe filters to separate aqueous
Fe(II) from Fe(III) precipitates. The collected Fe(II)
and Fe(III) samples were dried and re-dissolved in 6 M
HCl. Iron column chemistry was done to eliminate matrix elements. Analyses of Fe isotopic compositions
were performed with a Thermo Scientific Neptune Plus
MC-ICPMS at the University of Chicago using previously established methods [12].
Results: Fe(II) concentration dropped from 90 ppm
to 15 ppm over a 2 hour duration, pH decreased by
~0.2 units, and temperature increased from room temperature to 45 °C. Orange-coloured Fe(III) particles
formed and precipitated. The three-isotope plot of
Fe(II) samples, Fe(III) samples, and geostandard BIR1a and AGV-2 give a fractionation line with a slope of
1.47 for δ' 57Fe vs. δ' 56Fe (Fig. 1). Ferric iron samples
plot on the heavy isotope-rich side of the line while
Fe(II) samples fall on the other side. The δ56Fe values
of both Fe(II) and Fe(III) decreased as the experiment
proceeded.
Throughout the experiment, the δ56Fe values of the
Fe(II) solutions and Fe(III) precipitates exhibit apparent Rayleigh-type behavior, as shown in Fig. 2. The
isotope fractionation between Fe(III) precipitates and
aqueous Fe(II) for the overall reaction is 1.2 ‰.
Discussion: In our experiment, Fe(III) precipitates
were always enriched in the heavy isotopes of iron,
which is consistent with results reported in an earlier
paper [13] for low-pH photo-oxidation of aqueous
Fe(II). However, the fractionation factor α (~1.0025 at
41 °C) measured by them is notably higher than ours
(~1.0012 at 45 °C). The difference might be due to the
different photo-oxidation mechanisms at distinct pH
conditions with different ligands in solutions.
The fact that the solution and precipitates follow a
Rayleigh fractionation model demonstrates that the
produced Fe(III) precipitates do not exchange or significantly exchange with the Fe(II) solution after formation. The 1.2 ‰ fractionation between Fe(III) particles and aqueous Fe(II) is similar to that obtained in
anoxygenic photosynthetic oxidation of Fe(II) (~1.5
46th Lunar and Planetary Science Conference (2015)
2635.pdf
‰) [14] and in O2-mediated oxidation (~1 ‰) [15].
Since the hydrothermal fluids have zero or slightly
negative δ56Fe values [16], all the three fractionation
factors would result in isotopic compositions for
Fe(III) precipitates that cover the range of values
measured in BIFs. Therefore, there is still no unambiguous isotope evidence indicating that BIFs formed either microbially or photochemically.
Fig. 3: Mass-dependent isotope fractionation lines for
different laws, expressed as deviations from exponential law (n = 0), n = -1 for equilibrium law, n = 1 for
power law, and n = -1/2 for Rayleigh law. Olive
squares are the data points obtained from the photooxidation experiment.
Fig. 1: Mass-dependent isotope fractionation line for
Fe photo-oxidation. δ' is calculated as ln (δ /1000 + 1).
Fig. 2: Rayleigh fractionation behavior of the photooxidation samples. Predicted trendlines for both Rayleigh and equilibrium fractionation are shown. 1.0012
was used as the Rayleigh fractionation factor (α). For
equilibrium fractionation trends, a fractionation of
1.69 ‰ between Fe(III) and Fe(II) was used.
A possible way to isotopically test the Fe oxidation
mechanisms would be to use mass fractionation laws,
because different geological processes may follow different laws. Fig. 3 shows possible Fe isotope fractionation laws. Due to the large error bars of the current
measurements, the underlying law cannot be clearly
recognized. Further work must be done to reduce the
errors and to measure the isotopic compositions of
BIFs with high precision.
Conclusion: Our experiment reveals that Fe(III)
oxides in BIFs could have been produced by photooxidation, a completely abiotic process. The process
follows a Rayleigh fractionation model, and isotope
fractionation between Fe(III) precipitates and aqueous
Fe(II) for the overall reaction is ~1.2 ‰ at 45 °C. This
fractionation is similar to that of anoxygenic photosynthetic oxidation and of O2-mediated oxidation, and
therefore cannot be ruled out as a possible pathway to
BIF formation. The only argument put forward against
photo-oxidation [17] is curcumstantial and a more direct demonstration of the involvement of biology in
BIF precipitation is still missing.
References: [1] Holland H. D. (1973) Econ. Geol.,
68, 1169–1172. [2] Jacobsen S. B. and Pimentel-Klose
M. R. (1988) EPSL, 87, 29–44. [3] Bau M. et al.
(1997) J. Geol., 121–129. [4] Cloud P. E. (1965) Science, 148, 27–35. [5] Cloud P. (1973) Econ. Geol., 68,
1135–1143. [6] Garrels R. M. et al. (1973) Econ.
Geol., 68, 1173–1179. [7] Widdle F. (1993) Nature,
362, 834–836. [8] Klein C. (2005) Am. Mineral., 90,
1473–1499. [9] Cairns-Smith A. G. (1978) Nature,
276, 807–808. [10] Braterman P. S. et al. (1983) Nature, 303, 163–164. [11] Edmond J. M. et al. (1982)
Nature, 297, 187–191. [12] Dauphas N. et al. (1982)
Chem. Geol., 267, 175–184. [13] Staton S. et al.
(2006) AGU, Abstract #V44A-04. [14] Croal L. R. et
al. (2004) GCA, 68, 1227–1242. [15] Bullen T. D. et
al. (2001) Geology, 29, 699–702. [16] Dauphas N. et
al. (2004) Science, 306, 2077–2080. [17] Konhauser,
K. O. et al. (2007) EPSL, 258, 87–100.
© Copyright 2026