
ConsumersqActivism: the Facebook boycott of Cottage Cheese"
Consumers’Activism: the Facebook boycott of Cottage Cheese
Igal Hendely
Saul Lachz
Northwestern University
The Hebrew University and CEPR
Yossi Spiegelx
Tel Aviv University, CEPR, and ZEW
January 28, 2015
Abstract
We study a consumer boycott on cottage cheese that was organized in Israel on Facebook
in the summer of 2011 following a steep increase in prices after price controls were lifted in
2006. The boycott led to an immediate decline in prices which stayed low more than three
years after the boycott. We …nd that (i) demand at the start of the boycott, at the new low
prices, would have been 30% higher but for the boycott, (ii) own price elasticities and especially
cross price elasticities increased substantially after the boycott, and (iii) post-boycott prices
are substantially below the levels implied by the post-boycott elasticities of demand, suggesting
that …rms lowered prices due to fears of the boycott spreading to other products, of new price
controls, and of possibly class action law suits.
JEL classi…cation numbers: L1, D12
Keywords: consumer boycott, social media, price elasticities
We thank Andrea Ichino, Tim Feddersen, Alessandro Gavazza, Manuel Trajtenberg, Christine Zulehner and
seminar participants at The Hebrew University, The London School of Economics, the 2014 “The Economics of
Information and Communications Technologies” conference in Paris, the 2014 IIOC meetings in Chicago, the JIECEPR applied Industrial Organization in Athens, and the 2014 Economics of ICT conference in Mannheim for useful
comments. We also thank Dan Aks and Max Bocharenko for excellent research assistance. Saul Lach gratefully
acknowledges …nancial support from The Israel Science Foundation (Grant No. 858/11) and from the Wolfson
Family Charitable Trust.
y
Department of Economics, Northwestern University, 2001 Sheridan Road, Evanston, IL 60208, e-mail:
[email protected].
z
Department of Economics, The Hebrew University, Jerusalem 91905, Israel, e-mail: [email protected].
x
Recanati Graduate School of Business Administration, Tel Aviv University, Ramat Aviv, Tel Aviv, 69978, Israel.
email: [email protected].
1
1
Introduction
Social media such as Facebook and Twitter seem to play an increasingly important role in facilitating political mobilization. For instance, the 2009-2010 Iranian election protests and the 2011
uprisings in Egypt and Tunisia are often referred to as “the Facebook revolution” or “the Twitter
revolution” (see e.g., Andersen, 2011).1 Recently, some commentators have argued that social media can also become a powerful tool for consumers to press …rms to lower prices or act in a socially
responsible manner (Taylor, 2011, and Mainwaring, 2011). This possibility has far reaching implications for business strategy and for regulation. For instance, if consumers can indeed discipline
…rms, then antitrust authorities should be less concerned with the adverse e¤ects of market power
when they review horizontal mergers or examine vertical restraints.2
We study a consumer boycott that was organized in Israel on Facebook during the summer
of 2011 and that was intended to pressure …rms to lower their prices. The price of cottage cheese,
which is a staple food in Israel, increased by 43% since deregulation in 2006 (The Knesset Research
and Information Center, 2011). Following this steep increase, and the ensuing extensive news
coverage, a Facebook event calling for a boycott of cottage cheese was created on June 14, 2011,
demanding a price reduction from about 7 NIS to 5 NIS per 250 grams container.3 The Facebook
event was an instant success: a day after it started nearly 30; 000 Facebook users joined it; by June
30, the number surpassed 105; 000. The boycott was also a success as the average price of cottage
dropped by 24% virtually overnight, and it remains well below the 2011 price even today, more
than 3 years after the boycott.
Using daily, store level, data from all supermarkets and most grocery stores in Israel, we
estimate a demand system which we use to quantify the harm in‡icted on …rms by the boycott, to
study its long-run impact on demand and, …nally, to understand …rms’reactions to the boycott.
Our main …ndings are the following. First, we use the estimated demand functions to
compute counterfactual sales during the boycott. Given the new low prices, demand at the start of
the boycott would have been 30% higher but for the boycott. The boycott in‡icted a substantial
burden on …rms. On the other hand, we …nd that the impetus of the boycott …zzled within a couple
of weeks, despite the fact that the boycotters’demands were never met in full.
Second, the boycott had a long lasting impact on demand. We compare estimated de1
Facebook and Twitter also played an important role in facilitating protests in Bulgaria, Turkey, Brazil, and
Bosnia in 2013 (e.g., Faiola and Moura, 2013). For recent papers that study the e¤ect of social networks on political
participation in various countries see Acemoglu, Hassan, and Tahoun (2014), Iskander (2011), Breuer (2012), Enjolras,
Steen-Johnsen, and Wollebaek (2012), Tufekci and Wilson (2012), Valenzuela, Arriagada, and Scherman (2012), and
Gonzalez-Bailon and Wang (2013). There is also a recent literature that studies the link between the internet and
voters turnout in elections in di¤erent European countries (e.g. Miner (2012), Czernich (2012), Falck, Gold, and
Heblich (2013), Campante, Durante, and Sobbrio (2013), and Gavazza, Nardotto, and Valletti (2015).
2
For analysis of self regulation see Harrison and Scorse (2010) and Abito, Besanko and Diermeier (2013).
3
See https://www.facebook.com/events/203744079670103/
2
mand before and after the boycott. We …nd substantially higher own and –especially– cross price
elasticities after the boycott, possibly re‡ecting increased price awareness and more willingness to
substitute across brands. Interestingly, the increased price elasticities in‡ict an additional harm
on …rms (as higher price sensitivity translates into lower prices). While the higher elasticities were
probably not one of the intended goals of the organizers, they may end up being an e¤ective channel
for curbing prices.
Third, using the demand estimates and …rst order conditions we consider the sources of price
decline. We …nd that only a fraction of the observed decline can be explained by the increased
elasticities. We posit that fear of the boycott spreading over time and to other products, as well as
the fear of further price controls and possibly class action law suits, played a role in the observed
price changes.
The last …nding highlights the limitations of using …rst order conditions, and elasticities, to
capture …rms’ incentives. This traditional Industrial Organization approach may miss important
elements of the business environment, which a¤ect …rm behavior. Reputation, image, as well as
political consequences, are part of the additional considerations that appear to have shaped pricing,
but are not captured in the traditional analysis.4
The additional considerations that appear to have in‡uenced …rms (fear of the spread of
the boycott, of re-regulation, etc.) also constitute the main di¤erence between our paper and
other papers studying consumer boycotts. Most of these papers study “proxy boycotts,” namely,
boycotts in which …rms are punished as a proxy for their country of origin. Proxy boycotts have a
fundamentally di¤erent underlying cause than boycotts intended to curb market power, and, more
importantly, have little implications for business strategy and public policy, as …rms cannot do much
to avert the harm. The cottage boycott, instead, was geared to counter market power.5 Consumer
activism on social media was apparently able to discipline …rms and had a long lasting impact
on business strategy. For example, in January 2013, the Chief Marketing O¢ cer of Tnuva (the
market leader) said in the annual meeting of the Israel Marketing Association that “The cottage
cheese crisis taught us a lesson of modesty and humility”and in July 2013, Tnuva’s CEO said that
“The cottage protests caused Tnuva to emphasize the opinion of the consumer and his needs. Part
of this policy is putting cottage under self-regulation.” The notion of self regulation seems to be
4
There is already a small empirical literature that examines the idea that …rms may restrain their prices to curb
public pressure for regulatory intervention. For example, Ellison and Wolfram (2006) …nd evidence that pharmaceutical companies possibly altered their price increases during the early years of the Clinton Administration to
forestall potential regulatiory intervention. Similarly, Stango (2006) reports that credit card issuers lowered interest
rates following threatened legislation to cap rates. The regulation threat is not captured by the standard …rst order
conditions either.
5
The cottage boycott is an example of private politics (e.g., Baron and Diermeier, 2007) where dairy manufacturers
and retailers seem to be self regulating due to consumers’activism, as in the Bank of America, Wells Fargo, JPMorgan
Chase, and SunTrust cases mentioned in the text.
3
working: the ministry of Agriculture and Rural Development decided to re-regulate the price of
“white cheese”(a close substitute for cottage cheese, that was deregulated around the time cottage
cheese was deregulated) as of the start of 2014 due to “exceptional pro…tability,”but found no need
to re-regulate the price of cottage cheese for the time being because it did not …nd “unreasonable
pro…tability as in the past.”6 The cottage boycott demonstrates that consumers can indeed get
organized on social media and apply pressure on manufacturers and retailers to lower prices.
A necessary condition for the success of a consumer boycott is that activists or organizers
garner the support of a group of followers who feel strongly enough about the issue.7 Unlike many
other consumer boycotts, which are organized by interest groups (like Greenpeace), the cottage
boycott did not have organized backing. Social media was essential for getting the message out and
coordinating action. Moreover, boycotts are susceptible to a commons problem: consumers realize
that unless others join the cause, their personal sacri…ce is futile. Social media like Facebook and
Twitter can credibly convey the number of followers rallying behind the cause and hence encourage
others to join.
The boycott’s impact was not uniform across the country. We correlate the impact of
the boycott on demand with demographic variables and …nd that the boycott’s negative impact
on demand was stronger in areas with more educated and less religious population and was also
stronger in areas where more households had a PC, a mobile phone, and Internet connection. We
also …nd that the increase in demand elasticities was more pronounced in such areas. To the extent
that our demographic variables are correlated with exposure to social media, our results suggest
that the boycott impact on demand was stronger in areas with higher exposure to social networks.
Even though our demographic variables do not reveal the causal e¤ect of social media on the
boycott’s impact because they are also correlated with unobserved factors that a¤ect demand, the
correlations are nonetheless sensible and validate the estimated impact of the boycott on demand.
To the best of our knowledge, our paper is the …rst to study boycotts intended to curb …rms’
exercise of market power, and to directly quantify the boycott’s impact on actual sales (revenue).
A recent example of a consumer boycott aimed at curbing …rms’pricing, also organized via social
media, is the 2011 boycott on Bank of America, Wells Fargo, JPMorgan Chase, and SunTrust
following their plan to charge a $5 monthly fee on debit cards.8
6
The ministry stated however that it will continue to monitor the pro…tability of cottage cheese and it does not rule
out re-regulation should its pro…tability become “unreasonable” (http://www.moag.gov.il/NR/exeres/E911B43C9BAD-488D-8493-A27069275754,frameless .htm?NRMODE=Published).
7
Public outrage is one of the four factors Diermeier (2012) mentions as necessary for a boycott’s success: (i)
customers must care passionately about the issue, (ii) the cost of participation must be low (relatively small sacri…ce
by consumers), (iii) the issues must be easy to understand, and (iv) the boycott should be widely covered in the mass
media.
8
A month after the boycott started, Bank of America announced that “We have listened to our customers very
closely over the last few weeks and recognize their concern with our proposed debit usage fee...
As a result,
we are not currently charging the fee and will not be moving forward with any additional plans to do so.” See
4
Perhaps for lack of …rm-level data, most of the empirical literature on consumer boycotts
examined stock market price reactions. Stock market studies (Friedman (1985), Pruitt and Friedman (1986), Pruitt, Wei, and White (1988), and Davidson, Worrell, and El-Jelly (1995), Koku,
Akhigbe, and Springer (1997), Teoh, Welch, and Wazzan (1999), Epstein and Schnietz (2002)) …nd
mixed evidence for boycott e¤ects.9 Our paper, in contrast, uses daily, store-level data on prices
and quantities sold allowing us to study the direct e¤ect of the boycott on store-level sales.
A few papers study the e¤ects of calls for consumer boycotts on …rms’sales. These papers,
however, exclusively study proxy boycotts, where there is little room for …rms’reactions. Bentzen
and Smith (2002) study how sales of French wine in Denmark was a¤ected by a call for a boycott
of French products in response to the French nuclear testing in the South Paci…c in 1995
1996;
Chavis and Leslie (2009) and Ashenfelter, Ciccarella, and Shatz (2007) study whether French wine
was boycotted in the U.S. following the French opposition to the Iraq war in early 2003; Hong et
al. (2011) study the boycott of French automobiles in 2008 in China following the disruption of the
Olympic torch relay in Paris in April 2008 and the French President’s decision to meet with the
Dalai Lama in late 2008; and Clerides, Davis, and Michis (2013) study the e¤ect of anti-American
sentiment (but not an open boycott) caused by the 2003 Iraq war on sales of U.S. soft drinks and
laundry detergents in 9 Arab countries.10
The paper is organized as follows. In Section 2 we describe the background leading to
the boycott. Section 3 introduces the data, while Section 4 describes the evolution of prices and
quantities and demand. In Section 5 we test whether price elasticities changed after the boycott.
In Section 6 we look at the e¤ect of demographics proxying for social networks. In Section 7 we
examine how …rms incentives were a¤ected. Conclusions appear in Section 8.
2
Background
Cottage cheese is a staple food and one of the best-selling food products in Israel. It is sold in
various milkfat contents and ‡avours, though by far, the most popular variety is the plain 5% fat
content which accounts for about 80% of sales. The closest substitute for cottage cheese is a fresh,
soft, spreadable white cheese. In 2010, 31; 027 tons of cottage cheese and 45; 960 tons of white cheese
(including all fat contents) were sold in Israel (Israeli Dairy Board, annual reports for 2011).
http://www.nytimes.com/2011/11/02/business/bank-of-america-drops-plan-for-debit-card-fee.html?_r=0
9
More recently, Fisman, Hamao, and Wang (2014) …nd that adverse shocks to Sino-Japanese relations in 2005 and
2010 had a negative e¤ect on the stock prices of Japanese …rms with high China exposure and on Chinese …rms with
high Japanese exposure. They also …nd a larger negative e¤ect on Japanese …rms operating in industries dominated
by Chinese state-owned enterprises, but a smaller e¤ect on …rms with high Chinese employment.
10
Fershtman and Gandal (1998) use product-level data to study the e¤ect of the Arab boycott on Israel on consumer
and producer welfare in the Israeli automobile market. This boycott however was imposed by Arab countries on
Japanese car manufacturers rather than by consumers.
5
Cottage cheese is produced in Israel by three large dairies (there are no imports due to high
tari¤s)11 : Tnuva, Strauss, and Tara, three of the four largest food suppliers in the country.12
Until July 2006, the prices of 20 dairy products (cottage cheese both 5% and 9%; fresh milk,
cream, sour cream, semi-hard cheese, and dairy desserts) were controlled by the government.13 From
July 2006 to June 2009, the government gradually deregulated the prices of 10 of those products,
including cottage and white cheese, leading to sharp increases relative to the CPI.
Figure 1 shows the evolution of the monthly average price of a standard container of 250
gram of 5% cottage cheese from January 1999 to May 2011 (just before the start of the cottage
boycott).14 Figure 1 also shows the prices – relative to January 1999 – of raw milk and wages in
the food industry, two of the main cost drivers of cottage cheese (plotted on the right hand side
axis).
11
Until 2013, the e¤ective tari¤ on fresh cheese was 126%. Following the cottage boycott, the government decided to
lower this tari¤ gradually from 2013 onward. See http://taxes.gov.il/customs/Documents/Mekach/help%201696.pdf
12
As of 2011 Tnuva had a market share of almost 57% in the dairy market, the Strauss Group almost 23%, and
Tara 10%.
13
The 20 regulated dairy products accounted for about 30% of the total expenditure on dairy products (State
Comptroller of Israel, 2012, p. 36). These prices were set by a Government committee that consists of two representatives from the Ministry of Finance and two representatives from the Ministry of Agriculture. The committee sets
prices such that dairy producers can cover their costs and earn a rate of return of 6%
12% on their invested capital.
Prices were updated every 12 month or earlier if input prices change by more than 3%. For more details, see State
Comptroller of Israel (2012).
14
The price plotted in the …gure is based on monthly prices of cottage cheese collected from a cross-section of stores
in Israel by the Central Bureau of Statistics for the purposes of computing the monthly CPI. The …gure plots the
cross-sectional mean of prices. The data in the …gure come from Ofek (2012).
6
1.6
7
Jan11
Jan10
Jan09
Jan08
Jan07
Jan06
Jan05
Jan04
Jan03
Jan02
Jan01
Jan00
Jan99
4
1
1.2
1.4
Raw milk and wages
Cottage cheese 5% 250gr
5
6
Cottage cheese 5% 250gr
Wages in food industry, Jan 1999=1
Raw milk, Jan 1999=1
Vertical line marks price cap removal on July 30, 2006
Figure 1: Cottage cheese and input prices
As the …gure shows, the price of cottage cheese hovered around 4:5
5 NIS until its dereg-
ulation on July 30, 2006. Following deregulation, the price increased sharply, reaching 7 NIS on
the eve of the boycott. This represents a 43% increase between July 2006 and May 2011. By
comparison, the consumer price index increased by 12%, and the mean price of regulated dairy
products increased by 10% over the same period (State Comptroller of Israel, 2012, p. 34). The
price of raw milk also increased sharply in 2007, and this can account for part of the steep rise in
the price of cottage cheese.15 However, the decline in the price of raw milk, which started at the
end of 2008, was not passed-through to cottage prices. Wages exhibited less ‡uctuations over time,
increasing by about 11% during the post deregulation period. Thus, only part of the price increase
of cottage cheese after deregulation can be attributed to increases in input prices.16
15
The cost of raw milk accounted for 36:5% of the retail price of cottage cheese in January 2006 and 27:8% of the
price of cottage cheese in June 2011 (see The Knesset Research and Information Center, 2011).
16
For more details on the e¤ect of deregulation on the prices of dairy products see Ofek (2012).
7
2.1
The Cottage boycott
In general, food prices in Israel increased substantially since 2005.17 Starting on May 31, 2011, a
series of articles, describing this surge in food prices, as well as the general high cost of living in
Israel, were published in newspapers and on TV.18 The news reports were followed by a sequence
of events summarized in Appendix A.
On June 14, 2011, a Facebook event was created calling for a boycott of cottage cheese,
starting on July 1, 2011. The Facebook event was widely covered by radio, TV, and newspapers.
A day after the Facebook event started, nearly 30; 000 Facebook users joined, and three days later,
the number grew to 70; 000. By June 30, 2011, the number surpassed 105; 000. As a result of
this success, the event leaders announced on June 16, 2011 that the boycott will start immediately
rather than on July 1, 2011, and recommended buying cottage and white cheese only if their prices
drop under 5 NIS.
The e¤ect of the boycott was almost immediate: several supermarket chains started, already
on June 14, to o¤er cottage cheese and other dairy products at a special sale price.19 The protest
leaders, however, argued that they will not stop the protest until the price of cottage falls permanently under 5 NIS. Some politicians and Government ministers also called for various measures to
control food prices.
On June 24, the chairperson of Tnuva’s board, announced in a TV interview that Tnuva
will not unilaterally lower its cottage cheese prices.20 Following the interview, three new groups
formed on Facebook calling to boycott Tnuva’s products. In response to the new threats, Tnuva
lowered the wholesale price of cottage cheese to 4:55 NIS, and soon after, the Strauss Group and
Tara followed suit.
On July 2011, the “tents protest” which also started on Facebook led thousands of people
to set up tents in the center of cities around the country to protest the rising cost of living and
17
The cumulative annual growth rate of food prices in Israel between September 2005 and June 2011 was 5%,
compared with 2:1% for the period January 2000 and September 2005 and compared with 3:2% in the OECD
countries for the 2005-2011 period (see the Kedmi Committee report, 2012, p. 8).
18
The
stories
were
…rst
published
in
the
evening
…nancial
newspaper
Globes,
see
http://www.globes.co.il/news/article.aspx?did=1000655975 though other newspapers and TV news soon followed.
19
For instance, Rami Levy, which is a hard discount chain, announced that they will o¤er Tnuva,
Strauss, and Tara Cottage cheese for a few days at a special price of 4:90 NIS, instead of the regular price of 6:50 NIS, and Shufersal, which is the largest supermarket chain in Israel, announced a
special “buy one get one free” sale for a few days on Tnuva and Tara Cottage cheese for shoppers
who spend more than 75 NIS. See http://www.calcalist.co.il/marketing/articles/0,7340,L-3520937,00.html and
http://www.ynet.co.il/articles/0,7340,L-4082055,00.html
20
Speci…cally, the chairperson said that Tnuva will agree to lower its prices only if both dairy farmers, supermarkets, and the government will contribute to the price reduction. See http://qa-galatz.scepia-sites.co.il/1404-38999he/Galatz.aspx
8
demanding social justice. Motivated by the protest, the student associations in 12 colleges and
universities announced at the beginning of September 2011, that they intend to boycott Tnuva
until it lowers its prices.
In response to the boycott, the government appointed on June 27, 2011, a joint committee
to review the level of competition and prices in Israel (the Kedmi Committee). The committee
submitted its recommendations on the dairy market by mid July 2011. Among other things, it
recommended a gradual opening of the dairy market to competition, removing import tari¤s, and
eliminating the exemptions to produce distributors from antitrust action.
On September 25, 2011, the Israeli Antitrust Authority (IAA) raided Tnuva’s o¢ ces, as
part of an open investigation on the extent of competition in the dairy industry. According to the
press, the IAA seized, among other things, a 2008 McKinsey report which advised Tnuva to raise
prices by at least 15% due to inelastic demand.21 Shortly after the raid, on October 2, 2011, the
chairperson of Tnuva’s board announced her resignation, which was followed by price cuts of up to
15% on dozens of products.
3
Data, sample selection, and aggregation
We purchased data from a private company providing data services to the retail sector. The
raw data record the daily transactions of the cottage and white cheese categories in 2; 169 stores
throughout the country, over the period January 1, 2010 - April 30, 2012. Each observation
represents the total quantity and total revenue recorded by the cash register on a speci…c item identi…ed by its unique barcode - in a speci…c store and day. The raw dataset has over 22 million
observations on 339 items over time and across stores. In Appendix B, we describe how we cleaned
the data.
Items vary in terms of physical attributes (weight, ‡avors, fat content, packaging, kashrut
standards, etc.), as well as manufacturer. We restrict attention to the most popular con…gurations:
250 grams containers of plain cottage and white cheese, with 3% and 5% fat content, produced
by the three major manufacturers, which we label A, B and C (we use the terms “brand” and
“manufacturer” interchangeably). These con…gurations account for about 80% of cottage cheese
sales in the original data, and 30% of white cheese sales. After eliminating from the sample
21
See
http://www.haaretz.com/business/trustbuster-raids-tnuva-o¢ ces-questions-chiefs-1.386731
and
http://www.haaretz.com/business/allegations-trustbuster-said-surprised-by-tnuva-s-overt-monopoly-pricing1.389281.
According to a newpaper article from June 2011, Apax Partners asked McKinsey to examine Tnuva’s pricing policies after it acquired Tnuva in January 2008.
Before the acquisition, Tnuva was a cooperative of 620
kibbutzim (collective, mostly agricultural, communities) and moshavim (non-collective agricultural communities).
See http://www.globes.co.il/serveen/globes/docview.asp?did=1000657979&…d=1725 The article also reports that
Tnuva’s chief economist “warned the company that raising prices was liable to blow up in their faces.”
9
1; 008 stores that sell the cheeses in our sample infrequently (two thirds of the deleted stores are
convenience stores),22 as well as 298; 657 observations corresponding to Saturdays (most stores are
closed on Saturday for religious reasons), we are left with 6; 596; 052 observations from 1; 127 stores
over 729 days between January 1, 2010 and April 30, 2012 (excluding Saturdays). The deleted
observations represent about 5% of the total sales.
Since the prices of the 3% and 5% fat varieties of the same brand are highly correlated (the
correlation is above 95% for cottage cheese and around 85% for white cheese), we aggregated the
sales of 3% and 5% cottage cheese and 3% and 5% white cheese of the same brand into a single
product. Hence, our sample includes 6 products: one cottage cheese and one white cheese per brand.
For instance, brand A cottage cheese refers to “brand A cottage cheese of 3% and 5% fat.”In 55%
of the store-date observations, all 6 products are sold. About 75% sell at least 5 products. Thus,
in most observations, most of the products are being transacted, which is not surprising given the
popularity of cottage and white cheeses.
The price per 250 grams (the standard size of a container) of cottage cheese of brand
b = A; B; C, in store s at time t is computed as follows:
pcbst = 250
c
rbst
c ;
qbst
(1)
c
is the total revenue from selling 3% and 5% cottage cheese of brand b in store s at
where rbst
c is the corresponding quantity in grams.23 The price of white cheese, pw , is de…ned
time t and qbst
bst
similarly. These prices can be thought of as the quantity-weighted mean price across all daily
individual transactions (for a given product and store).24
Table 1 shows the business formats of the 1; 127 stores in our …nal dataset.
22
The 1; 008 eliminated stores have less than 2; 000 observations on the 12 items that we study. The logic is as
follows: if a store sells one of the 12 items at least once every weekday (virtually all shops are closed on Saturdays), we
would expect 729 observations per store (the number of days between January 1, 2010 and April 30, 2012 , excluding
Saturdays). And if a store sells all 12 items at least once a day, we should expect 8; 748 observations per store
(12
729). The deleted stores have on average 690 observations (the median is 546), indicating that they sell only a
limited range of cottage and white cheeses and do so infrequently. In addition, we deleted 13 observations that were
duplicated.
23
These prices exhibit a few extreme values due to very low recorded revenues and relatively high quantities sold
and vice-versa. We view these cases as keying errors (typos) and therefore deleted them from the sample. Speci…cally,
we deleted from the sample 15; 682 observations with prices per 250 grams below 3:75 NIS or above 9 NIS; these
observations represent a quarter of one percent of the observations (the bottom and upper 1 percentiles are 4:60 NIS
and 7:90 NIS, respectively).
24
Weighting by quantity will only matter if prices di¤er across transactions within the same day (e.g., due to
quantity discounts), but we are not aware of this happening in cottage and white cheeses. The price of an item not
being sold in a store in a given day is set to missing.
10
Table 1: Distribution of stores
Store Format
Frequency
Percent
Percent of Sales
Convenience Stores
54
5
0.3
Grocery Stores
84
7
0.8
Minimarkets
320
28
8.9
Main Local Supermarket Chains
290
26
28.6
Main HD Supermarket Chains
227
20
36.6
Other HD Supermarket Chains
152
13
24.9
1; 127
100
100
Total
Most stores –46% –belong to the main supermarket chains and these stores are similarly
distributed between hard-discount (HD) and local supermarkets.25 These stores account for 65% of
the sales in our sample. Other HD supermarkets account for only 13% of the stores in the sample,
but for almost 25% of the sales. The smaller store formats (convenience stores, groceries, and
minimarkets), represent 40% of the stores, but only 10% of the sales.26 The largest metropolitan
area in Israel – the Tel Aviv region – accounts for almost a quarter of the stores. The remaining
stores are equally distributed across the rest of the country.
4
Anatomy of the cottage boycott
We now look at prices and quantities. We start with the evolution of prices since they were the
…rst to react to the boycott. We then turn to quantities in order to assess the harm consumers
in‡icted on manufacturers. We later estimate demand functions to assess the impact of the boycott
on demand and examine how demand changes correlate with various demographics proxying for
exposure to social networks.
4.1
Firms’reaction to the boycott: prices
To gain a long-term perspective on how …rms reacted to the boycott, we look at prices during the
entire sample period, by brand.
25
26
Relative to the HD stores, the local stores are smaller, carry fewer products, and tend to have higher prices.
The vast majority of stores in our sample (91%) serve the general public, while 6% of the stores are dedicated to
the orthodox Jewish population.
11
7.5
7
6.5
6
5.5
5
01jan2010
01jul2010
01jan2011
01jul2011
Price A
Price C
01jan2012
01jul2012
Price B
Vertical line indicates June 15
Quantity-weighted mean prices across stores
Figure 2: Daily mean price of cottage cheese by brand
Figure 2 shows the daily, quantity-weighted mean price of cottage cheese by brand.27 Several
points are worth mentioning. First, the prices of the three brands are fairly close to each other,
which is surprising in light of the very di¤erent own price elasticities reported in the next section.
Second, the price responses to the boycott were almost immediate: the quantity-weighted
average price (across all brands) dropped by 24% between June 14 and June 16. We do not know
whether the price concessions were initiated by the manufacturers or by the retailers, although we
will be able to shed some light on this issue below.
Third, the mean prices of all three brands decreased after the boycott started to about 5:50
NIS, close to the boycott organizers’demand of 5 NIS, and remained at the new level until the end
of the sample period.
The immediate price decline may give the impression that the dairies and retailers fully
complied with the demands of the boycott organizers and that the boycott ended (almost) as soon
as it started. However, as described in Section 2.1, not only did the initial boycott remain active
(since demands were not fully met) but additional boycotting groups were organized later in the
27
Prices are computed using equation (1), for each brand b = A; B; C, and averaged across stores using quantity
weights. The price lines are not smooth because the weights change on a daily basis, even though prices change less
frequently. These prices are consistent with the Central Bureau of Statistics data shown earlier in Figure 1.
12
summer of 2011.
We now take a closer look at the price responses. Figure 3 zooms in on the period May
15 to July 15 (i.e., from one month before to one month after the boycott started), and plots the
quantity-weighted mean price by store formats. The swift decline in prices occurred mainly at the
supermarket chains where prices dropped from June 14 to June 16 by 33% in the hard-discount
stores belonging to the main supermarket chains, 24% in the non-HD stores belonging to the main
supermarket chains, and 15% in the hard-discount stores which belong to smaller supermarket
chains. By contrast, the price reaction of the smaller formats (convenience stores, groceries, and
minimarkets) lagged by about 10 days and was substantially smaller, with prices dropping between
June 14 and June 30, by 16% in convenience stores, 15% in groceries, and 18% in minimarkets.
Grocery Stores
Minimarkets
7
6
5
09jul2011
25jun2011
11jun2011
28may2011
14may2011
09jul2011
25jun2011
11jun2011
28may2011
14may2011
09jul2011
25jun2011
11jun2011
28may2011
5
6
7
8
Main local supermarket chain Other HD supermarket chain Main HD supermarket chain
14may2011
Mean price of cottage cheese
8
Convenience Stores
Mean price of cottage cheese
vertical line indicates June 15
quantity-weighted mean prices across stores and brands
Figure 3: Mean price of cottage cheese by store format around the boycott period
Figure 4 shows the standard deviation of prices by store format It is clear that the price cuts
documented earlier varied a lot across stores even within the same store format. This is particularly
so within the group of supermarkets, especially those that belong to the main supermarket chains.
13
Grocery Stores
Minimarkets
0
.5
1
1.5
Main local supermarket chain Other HD supermarket chain Main HD supermarket chain
09apr2011
23apr2011
07may2011
21may2011
04jun2011
18jun2011
02jul2011
16jul2011
30jul2011
13aug2011
09apr2011
23apr2011
07may2011
21may2011
04jun2011
18jun2011
02jul2011
16jul2011
30jul2011
13aug2011
09apr2011
23apr2011
07may2011
21may2011
04jun2011
18jun2011
02jul2011
16jul2011
30jul2011
13aug2011
0
S.D of cottage price
.5
1
1.5
Convenience Stores
Date
Vertical line indicates June 15, 2011
Figure 4: Standard deviations of cottage cheese price by store format around the boycott period
While we cannot tell from the data whether manufacturers or retailers took the lead in
lowering prices –and keeping them low –there are indications suggesting that large retailers were
the …rst to react to the boycott, while manufacturers only later lowered wholesale prices. First, as
shown in Figure 4, the steep increase in price dispersion following the boycott is consistent with
the stores, rather than the manufacturers, taking the initiative of reducing prices. Second, price
declines were quite uniform across brands within a store, also suggesting that the decision to cut
prices was made at the store (or chain) level rather than at the manufacturer level. Indeed, redoing
Figures 3 and 4 by brand shows essentially the same picture. Third, small retailers have dropped
prices only after the manufacturers publicly announced cuts in their wholesale prices.
A possible explanation why large retailers took the initiative in reacting to the boycott is
that, in light of the attention garnered by the product category, lowering prices worked as a sort of
loss leader. This interpretation is consistent with the evidence mentioned in Section 2.1. According
to public announcements, several large supermarket chains announced special temporary deals as
soon as the boycott started, while Tnuva –the largest manufacturer –announced it would not cuts
prices. Only towards the end of June, after three new groups formed on Facebook calling for the
boycott of all of Tnuva’s products, Tnuva announced wholesale price concessions. The other two
manufacturers –Strauss and Tara –followed Tnuva’s lead.
14
4.2
Consumers’reaction to the boycott: quantities
A key for the success of a boycott is the harm that boycotters can in‡ict on the target. In this case,
there were at least three potential channels through which …rms can be harmed: (i) the immediate
loss of sales, (ii) the risk of the government deciding to re-regulate prices or to introduce market
reforms (such as eliminating various restrictions on imports), and (iii) the risk of class action on
the grounds that prices are excessive.28 The latter is relevant for Tnuva, which was declared a
monopoly in the “milk and milk products” market by the IAA in 1989; the Israeli antitrust law
prohibits a monopoly from abusing its dominant position, among other things, by charging “unfair
prices.”29
While it is hard to quantify the risk of government intervention and the risk of class actions,
we can use our data to examine the direct loss of sales due to the boycott. As it turns out, quantities
dropped only slightly during the …rst week of the boycott, which is not too surprising given the
24% price decline around June 15th. Most of the decline occurred in the smaller store formats
(convenience, grocery stores, and minimarkets), which did not cut prices immediately. The quantity
data however mixes two possibly con‡icting e¤ects: an inward shift in demand due to the boycott
and a downward movement along the new demand curve following the steep price reduction. In
order to disentangle the two e¤ects and infer the boycott e¤ect on demand, we estimate a demand
system and use it to impute the level of demand, given the new low prices, but for the boycott.
While the purchase decision at the household level is a discrete choice – how many units
and what brands to purchase – in the absence of consumer level data, we can only estimate an
aggregate demand system. We could still estimate a discrete choice model of aggregate demand,
but we do not think it is necessary. Discrete choice modeling is handy when the choice set is large,
requiring many parameters to be estimated relative to the available data. In our application the
choice set is quite limited (only six products), while the store-level, daily data provide us with a
large number of observations.
Our basic speci…cation assumes that the demand for brand j at store s in day t is linear in
logs:
log qjst =
sj
j
log pjt +
X
jk
log pkt + xt + "jst ;
k
where
sj
j = 1; 2; 3
k 6= j
(2)
is a brand-speci…c intercept for each store s, xt are exogenous covariates that vary only
over time (day-of-the-week dummies and week dummies), and "jst is an i:i:d: shock.
28
Indeed, the government decided to re-regulate the price of white cheese from January 1, 2014 (see
http://www.moag.gov.il/agri/yhidotmisrad/dovrut/publication/2013/prices_change_jan_2014.htm.)
29
Among other things, the declaration can serve as prima facie evidence for the …rm’s dominant position in any
legal proceeding, including class action law suits. Indeed on July 2011, a class action lawsuit was …lled in the Tel Aviv
district court, alleging that Tnuva has abused its monopoly position; see Mivtach-Shamir Holdings LTD, …nancial
statements for 2011, Sec. 26.1.5 (Mivtach-Shamir Holdings controls Tnuva along with Apax). The document is
available at http://maya.tase.co.il/bursa/report.asp?report_cd=725120
15
Price endogeneity is always a concern when estimating demand functions. First, there is
a cross-sectional concern that stores may be of heterogeneous quality (service, location, product
assortment, etc.), and quality may determine both sales and prices. Ignoring store heterogeneity
may bias the estimated price elasticities. We expect a bias towards zero in the estimated elasticities
because higher prices are associated with higher unobserved quality and therefore more sales. The
structure of our data allows us to control for brand-store …xed e¤ects to deal with this type of
endogeneity at the brand-store level. In addition, there is a time dimension concern if unobserved
demand shocks drive both prices and quantities. We therefore include “day of the week”dummies to
control for within-week consumption variation, and dummies for each of the 121 weeks in the sample
to control, in a very ‡exible way, for main holidays, seasonality and other trends for each brand of
cottage cheese. The price variation used for estimation is, therefore, store-level deviations from the
daily mean price (which itself evolves over time in a ‡exible way) for each brand. Although there
might be an idiosyncratic, store-speci…c, component to these changes, a good part of the price
variation can be traced to national-level changes generated by manufacturers and retail chains.
The variation across stores in price changes is, therefore, related to the timing and speed by which
national price changes are passed through to the local level. Importantly, national brand price
changes are not likely to be driven by changes in store-level demand. Thus, given our understanding
of pricing in this market and using the added controls, we believe that endogeneity of store-level
prices is not a major concern.
Indeed, decomposing the variation of (log) price for each of the three brands we …nd that,
on average, store and week dummies account for 13% and 64% of the total variation, respectively
(the di¤erences across brands is minor). “Day of the week” dummies account for almost nothing.
Thus, most of the variation in prices is over time.30
An additional endogeneity concern, not addressed by store and week …xed e¤ects, is due
to store- or chain-speci…c promotions. While cottage cheese products are not the subject of speci…c promotions (as indicated to us by industry insiders) there are retailer-brand-level promotions
(including cottage cheese), which may create a spurious relation between prices and quantity. We
expect the estimated elasticities to be upward biased (in absolute value), as low prices may capture
promotional activities.
To verify that promotional activity does not substantially a¤ect our estimated elasticities,
we use prices in other cities, prices of other chains in the same city and prices of other chains in
other cities to instrument for prices in equation (2). Instrumenting leads to very limited qualitative
di¤erences; elasticities remain of the same order of magnitude. These estimates are shown in
Appendix E. The IV estimates, however, are sensitive to which speci…c instruments and which
30
Naturally, the week dummies capture the break in prices due to the boycott but, redoing the variance decom-
position for the subperiod before the boycott (before May 15, 2011) and for the subperiod after the boycott (after
October 2, 2011) we …nd that week dummies account for a substantial 27% of (log) price variation.
16
…xed e¤ects are used, and often result in negative cross prices e¤ects.31 For these reasons, we are
more con…dent in our OLS-…xed e¤ect estimator of equation (2), which we adopt for the rest of the
paper. Notice also that our interest is in “before and after” and “across locations” comparisons
that, as long as any potential biases are not systematically di¤erent across these dimensions, our
conclusions remain valid.
OLS-…xed e¤ects estimates of the demand parameters are shown in Table 2 and described
later in Section 5. For now, we only use the estimated parameters for the pre-boycott period
(January 1, 2010 –June 14, 2011) from the basic speci…cation (columns (1)-(3)) to predict quantity
under the pre-boycott demand function at post-boycott prices. Formally, we de…ne the boycott
index at time t as follows:
BI(pt ; qt ) = 100
qt
qb0 (pt )
1 ;
where t is a period after the boycott started, qb0 (pt ) is the predicted quantity under the pre-boycott
demand function at observed prices pt and qt are observed sales at time t.
The index BI(pt ; qt ) captures the gap, in percentage terms, between observed sales and
predicted sales at observed post-boycott prices. It measures how much lower demand in period t is
relative to what it would have been expected at prices pt had the boycott not occurred. Negative
values of the index indicate that sales were below their expected level. The more negative the
index, the more intense the boycott e¤ect is. The BI index proxies foregone sales and will help
us to evaluate the initial impact of the boycott, as well as its evolution throughout the summer of
2011.
Details of the computation of BI(pt ; qt ) are presented in Appendix C. Figure 5 shows
BI(pt ; qt ) from the start of the boycott on June
14, 2011 until the end of August, 2011. For ease of exposition, we show a normalized BI
index obtained by subtracting its value on June 14, 2011.
31
A possible reason for this fragility is that the retail chain information is less reliable than our price data since it
was put together by matching store’s addresses to information available in the Internet on retail chain branches.
17
10
Boycott impact on demand (%)
-20
-10
0
27aug2011
20aug2011
13aug2011
06aug2011
30jul2011
23jul2011
16jul2011
09jul2011
02jul2011
25jun2011
18jun2011
-30
Figure 5: Boycott impact-on-demand index (all brands)
Figure 5 shows an immediate and quite strong e¤ect: sales are much lower than anticipated
given the substantial price reductions. The toll on pro…ts (or revenues) in‡icted on …rms at the
beginning of the boycott is quite serious.
Gradually, the boycott impact diminishes. About six weeks after its start, the boycott e¤ect
all but …zzled out: while sales recovered and surpassed pre-boycott levels due to the lower prices,
they matched the expected demand at observed prices.
Underlying the evolution of the BI index is a downward shift of demand as displayed in
Figure 6. The move from (q0 ; p0 ) to (q1 ; p1 ) represents about a 30% decline in the quantity that
would have been sold at the new post-boycott price p1 with the pre-boycott demand function, qb (p1 ).
Over time, demand shifts gradually outward and the BI index tends to zero. Towards the end of
August 2011, demand reaches point (b
q (p1 ) ; p1 ) on the old demand curve and the BI index then is
zero. As we will show in Section 5, the post-boycott demand curve – passing through (b
q (p1 ) ; p1 )
–is more elastic than the pre-boycott demand curve.
18
Figure 6: The evolution of the BI index
Judging by the evolution of the BI index, …rms rightfully reacted with immediate price
concessions, but then correctly perceived there was no need for further price reductions, despite
the creation of additional boycott groups on Facebook. The public appears to have been satis…ed
with their initial accomplishments.
5
What did the boycott do?
The previous sections show that, by and large, the public rallied behind the boycott organizers,
forcing the three dairies and retailers to cut prices. In this section we examine the lasting impact
of the boycott campaign on demand.
As in most boycotts, the organizers based their argument on claims of unfair business practices in order to motivate the public to join the cause. This animosity can lead to a drop in demand,
a temporary or a long-lasting one, should the reputation of the target …rms be tarnished. As documented in previous sections, demand did decline but, judging by the BI index, only temporarily. In
addition, by raising the public’s awareness to the high prices in the product category, the boycott
may change consumers’shopping habits, possibly inducing them to search more and compare prices
across brands, products, and store formats.32 One would expect increased consumers’ awareness
to translate into higher own and cross price elasticities.
32
Indeed, a consumer survey from August 2011, reported in the press, showed that following the boycott, a third of
the respondents reported that they buy fewer consumer products, including dairy products, and 60% reported that
they search for cheaper products (see http://www.globes.co.il/news/article.aspx?did=1000674348).
19
To examine the lasting impact of the boycott, we use the demand system presented in Section 4.2, to study whether demand changed following the boycott. We estimate variants of equation
(2) interacting each regressor, including the store …xed e¤ects, with a before/after indicator. Thus,
our estimates of the change in price elasticity account for di¤erential e¤ects of the boycott on the
level of sales of di¤erent stores. The sample period is January 1, 2010 until April 30, 2012, excluding
the subperiod May 15, 2011 - October 2, 2011. This subperiod covers the boycott, as well as the
tents protest, and is excluded because we want to use data from periods when consumer preferences
are stable.33 We estimate each equation separately because there are no e¢ ciency gains to joint
(SUR) estimation. Table 2 reports OLS elasticity estimates, controlling for the various …xed e¤ects.
In Columns (1)-(3), we only include cottage cheese prices –own price and the price of the
other two brands. Own (brand) price elasticities are negative and of reasonable size. They increase,
in absolute value after the boycott suggesting that consumers become more price sensitive, though
the increase is statistically signi…cant only for brands B and C. Interestingly, brand A’s own price
elasticity, which did not signi…cantly change after the boycott, is a lot smaller than that of the
other two brands.34 This is interesting because all three brands were similarly priced before the
boycott, despite the large di¤erence in price elasticities. We return to this point in Section 7.
Cross-brand price elasticities are all positive, so that brands are perceived by consumers
as substitutes. The cross-brand elasticities also increase signi…cantly after the boycott: consumers
become more willing to substitute. The increase in cross price elasticities is quite substantial:
the average of the six cross-brand price elasticities, over the three equations, was 0:198 before
the boycott and increased …ve-fold to 1:002 after the boycott. Especially large is the increase in
substitutability between brands A and C.
The change in own and in cross-price elasticities is consistent with the boycott having
increased consumers’ awareness prompting them to engage in more active search for lower prices
and in more substitution across brands.
In Columns (4)-(6) we add the prices of the three brands of white cheese. The number of
observations is reduced by about 23% since many stores do not sell all six products on any given
day. The e¤ect of white cheese prices on the demand (own and cross-brand elasticities) for cottage
is minimal and, in many instances, not signi…cantly di¤erent from zero. In order to use a larger
sample, we omit white cheese prices from the regressions that follow.35
33
We also excluded the subperiod corresponding to a strike at one of the manufacturers (March 18, 2012-April 3,
2012)
34
The …nding that A’s own price elasticity did not change signi…cantly could be the result of a composition e¤ect.
While all buyers (including those of A) may have became more price sensitive if the more price sensitive consumers
migrated away from A, the remaining consumers of A mat be on average no more price sensitive than before the
boycott.
35
Our estimates are robust to di¤erent speci…cations of the model. For example, aggregating the data to a weekly
frequency gives similar estimates of the price elasticities.
20
Table 2: Cottage cheese own and cross price elasticities
Dependent Variable: log quantity
Brand
Constant
Constant
after
Log Price A
Log Price A
after
after
Log Price C
Log Price C
(2)
(3)
(4)
(5)
(6)
A
B
C
A
B
C
9.352
9.578
9.922
10.623
9.694
11.761
-1.426
-1.927
-1.24
-1.382
-1.094
-2.108
-1.564
0.505
-1.283
0.603
0.274
-0.13
Log Price B
Log Price B
(1)
1.548
1.628
-0.289
1.410
1.536
0.108
-3.632
0.114
0.09
-3.446
0.226
0.161
-1.075
0.482
0.147
-0.992
0.289
0.238
-4.300
0.092
0.285
-3.85
0.436
0.569
-0.771
0.372
0.365
-1.931
–
–
–
-0.207
-0.084
-0.166
–
–
–
0.127
0.187
0.521
–
–
–
0.012
0.019
–
–
–
0.009
–
–
–
-0.037
–
–
–
0.074
0.192
1.053
431,954
431,954
431,954
330,907
330,907
330,907
0.88
0.74
0.72
0.87
0.72
0.71
0.031
after
Log Price A white cheese
Log Price A white cheese
after
Log Price B white cheese
Log Price B white cheese
after
Log Price C white cheese
Log Price C white cheese
after
Number of observations
R squared
0.144
0.364
0.003
0.034
-0.019
-0.373
Daily price data are used. The sample period is from January 1, 2010 until April 30, 2012, excluding
the boycott period (May 15, 2011-October 2, 2011) and the period corresponding to a strike at a major
manufacturer (March 18, 2012-April 3, 2012). The coe¢ cients for the interactions with the “after”indicator
represent the additional e¤ect after the boycott. All regressions include “day of the week” and store e¤ects
whose values are allowed to change after the boycott, as well as a set of week dummies to capture weekly
aggregate e¤ects over the sample period. Standard errors clustered at the store level.
*p<0.10; ** p<0.05; *** p<0.01
21
6
Demographics and social networks
Although the boycott led to a swift decrease in the price of cottage cheese all over the country,
the intensity of the boycott and its impact on price elasticities were not uniform across regions. In
this section we examine the reaction of consumers in more detail by correlating the impact of the
boycott on demand and the changes in price elasticities with demographic variables. Some of these
variables (e.g., Internet connection) may serve as proxies for the use of social networks.
The demographic data come from the 2008 Israel Census of Population conducted by the
Central Bureau of Statistics. They correspond, when available, to the statistical area in which
the store is located. A statistical area is a relatively small, homogenous, geographical area (with
population between 2; 000 and 5; 000) within cities, de…ned by the Central Bureau of Statistics
(similarly to census tracts in the US). When we do not have data at the statistical area, the match
is done using demographic data at the subquarter, quarter, or city level.
6.1
Who participated in the boycott?
To examine how the impact of the boycott on demand varied across di¤erent regions, we de…ne for
each store s, the average BI index for that store over the period June 15 –August 31, 2011:
BIs =
Ts
1 X
100
Ts
t=1
qst
qb0 (pst )
1 ;
where Ts is the number of days for which we have price and quantity observations for store s during
the period. The index BIs shows the average daily percentage point decrease in sales of cottage
cheese in store s during June 15 – August 31, 2011 relative to what would have been expected at
post-boycott prices had the boycott not occurred.
We then regressed BIs on six demographic variables measured at the stores’ location; we
run separate OLS regression for each demographic variable (each store is an observation). The
estimated coe¢ cients are reported in Table 3.
22
Table 3: Correlation between BIs and demographics
BIs
Number of
observations
Coe¢ cient of:
% of those aged 15 and over with bachelor’s degree
:658
% of men over 15 who study in a “yeshiva” (religious school)
:195
838
817
% of those aged 65+
:007
886
% of households using a PC
:362
882
% of households with an Internet subscription
:360
882
Average number of mobile phones per household
7:96
882
Standard errors clustered at the statistical area level.
p<0.001
The percentage of the adult population with a bachelor degree is negatively correlated with
the BIs index, while the percentage of the population who study in a religious school is positively
correlated with the BIs index. This means that the decrease in demand for cottage cheese was
stronger in areas with more educated and less religious population. The correlations also indicate
that the boycott e¤ect was stronger in areas where more households had a PC, mobile phones,
and Internet connection. To the extent that these variables are positively correlated with exposure
to social media, these results suggest that the boycott impact on demand was stronger in areas
with higher exposure to social networks. Of course, our demographic proxies do not reveal the
causal e¤ect of social media on the boycott’s impact because they are also correlated with other
unobserved characteristics that are likely to a¤ect quantity demanded. Nevertheless, they seem
to work in the anticipated direction: namely, the impact of the boycott is stronger in locations
where the demographics would suggest that the population was more likely to be exposed to social
networks. This …nding validates our conclusion that the boycott had a negative impact on the
demand for cottage cheese.
6.2
Who was in‡uenced by the boycott?
We now examine whether demand changed di¤erentially by demographic composition. To this end
we estimated the demand functions for each brand of cottage cheese, allowing the elasticities to
vary with demographics, as well as with the boycott. We do this by interacting prices, as well as
the store e¤ects, with two indicators: one for the store’s location being above the median value of
each demographic variable, and the other for the period after the boycott. We can thus assess the
relation between demographics and demand elasticity and, more importantly, the relation between
demographics and changes in elasticities following the boycott.
In Table 4 we report the own-price elasticities for each brand in locations where the corresponding demographic variable – the percentage of households using a PC and the percentage
23
of population aged 15 and over with a bachelor’s degree –is above and below the median, as well
as before and after the boycott. We display above-below and after-before di¤erences and their
estimated di¤erence-in-di¤erence (in the bottom right cell). Results for the other four demographic
variables appear in Table D1 in Appendix D (the underlying estimates of the demand function are
shown in Tables D2-D4).
Table 4: The e¤ect of demographics on cottage cheese own price elasticity
Percentage of households using a PC
Percentage of population with bachelor’s degree
Own-price elasticity A
Own-price elasticity A
Before boycott
After boycott
Below median
1:855
1:923
Above median
1:174
1:376
Above - Below
0:681
After - Before
0:068
0:202
0:547
0:134
Before boycott
After boycott
1:928
2:072
0:144
1:211
1:266
0:055
0:717
Own-price elasticity B
4:067
5:128
1:061
Above median
3:144
4:246
1:102
0:923
0:882
0:041
4:129
3:112
1:017
Own-price elasticity C
4:886
5:343
0:457
Above median
3:453
4:784
1:331
1:433
0:559
0:089
5:047
0:918
4:445
1:333
0:602
0:415
Own-price elasticity C
Below median
Above - Below
0:806
Own-price elasticity B
Below median
Above - Below
After - Before
0:874
4:887
3:503
1:384
5:419
0:532
4:812
1:309
0:607
0:777
Standard errors clustered at the store level. *p<0.10; ** p<0.05; *** p<0.01
Three results are worth mentioning. First, demand is less price elastic in localities with
higher computer usage and with more educated population, both before and after the boycott has
started (the above - below di¤erence is always positive and signi…cant in all but one case).36 Since
higher computer usage and a more educated population are likely to be associated with higher
income levels (we do not have income data), our …ndings suggest, as one might expect, that richer
households were less price sensitive both before and after the boycott has started. Second, the
elasticities of brands B and C increase (in absolute value) after the boycott (the after - before
di¤erence is always negative and signi…cant for brands B and C). In case of brand A, the after before di¤erence is also negative, but it is signi…cant only in one case out of four. Third, there is some
evidence that the (absolute) increase in price elasticity after the boycott was larger in locations with
higher computer usage and with more educated population: the di¤erence-in-di¤erence estimate
is negative for brands B and C (though is not signi…cant for brand B in one of the two cases).
36
In the median location, 17% of the 15+ population has a bachelor’s degree, and 78% of the households use a PC.
24
To the extent that the demographics are correlated with exposure to social media, these …ndings
suggest that locations which are more exposed to social media became more price sensitive after
the boycott. The role of demographics is interesting as it re‡ects di¤erential participation, but also
as a way to validate our estimation, as the implied boycott impact is stronger where it is expected
to be..
7
Firms’Incentives
There are three competing hypotheses for the swift price reductions. First, …rms may have responded optimally to the higher elasticities. Second, …rms were concerned that the boycott might
spill over to other product categories and hence reacted (at least partially) to the boycotters’demands. Third, …rms may have feared public backlash in the form of government intervention in
the market (e.g., re-regulation of prices or elimination of import barriers), of actions taken by the
IAA, or, possibly, in the form of class action lawsuits.
In this section we examine these hypotheses. We start with the potential concern of …rms
that the boycott will spread to other product categories.37 Since white cheese is a close substitute
for cottage cheese and is also produced by the same three dairies, one may see a decline in the
sales of white cheese if consumers were targeting other products besides cottage cheese. However,
it turns out that the quantities of white cheese sold around the start of the boycott do not show
any major unusual patterns; if anything, there is a small increase in quantity sold, just after the
boycott began.
As for prices, Figure 7 shows the distribution of white cheese prices around the time of the
boycott by brand which we compute using equation (1).
37
Indeed, according to the press, the overall sales of Tnuva in some retail chains have dropped by 7%
8% after
the boycott started (see http://www.globes.co.il/news/article.aspx?did=1000682092). Moreover, press reports in
December 2011 reveal that many …rms (manufacturers and retailers) have decided to keep a low pro…le due to the
negative sentiment of the public: “We feel that the public today hates all …rms”, a retail chain executive was quoted
(see http://www.themarker.com/advertising/1.1599266).
25
Figure 7: Distribution of white cheese prices by brand around the boycott period
Figure 7 shows that white cheese prices increased for a few days after the start of the
boycott, perhaps in response to substitution of consumers away from cottage cheese. The price
increases are more pronounced at the lower percentiles of the price distribution. Prices then drop
around the time new groups were formed in Facebook, calling for the boycott of additional dairy
products, speci…cally demanding that the price of white cheese drop to around 5 NIS as well. It
appears that …rms did not initially fear a spillover (they even raised white cheese prices, perhaps in
response to the increase in sales around June 15), but once the boycotters started expanding their
demands to other dairy products, we observe price declines in the white cheese category as well.
Next we turn to the possibility that …rms reacted to the higher elasticities of the demand
for cottage cheese and lowered prices accordingly. Having estimated demand elasticities before and
after the boycott, we can follow the Industrial Organization tradition, and use the price elasticities,
together with …rst order conditions at the product level, to impute markups, before and after the
boycott. This exercise allows us to assess how much of the observed price declined is explained by
the change in preferences (elasticities). The rest of the price decline which cannot be attributed to
changes in elasticities can –as a residual –be interpreted as …rms’reactions to the concern about
public backlash.
Rearranging the …rst-order conditions for pro…t maximization with respect to the preboycott price of brand b, pb , we obtain the standard inverse elasticity rule from which we can
26
back out marginal costs of production for each brand assuming, realistically, that it did not change
following the boycott, and solve for the expected price increase associated with the changes in
demand elasticities.
We begin by assuming that the price of each brand b was set jointly by retailers and the
manufacturer (this is also the case when manufacturers can also use some non-linear price schedule).
Then, the inverse elasticity rule is given by
cost of brand b, and
b
p0b ,
p0b =
0
b
=
1
b
; or pb =
b cb
b
1,
where cb represents marginal
is the pre-boycott own price elasticity.38 This rule implies that cb =
so the post-boycott price of brand b,
where
pb cb
pb
b
1)pb
b
,
should be equal to
0c
b b
0
b
(
1
=
0
b
0
b
(
1
1)
b
pb ;
(3)
b
is the post-boycott own-price elasticity of demand of brand b.
This estimate might in fact be conservative if before the boycott pb was already set below
its pro…t maximizing level due to concerns about public backlash. To see why, note that if pb was
set before the boycott at a fraction
should be cb =
pb (
1)
b
b
, so by (3),
p0b
of its pro…t maximizing level, then the marginal cost estimate
should be higher than the estimate we obtain. This implies in
turn that our estimates of the concern for public backlash after the boycott are, if anything, biased
downward.
Since we did not …nd a signi…cant change in A’s own price elasticity, (3) implies that the
price of brand A should not have changed. In reality though the price dropped by 24%, suggesting
that the price decline of brand A was fully due to an attempt by the management to contain the
potential repercussions of the boycott. As for brands B and C, Table 2 shows that their preand post-boycott price elasticities of demand were
C
= 4:3 and
0
C
B
= 3:632 and
0
B
= 4:707 for brand B, and
= 5:071 for brand C. Plugging these estimates into (3), the post-boycott prices
should have been 8% below the pre-boycott price for brand B and 5% below the pre-boycott price
for brand C. Since this is far less than the 24% actual price decline, we can conclude that the
boycott in‡uenced the pricing of brands B and C above and beyond what was implied by the
higher own-price elasticities of demand.
Our conclusion continues to hold even if the manufacturer of brand b sets the wholesale
price, wb , while the retailers set the retail price, pb . Then, the inverse elasticity rule is pb =
at the retail level, and wb =
38
"b cb
"b 1
b wb
b
1
at the wholesale level, where "b is the elasticity of the wholesale
We estimate constant elasticities demand system, so that elasticity of demand for each brand is independent of
prices. We do not think this creates a problem for the following reasons. First, we estimate di¤erent elasticities before
and after the boycott (prices were substantially higher before the boycott than after). Second, to check the robustness
of our …ndings we also estimated a richer demand system, with the added terms
ij
log pi log pj +
ik
log pi log pk (the
modi…ed demand system can be interpreted as a ‡exible polynomial in logs). The resulting elasticity of demand is
then given by
i
ij
log pi log pj
ik
log pi log pk . Several of the interactions and cross prices elasticity estimates
were not statistically signi…cant, due to high collinearity. However, using the point estimates to compute elasticities
leads to very similar elasticities (less than 1% away) .
27
demand faced by the manufacturer. In Appendix F we show that given our demand system (see
equation (2)), "b =
That is, now
b . Hence, the equilibrium retail price should be pb =
2
b
b
1
replaces
b
b
1
"b cb
b"
b 1
b
1
=
2
b
b
1
cb .
in equation (3). Redoing the computations shows that the
prices of brands B and C should have dropped by only 15:4% and 8:6%, respectively, while the
price of brand A should not have been changed at all. Since the actual prices came down 24%; our
conclusion that the boycott in‡uenced the pricing of all three brands above and beyond what was
implied by the higher own-price elasticities of demand still holds.
The …nding that prices were set substantially below the ones implied by the elasticities of
demand highlights the fact that the tradition of using …rst order conditions to impute markups
may miss important considerations about the business environment, which are not re‡ected in the
demand function. In our case, these missing considerations seems to have been the concern about
public backlash in the form of a damage to …rms’image, the possibility of government intervention
in the market, and the potential for class action lawsuits. Interestingly, we mentioned in Section
2.1 that according to the press, the IAA raid on Tnuva’s headquarters seized a McKinsey report
advising Tnuva back in 2008 to raise prices by at least 15%, due to low elasticity of demand. In
retrospect, it seems that this advice may have contributed to the public backlash. Thus, a message
of this paper is that insofar as pricing decisions are made solely on the basis of demand elasticities,
ignoring features of the business environment, not easily captured by …rst order conditions, may
lead to undesirable outcomes.
8
Summary and conclusions
We study a consumer boycott organized through Facebook aimed at forcing manufacturers and
retailers to lower prices in a concentrated market. We …nd that, on average, prices dropped virtually
over night by about 24%. The price decline was not uniform across stores and store formats. It
was particularly large in the main supermarket chains, especially in the hard discount stores. Only
after the main manufacturers announced a decrease in their wholesale prices, the retail price also
fell in the small format stores, and remained at the new low level until the end of our sample period.
Demand declined by about 30% during the initial week of the boycott, relative to its predicted level had the boycott not occurred. The decline in demand was more pronounced in stores
located in areas with more educated and less religious population and higher penetration of personal computers, internet, and mobile phones, where exposure to social networks is likely to be
high. Although demand gradually rebounded within 6-8 weeks, demand elasticities have nonetheless become much larger than they were before the boycott. This increase is particularly large for
cross-price elasticities which, on average, increased …vefold relative to their pre-boycott level. The
increase in price elasticities can be due to increased price awareness. We …nd that the change in
28
elasticities or preference only explains part of the price decline. The rest can be attributed to …rms’
fear of the boycott spreading.
Overall, it appears that the consumer boycott was successful. Prices dropped from around
7 NIS per container to about 5:5 NIS per container, and while the boycotters’ demands to lower
the price of cottage cheese to 5 NIS per container were never met in full, the price of cottage cheese
remains relatively low even today, more than three years after the boycott. This is particularly
striking given that over the same period, the prices of many other dairy products have increased,
some quite substantially.39
The economic literature has already shown that the Internet can provide timely and cheap
information on prices and thereby enhance competition and lower prices. Our paper describes
a detailed example of how social media, such as Facebook, can play a role in allowing atomistic
consumers to organize into an e¤ective force that disciplines …rms into lowering prices.
39
For instance, the average price of unsalted butter rose between May 2011 and April 2013 by 25%, the average
price of natural yogurt rose by 18%, and the average prices of fresh milk and hard cheese rose by 8%. Over the same
period, the average price of cottage cheese dropped by 12% and the average price of white cheese dropped by 6% (see
the Center for Research and Information, Israeli Knesset, 2013).
29
A
Summary of main events
Summary of main events
Date
Event
May 31, 2011
News articles describing the surge in food prices in Israel begin to be published
June 7-9, 2011
Shavuot holiday (traditionally a peak demand for dairy products)
June 14, 2011
A Facebook event is created, calling for a boycott of cottage cheese, starting on July 1,
2011
June 14, 2011
Several supermarket chains announce special sales of cottage cheese and other dairy
products
June 15, 2011
The number of users who join the Facebook event approaches 30; 00040
June 16, 2001
The leaders of the Facebook event announce that the boycott will start immediately and
recommend buying cottage and white cheese only if their prices drop under 5 NIS41
June 17, 2011
The number of users who join the Facebook event passes 70; 00042
June 24, 2011
Mrs. Zehavit Cohen, the chairperson of Tnuva’s board, announces in a TV interview
that Tnuva will not unilaterally lower the price of its cottage cheese
Following the interview, three new groups who call for boycotting all of Tnuva’s products
were formed in Facebook
Tnuva lowers the wholesale price of cottage cheese to 4:55 NIS; soon after, Strauss and
Tara follow suit43
June 27, 2011
The government appoints the Kedmi committee to review competition and prices in food
and consumption markets in Israel
June 30, 2011
The number of users who join the Facebook event surpasses 105; 00044
July 14, 2011
The “tents protest” starts on Rothschild Boulevard in Tel Aviv
July 17, 2011
The Kedmi committee recommends reforms in the dairy market
July 30, 2011
Mass rallies in major cities across Israel to protest the rising cost of living and demanding
social justice
Sept. 3, 2011
Around 300; 000 people demonstrate in Tel Aviv against the rising cost of living and
demanding social justice. This demonstration marks the peak of the social protest
Early Sept., 2011
12 student’s associations announce their intention to boycott Tnuva until it lowers its
prices45
Sept. 25, 2011
The Israeli Antitrust Authority raids Tnuva’s central o¢ ce as part of an open investigation of the extent of competition in the dairy industry
Oct. 2, 2011
Mrs. Zehavit Cohen announces its resignation as the chairperson of Tnuva’s board.
Tnuva announces that it will cut the prices of all its products by 15%.
40
See www.ynet.co.il/articles/0,7340,L-4082323,00.html and http://www.themarker.com/markets/1.656978
30
B
Data Appendix
In this Appendix we describe the process by which the initial working sample was generated.
We start with 22; 788; 084 observations, where each observation records the daily total volume of
transactions recorded by the cash register on a speci…c item, in a speci…c store, in a speci…c day.
An item is identi…ed by its unique barcode.
1. Negative values. 77 observations had negative values for 3 key variables (number of items
sold, total weight sold, total number of containers sold). The values of these variables were
set to missing.
2. Duplicates. 955 observations had one additional duplicate observation and 290 additional
observations had three additional duplicate observations. The 1; 825 additional “copies”were
deleted and only one original observation was kept.
3. Repeated observations. Each observation should represent the total transactions in each
store per day and item. That is, all the transactions for a given item are aggregated to a daily
total. However, 105 (store, date, item) observations appear more than once. We keep these
repeated observations (but not exact duplicates since the revenue and weight may vary) in
the sample.
4. Small revenue. We delete 1; 859 observations with total daily revenue of less than 1 NIS.
After these changes were made to the original sample we were left with 22; 784; 400 observations.
C
Computation of the BI index
We compute the observed and predicted quantities for each brand separately and then add them
up to get the (aggregate) BI index. We illustrate with brand A.
First, qt is the daily quantity sold of brand A cottage cheese observed in the data. Second,
qb0 (pt ) is the predicted quantity sold of brand A under the pre-boycott demand at post-boycott
prices pt : This predicted quantity is computed in two steps. Denote by qb0 (p) the …tted (predicted)
41
See http://www.themarker.com/markets/1.656978 and http://www.ynet.co.il/articles/0,7340,L-4083268,00.html
See www.ynet.co.il/articles/0,7340,L-4082323,00.html and http://www.themarker.com/markets/1.656978
43
See http://www.haaretz.co.il/misc/1.1178816
44
See http://www.haaretz.co.il/misc/1.1178816
45
See http://www.calcalist.co.il/local/articles/0,7340,L-3530639,00.html and http://news.walla.co.il/?w=/3/1858515
42
31
quantity demanded estimated using the pre-boycott estimates. The expected increase in quantity
attributed to the observed price decline (a move along the demand curve) is given by qb0 (pt ) qb0 (pt0 );
where pt0 are prices at a pre-boycott time t0 . Thus, predicted sales are:
q0 (pt )
qb0 (pt ) = qt0 + [b
qb0 (pt0 )] ;
where qt0 is the observed average quantity sold at the pre-boycott time t0 .
We use the demand function to estimate changes in quantity, rather than its level, because
in this way we do not need to use the numerous estimated …xed e¤ects, and we rely on observed
quantities until the start of the boycott, making the predicted quantity at post-boycott prices more
reliable.
We use the estimated parameters of the demand function appearing in the …rst three
columns in Table 2 to compute the expected change in demand between the initial period t0 and t;
qb0 (pt )
qb0 (pt0 );
dq (pt )
ln
A
dq (pt ) = ^ (log pAt
ln
A
A
0
log pAt0 ) + ^ B (log pBt
log pBt0 ) + ^ C (log pCt
log pCt0 ) ;
where ^ A ; ^ B and ^ C are, respectively, the own and cross-price elasticities from the …rst column
in Table 2 before the boycott started, and log pAt0 ; log pBt0 ; log pCt0 are prices in the pre-boycott
period, being set equal to the mean price during June 9 –June 13, 2011.
We then have, for brand A;
d
qb0 (pt ) = qt0 + eln qA (pt )
dq (pt )
ln
A
0
;
and similarly for the other brands.
We then add up the observed and predicted quantities over the three brands and compute
the aggregate BI index. The daily variation in quantity sold during the week is also re‡ected in the
BI index. We therefore remove “day-of-the week” e¤ects by using the residuals from a regression
of the BI index on day-of-the-week …xed e¤ects. Furthermore, for ease of exposition, in Figure 5
we show a normalized BI index obtained by subtracting its value on June 14, 2011.
D
Interactions with additional demographics
Table D1 shows the e¤ects of internet subscription, number of mobile phones, religiosity, and share
of older population in each locality on the own price elasticity of demand for cottage cheese. The
results are quite similar to those reported in Table 4 for the other two demographic variables.
32
Table D1: The e¤ect of demographics on cottage cheese own price elasticity
% of households with
Average number of mobile
Internet subscription
phones per household
Own price elasticity A
Before boycott
After boycott
Below median
1:84
1:887
Above median
1:218
Above-Below
0:622
Own price elasticity A
After-Before
Before boycott
After boycott
0:047
1:587
1:849
1:448
0:23
1:536
1:52
0:016
0:439
0:183
0:051
0:329
0:278
Own price elasticity B
After-Before
0:262
Own price elasticity B
Below median
4:083
4:976
0:893
3:641
4:942
1:301
Above median
3:171
4:393
1:222
3:609
4:437
0:828
Above-Below
0:912
0:583
0:329
0:032
Own price elasticity C
0:505
0:473
Own price elasticity C
Below median
4:825
5:342
0:517
4:299
5:197
0:898
Above median
3:65
4:792
1:142
4:285
4:927
0:642
Above-Below
1:175
0:55
0:625
0:014
0:27
0:256
% of Jewish men aged 15 and over
% of those aged 65+
who study in a “yeshiva”
Own price elasticity A
Own price elasticity A
Before boycott
After boycott
After-Before
Before boycott
After boycott
Below median
1:386
1:763
0:377
1:644
1:63
0:014
Above median
1:831
1:67
0:161
1:506
1:795
0:289
Above-Below
0:445
0:093
0:583
0:138
Own price elasticity B
After-Before
0:165
0:303
Own price elasticity B
Below median
3:401
4:791
1:39
3:86
4:759
0:899
Above median
3:893
4:789
0:896
3:42
4:673
1:253
Above-Below
0:492
0:002
0:494
0:44
Own price elasticity C
0:086
0:354
Own price elasticity C
Below median
4:109
4:893
0:784
4:395
5:183
0:788
Above median
4:468
5:351
0:881
4:206
4:982
0:776
Above-Below
0:359
0:456
0:097
0:189
Standard errors clustered at the store level. * p<0.10; ** p<0.05; *** p<0.01
0:201
0:012
33
Tables D2–D4 present the estimated coe¢ cients of the demand functions using interactions
between the price regressors (and constant) and a full set of Above/Below (the median for each
demographic variables) and After/Before (the boycott) indicators.
Table D2: Own and cross cottage cheese price elasticities and demographics
Dependent Var: log quantity
% households using a PC
% with …rst academic degree
(1)
(2)
(3)
(4)
(5)
(6)
A
B
C
A
B
C
Constant (Before and Below)
12.508***
12.793***
13.483***
11.443***
11.784***
12.388***
Constant
Above
-3.551***
-3.991***
-4.721***
-2.5***
-3.119***
-3.553***
Constant
After
-2.328***
-1.543***
-1.153***
-0.476*
-2.381***
-1.581***
Constant
Above
1.056***
0.066
0.825*
-0.882***
1.308***
1.353***
Log Price A (Before and Below)
-1.855***
0.266**
-0.042
-1.928***
0.152
-0.072
Log Price A
Above
0.681***
0.571***
0.457*
0.717***
0.720***
0.430*
Log Price A
After
-0.068
1.927***
1.799***
-0.144
2.222***
2.091***
Log Price A
Above
-0.134
0.816**
0.397
0.089
-1.278***
-0.815*
0.128***
-4.067***
0.07
0.105**
-4.129***
0.088
Brand
After
After
Log Price B (Before and Below)
Log Price B
Above
-0.029
0.923***
0.086
0.022
1.017***
0.099
Log Price B
After
0.215**
-1.061***
0.541***
0.269**
-0.918***
0.513***
Log Price B
Above
-0.153
-0.041
-0.147
-0.248*
-0.415*
-0.149
Log Price C (Before and Below)
0.033
0.274***
-4.886***
0.023
0.251***
-4.887***
Log Price C
Above
0.014
-0.075
1.433***
0.047
0.015
1.384***
Log Price C
After
0.398***
0.492***
-0.457*
0.408***
0.587***
-0.532*
Log Price C
Above
0.066
0.201
-0.874***
0.07
0.037
-0.777***
426,881
426,881
426,881
409,972
409,972
409,972
Nobs
After
After
R squared
0.88
0.74
0.72
0.88
0.74
0.72
Daily price data are used. The sample period is from January 1, 2010 until April 30, 2012, excluding
the boycott period (May 15, 2011-October 2, 2011) and the period corresponding to a strike at a major
manufacturer (March 18, 2012-April 3, 2012). The coe¢ cients for the interactions with the “After”indicator
represent the additional e¤ect after the boycott, while the coe¢ cients for the interaction with the “Above”
indicator indicate the additional e¤ect for locations with above the median value of the corresponding
demographic variable. All regressions include “day of the week” and store e¤ects whose values are allowed
34
to change after the boycott, as well as a set of week dummies to capture weekly aggregate e¤ects over the
sample period. Standard errors clustered at the store level
* p<0.05; ** p<0.01; *** p<0.001
35
Table D3: Own and cross cottage cheese price elasticities and demographics
Dependent Var: log quantity
% of households with
Average number of mobile
Internet subscription
phones per household
(1)
(2)
(3)
(4)
(5)
(6)
A
B
C
A
B
C
Constant (Before and Below)
9.604***
10.158***
10.538***
12.057***
11.597***
12.821***
Constant
Above
2.901***
1.871***
2.210***
-2.682***
-2.051***
-2.943***
Constant
After
-1.515***
-2.313***
-1.652***
-0.755***
-0.883***
-0.915**
Constant
Above
1.059***
1.668***
1.161**
-0.829***
-1.508***
-0.406
Log Price A (Before and Below)
-1.840***
0.334**
0.075
-1.587***
0.514***
0.133
Log Price A
Above
0.622***
0.418***
0.199
0.051
-0.007
0.0435
Log Price A
After
-0.047
1.795***
1.727***
-0.262
1.316***
1.628***
Log Price A
Above
-0.183
0.55
-0.3
0.278
0.476
0
0.136***
-4.083***
0.087
0.128***
-3.641***
0.107
Brand
After
After
Log Price B (Before and Below)
Log Price B
Above
-0.045
0.912***
0.042
-0.036
0.032
0.013
Log Price B
After
0.193*
-0.893***
0.517***
0.163*
-1.301***
0.490***
Log Price B
Above
-0.098
-0.329
-0.092
-0.019
0.473*
-0.033
Log Price C (Before and Below)
0.03
0.279***
-4.825***
0.066
0.233***
-4.299***
Log Price C
Above
0.012
-0.091
1.175***
-0.068
0.013
0.014
Log Price C
After
0.389***
0.465***
-0.517*
0.393***
0.515***
-0.898***
Log Price C
Above
0.087
0.272*
-0.625**
0.092
0.143
0.256
426,881
426,881
426,881
426,881
426,881
426,881
0.88
0.74
0.72
0.88
0.74
0.72
Nobs
R squared
After
After
See notes to Table D2
36
Table D4: Own and cross cottage cheese price elasticities and demographics
Dependent Var: log quantity
% of Jewish men aged 15 and over
% of those aged 65+
who study in a “yeshiva”
(1)
(2)
(3)
(4)
(5)
(6)
A
B
C
A
B
C
Constant (Before and Below)
10.885***
10.774***
11.398***
9.440***
9.861***
9.721***
Constant
Above
-1.243***
-0.832***
-1.277***
2.731***
2.053***
3.153***
Constant
After
-0.204
-1.440***
-0.890*
-1.586***
-2.051***
-1.184***
Constant
Above
-1.490***
-0.949**
-0.448
-0.482*
0.913**
0.619
Log Price A (Before and Below)
-1.386***
0.557***
0.101
-1.644***
0.437***
0.422**
Log Price A
Above
-0.445**
-0.212
-0.048
0.138
0.142
-0.541**
Log Price A
After
-0.377
1.576***
1.783***
0.014
1.550***
1.561***
Log Price A
Above
-0.538*
0.335
0.052
-0.303
0.059
0.094
0.106***
-3.401***
0.165**
0.121***
-3.860***
0.13
Brand
After
After
Log Price B (Before and Below)
Log Price B
Above
0.007
-0.492***
-0.046
-0.024
0.440***
-0.025
Log Price B
After
0.174*
-1.390***
0.417***
0.107
-0.899***
0.550***
Log Price B
Above
-0.035
0.494**
0.047
0.103
-0.354
-0.134
Log Price C (Before and Below)
0.053
0.182***
-4.109***
0.011
0.249***
-4.395***
Log Price C
Above
-0.055
0.112
-0.359
0.047
-0.011
0.189
Log Price C
After
0.499***
0.730***
-0.784***
0.515***
0.487***
-0.788***
Log Price C
Above
-0.071
-0.233
-0.097
-0.144
0.174
0.012
399,753
399,753
399,753
428,359
428,359
428,359
0.87
0.74
0.72
0.88
0.74
0.72
Nobs
R squared
After
After
See notes to Table D2
37
E
An IV estimator
The IV estimation is based on the following procedure. We use information on the retail chain to
which store s belongs and compute, for each brand, the (quantity-weighted) mean cottage price in
stores that belong to other retail chains and are located in other cities (IV1), the
(quantity-weighted) mean price in stores that belong to other retail chains but are located in the
same city (IV2), and the (quantity-weighted) mean price among all stores in other cities (IV3).46
The assumption is that these mean prices are not related to store (or chain)-speci…c unobserved
demand factors in "jst : We then estimate a …rst-stage regression, one for each brand, where a
store’s price is regressed on each of these mean prices for the three brands, as well as on all the
…xed e¤ects used in the estimation presented in Table 2. In addition, we interacted the mean
price with store dummies to generate variation in the predicted prices across stores in the same
city and retail chain. In a second-stage we estimate (2) using the store-speci…c predicted prices
from the …rst-stage instead of the observed prices.
Table E1 presents the results. Columns (1)-(3) show IV estimates based on the mean cottage
price in stores that belong to other retail chains and are located in other cities (IV1), while
columns (4)-(6) show IV estimates based on the mean price in stores that belong to other retail
but are located in the same city (IV2). IV estimates based on the mean price among all stores in
other cities are similar to IV1 and therefore not reported. The reported standard errors reported
are incorrect because they do not account for the fact that we use a predicted price (i.e., we use
second-stage residuals instead of the true residuals).
46
Our data do not provide information on the retail chain to which a store belongs. Using public information
available in the Internet we managed to identify the retail chain to which 659 out the 1127 stores belong. There are
44 di¤erent retails chains, though the two largest chains own 17 percent of all stores in our data. We suspect that
most of the remaining stores do not belong to a retail chain but we cannot be completely sure.
38
Table E1: IV estimates of cottage cheese own and cross price elasticities
Dependent Variable: log quantity
IV1
Brand
Constant
Constant
after
Log Price A
Log Price A
Log Price B
Log Price B
after
Log Price C
Log Price C
(1)
(2)
(3)
(4)
(5)
(6)
A
B
C
A
B
C
12.800
10.778
15.484
11.332
-2.409
-2.404
-6.908
-0.942
-2.157
-1.785
-2.976
after
Number of observations
-0.103
0.453
2.822
0.078
-3.546
0.116
-0.080
-1.000
-0.340
5.370
-0.243
0.349
-0.127
9.024
-0.473
14.080
-5.749
1.594
-0.807
1.389
4.105
-3.579
0.091
-1.363
0.143
-0.236
-5.797
-0.079
-0.042
-5.617
1.123
1.067
1.934
0.387
0.806
1.483
356,090
333,371
332,301
298,625
299,319
-0.176
after
IV2
308,542
Daily price data are used. The sample period is from January 1, 2010 until April 30, 2012, excluding the
boycott period (May 15, 2011-October 2, 2011) and the period corresponding to a strike at a major
manufacturer (March 18, 2012-April 3, 2012). The coe¢ cients for the interactions with the “after”
indicator represent the additional e¤ect after the boycott. All regressions include “day of the week” and
store e¤ects whose values are allowed to change after the boycott, as well as a set of week dummies to
capture weekly aggregate e¤ects over the sample period. Standard errors clustered at the store level.
*p<0.10; ** p<0.05; *** p<0.01
The estimated own price elasticities are qualitatively the same as, and of similar order of
magnitude to, the OLS-…xed e¤ect estimates in Table 2,
except for brand C where the elasticity declines (in absolute value) after the boycott. Cross price
elasticities are sometimes negative. The estimates are sensitive to the choice of IV.
39
F
The imputed post-boycott prices under double marginalization
When the manufacturer of brand b sets the wholesale price wb , while the retailers set the retail
price pb , the inverse elasticity rules at the retail and at the wholesale levels imply that
pb =
"b cb
b"
b 1
1
b
=
(
b
b "b cb
1)("b 1) ,
where "b is the elasticity of the wholesale demand faced by the
manufacturer. To compute "b , recall from equation (2) that we assume that the demand for brand
b
b is given by a constant elasticity demand function qb = Ab pb
, where
b
is the elasticity of
demand for brand b at the retail level and Ab is a constant that depends on the prices of the rival
brands, store-brand …xed e¤ects, and demographics. The inverse demand function at the retail
level is then pb =
1
b
qb
Ab
and the marginal revenue function, which is also the inverse demand
1
function faced by the manufacturer, is given by Ab b
1
b
b
1
b
qb
. Hence, given a wholesale price
wb , the wholesale demand function faced by the manufacturer is qb = Ab
1
b
b
b
wb
b
. It is now
easy to check that the elasticity of wholesale demand faced by the manufacturer is "b =
b,
just
like the elasticity of demand at the retail level. Consequently, the equilibrium retail price should
"b cb
b"
b 1
be pb =
b
1
2
=
price of brand b,
b
b
p0b ,
1
cb , which in turn implies that cb =
0
b
b
pb . Hence, the post-boycott
should be equal to
2
0
b
p0b =
where
1 2
b
0
b
1
2
0
b
cb =
0
b
1
b
1
2
pb ;
(pre-post-2)
b
is the post-boycott own-price elasticity of demand of brand b.
As before, the boycott should not have a¤ected the price of brand A since the own price elasticity
of brand A did change signi…cantly. Therefore it appears that the 24% decline in the price of
brand A was fully due to an attempt to contain the potential repercussions of the boycott.
Substituting
B
= 3:632 and
0
B
= 4:707 for brand B, and
C
= 4:3 and
0
C
= 5:071 for brand C
into equation (??) reveals that the post-boycott prices should have been 15:4% below the
pre-boycott price for brand B and 8:6% below the pre-boycott price for brand C. Since the actual
price of brands B and C came down 24%; we can conclude again that the boycott directly
in‡uenced the pricing of brands B and C above and beyond what was implied by the higher
own-price elasticities of demand.
40
References
[1] Abito, Jose-Miguel, David Besanko, and Daniel Diermeier (2013), “Corporate Reputational
Dynamics, Private Regulation, and Activist Pressure,” Mimeo
[2] Acemoglu, Daron, Tarek A. Hassan, and Ahmed Tahoun (2014), “The Power of the Street:
Evidence from Egypt’s Arab Spring,” NBER Working Paper No. 20665
[3] Andersen, Kurt (2011), “The Protester,” Time (December 14, 2011)
http://www.time.com/time/specials/packages/article/0,28804,2101745_2102132,00.html
[4] Ashenfelter, Orley, Stephen Ciccarella, and Howard J. Shatz (2007), “French Wine and the
U.S. Boycott of 2003: Does Politics Really A¤ect Commerce?” Journal of Wine Economics,
2(1), 55–74.
[5] Baron, David (2003), “Private Politics,” Journal of Economics and Management Strategy,
12(1), 31–66.
[6] Baron, David and Daniel Diermeier (2007), “Strategic Activism and Non-market Strategy,”
Journal of Economics & Management Strategy,16(3), 599-634.
[7] Bentzen, Jan, and Valdemar Smith (2002), “French Nuclear Testings and Consumption of
French Wine in Denmark,” International Journal of Wine Marketing, 14(3), 20–36.
[8] Breuer, Anita (2012), “The Role of Social Media in Mobilizing Political Protest: Evidence
from the Tunisian Revolution,” German Development Center Discussion paper 10/2012.
[9] Brown, Je¤rey and Austan Goolsbee (2002) “Does the Internet Make Markets More
Competitive? Evidence from the Life Insurance Industry,” Journal of Political Economy,
110(3), 481-507.
[10] Campante, Filipe, Ruben Durante, and Francesco Sobbrio, (2013), “Politics 2.0: The
Multifaceted E¤ect of Broadband Internet on Political Participation,” NBER Working Paper
No. 19029.
[11] Czernich, Nina (2012), “Broadband Internet and Political Participation: Evidence for
Germany,” Kyklos, 65(1), 31–52.
[12] Chavis, Larry and Phillip Leslie (2009), “Consumer Boycotts: The Impact of the Iraq War
on French Wine Sales in the U.S.,” Quantitive Marketing Economics, 7, 37–67.
[13] Clerides, Sofronis, Peter Davis, and Antonis Michis (2013), “National Sentiment and
Consumer Choice: The Iraq War and Sales of US Products in Arab Countries,” forthcoming
in the Scandinavian Journal of Economics.
41
[14] Davidson, Wallace, Dan Worrell, and Abuzar El-Jelly (1995), “In‡uencing Managers to
Change Unpopular Corporate Behavior through Boycotts and Divestitures,” Business and
Society, 34, 171–196.
[15] Diermeier, Daniel (2011), Reputation Rules: Strategies for Building Your Company’s Most
Valuable Asset. New York: McGraw-Hill.
[16] Diermeier Daniel (2012), “When Do Company Boycotts Work?” HBR Blog Network,
Available at http://blogs.hbr.org/cs/2012/08/when_do_company_boycotts_work.html
[17] Enjolras, Bernard, Kari Steen-Johnsen, and Dag Wollebaek (2012) “Social Media and
Mobilization to O- ine Demonstrations: Transcending Participatory Divides?” New Media
and Society, 15(6), 890–908.
[18] Epstein, Marc and Karen Schnietz, (2002), “Measuring the Cost of Environmental and Labor
Protests to Globalization: An Event Study of the Failed 1999 Seattle WTO Talks,” The
International Trade Journal, 16(2), 129-160.
[19] Faiola, Anthony and Paula Moura (2013), “Middle-Class Rage Sparks Protest Movements in
Turkey, Brazil, Bulgaria and beyond,” Washington Post (June 28, 2013),
http://articles.washingtonpost.com/2013-06-28/world/40250885_1_turkey-new-governmentarab-spring.
[20] Falck, Oliver, Robert Gold, and Stephan Heblich (2013), “E-lections: Voting behavior and
the internet,” Mimeo, Available at
http://www2.warwick.ac.uk/fac/soc/economics/news_events/calendar/falck_gold_heblich_2013_elections2.pdf
[21] Fershtman, Chaim and Neil Gandal (1998), “The E¤ect of the Arab Boycott on Israel: The
Automobile Market,” Rand Journal of Economics, 29(1), 193–214.
[22] Fisman, Raymond, Yasushi Hamao, and Yongxiang Wang, (2014), “Nationalism and
Economic Exchange: Evidence from Shocks to Sino-Japanese Relations,”Review of Financial
Studies, Forthcoming.
[23] Friedman, Monroe, (1985), “Consumer Boycotts in the United States, 1970–1980:
Contemporary Events in Historical Perspective,” Journal of Consumer A¤ airs, 19, 96–117.
[24] Friedman, Monroe, (1999), Consumer Boycotts, New York: Routledge.
[25] Gavazza, Alessandro, Mattia Nardotto, and Tommaso Valletti (2015), “Internet and Politics:
Evidence from UK Local Elections and Local Government Policies,” Mimeo
42
[26] Gonzalez-Bailon, Sandra and Ning Wang, (2013), “The Bridges and Brokers of Global
Campaigns in the context of Social Media,” Mimeo.
[27] Harrison, Ann and Jason Scorse (2010), ”Multinationals and Anti-Sweatshop Activism,” The
American Economic Review , Vol. 100, No. 1, March, pp. 247-273
[28] Hong, Canhui, Wei-Min Hu, James Prieger, and Dongming Zhu (2011), “French Automobiles
and the Chinese Boycotts of 2008: Politics Really Does A¤ect Commerce,” The B.E. Journal
of Economic Analysis & Policy, 11(1), Article 26.
[29] Iskander, Elizabeth (2011) “Connecting the National and the Virtual: can Facebook
Activism Remain Relevant after Egypt’s January 25 Uprising?” International Journal of
Communication, 5, 13-15.
[30] Koku, Paul Sergios, Aigbe Akhigbe, and Thomas Springer, (1997), “The Financial Impact of
Boycotts and Threats of Boycotts,” Journal of Business Research, 40, 15–20.
[31] Mainwaring, Simon (2011), “The New Power of Consumers to In‡uence Brands,” Forbes
(July 9, 2011), Available at http://www.forbes.com/sites/simonmainwaring/2011/09/07/thenew-power-of-consumers-to-in‡uence-brands/
[32] Miner, Luke (2012), “The Unintended Consequences of Internet Di¤usion: Evidence from
Malaysia,” Mimeo. Available at
http://lukeminer.com/wp-content/uploads/2012/07/Miner_Draft2012.pdf
[33] Ofek, Yuval (2012), “The in‡uence of maximum price regulation removal on milk products
prices in Israel during the period 1999-2011”, MA thesis, Mimeo.
[34] Pruitt, Stephen and Monroe Friedman, (1986), “Determining the E¤ectiveness of Consumer
Boycotts: A Stock Price Analysis of Their Impact on Corporate Targets,” Journal of
Consumer Policy, 9, 375–387.
[35] Pruitt, Stephen, K.C. John Wei, and Richard White, (1988), “The Impact of
Union-Sponsored Boycotts on the Stock Prices of Target Firms,” Journal of Labor Research,
9(3), 285–289.
[36] Teoh, Siew Hong, Ivo Welch, and C. Paul Wazzan, (1999), “The E¤ect of Socially Activist
Investment Policies on the Financial Markets: Evidence from the South African Boycott,”
Journal of Business, 72, 35–89.
[37] Tufekci, Zeynep and Christopher Wilson (2012), “Social Media and the Decision to
Participate in Political Protest: Observations From Tahrir Square,” Journal of
Communication, 62, 363–379.
43
[38] Stango, Victor (2003), “Strategic Responses to Regulatory Threat in the Credit Card
Market,” Journal of Law and Economics, 46, pp. 427-452.
[39] State Comptroller of Israel (2012), “Opinion on Regulation of Food Prices and Regulation on
Dairy Product Prices,” September 2012 (in Hebrew). Available at
http://www.icba.org.il/news/…les/food_milk.pdf
[40] Taylor, Chris (2011), “How social media are amplifying customer outrage,” CNN (July 22,
2011), Available at
http://edition.cnn.com/2011/TECH/social.media/07/22/social.media.outrage.taylor/
[41] The “Kedmi Committee” Report (The Competitiveness in the Food and Consumer Goods
Market Committee), 2012, (in Hebrew). Available at
http://www.moit.gov.il/NR/rdonlyres/2301FA18-DDC9-4983-AF08AD473CBB9400/0/reportMilk180712.pdf
[42] The Center for Resaerch and Information, Israeli Knesset, (2011), “The Increase in Food
Prices in Israel,” (in Hebrew) July 3, 2011, Available at
http://www.knesset.gov.il/mmm/data/pdf/m02879.pdf
[43] The Center for Resaerch and Information, Israeli Knesset, (2013), “Analysis of the E¤ect of
Concentration in the Food Market on the Increase in Food Prices in Israel,” (in Hebrew)
July 2, 2013, Available at http://www.knesset.gov.il/mmm/data/pdf/m03256.pdf
[44] Valenzuela, Sebastián, Arturo Arriagada, and Andrés Scherman (2012), “The Social Media
Basis of Youth Protest Behavior: The Case of Chile,”Journal of Communication, 62, 99–314.
44

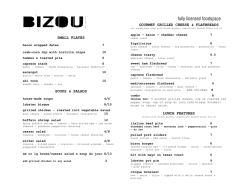


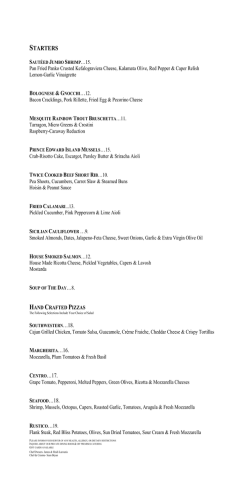
© Copyright 2026