
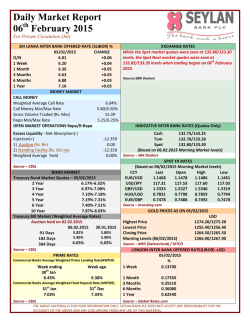
Opening Remarks by Mr. N. S. Kannan for Q3-2015
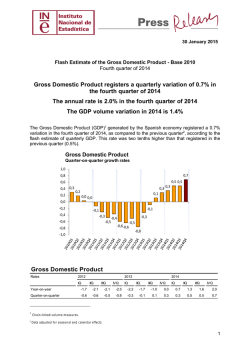
Mr. N. S. Kannan’s opening remarks for analyst call on January 30, 2015 Certain statements in this call are forward-looking statements. These statements are based on management's current expectations and are subject to uncertainty and changes in circumstances. Actual results may differ materially from those included in these statements due to a variety of factors. More information about these factors is contained in ICICI Bank's filings with the Securities and Exchange Commission. All financial and other information in this call, other than financial and other information for specific subsidiaries where specifically mentioned, is on an unconsolidated basis for ICICI Bank Limited only unless specifically stated to be on a consolidated basis for ICICI Bank Limited and its subsidiaries. Please also refer to the statement of unconsolidated, consolidated and segmental results required by Indian regulations that has been filed with the stock exchanges in India where ICICI Bank’s equity shares are listed and with the New York Stock Exchange and the US Securities and Exchange Commission, and is available on our website www.icicibank.com. Good evening and welcome to the conference call on the financial results of ICICI Bank for the quarter ended December 31, 2014, that is the third quarter of the financial year 2015. In my remarks this evening, I will cover: First: the macro-economic and monetary environment; then, our performance during the quarter, including performance on our 5Cs strategy; then, the performance of our subsidiaries and the consolidated results; and finally, the outlook going forward. 1 Let me start with the first part on the macro economic and monetary environment during the third quarter. On the global front, economic growth continues to remain subdued across key emerging and developed economies, excluding the US which has seen a recovery in growth. On the monetary policy stance, we have seen divergent trends across economies. While the US Federal Reserve Board has concluded its quantitative easing – QE – in October 2014, the European Central Bank, ECB, recently announced an expanded asset purchase program. Exchange rates have remained volatile during the last few months. While the US dollar has strengthened after conclusion of QE in the US; emerging market currencies, including the Indian Rupee, depreciated during Q3 of 2015. However, the Indian Rupee remained amongst the best performing emerging market currencies during the calendar year 2014. The significant moderation in commodity prices has been a key global development during Q3 of 2015. Crude oil prices decreased by about 48% from about USD 95 per barrel in end September 2014 to about USD 49 per barrel on January 29, 2015. The price of key industrial metals like copper & aluminium as well as gold prices also decreased during the quarter. In the domestic economy, recovery in real economic activity has remained uneven. Industrial activity, as measured by the index of 2 industrial production – IIP – recorded a year-on-year decrease of 0.3% in October-November 2014 compared to a growth of 1.4% in Q2 of 2015. The services sector purchasing managers’ index – PMI – moderated to 51.1 in December 2014 compared to 52.6 in November 2014. With respect to the trends in merchandise trade, exports decreased by 1.8% year-on-year during Q3 of 2015 while imports grew by 7.9% year-on-year mainly due to an increase in gold imports. On the positive side, the manufacturing PMI was at a two year high of 54.5 in December 2014. Also, there was a pickup in passenger and commercial vehicle sales during the quarter. Moving on to the performance of financial markets, the S&P BSE Sensex rose by 3.3% during the quarter. The yield on 10-year government securities eased by 65 basis points to 7.9% as of endDecember 2014 compared to 8.5% as of end-September 2014. The Indian Rupee depreciated by 2.8% to 63.3 Rupees per US Dollar at the end of Q3 of 2015 from 61.6 Rupees per US Dollar at the beginning of the quarter. FII inflows were lower at about USD 9 billion during Q3 of 2015 compared to about USD 13 billion in Q2 of 2015. Overall, while the quarter was benign with regard to financial markets, December second half was quite volatile. Moving on to inflation, the headline Consumer Price Index, CPI based inflation moderated from 6.5% in September 2014 to 5.0% in December 2014, supported by easing food prices and decrease 3 in oil prices. Survey based households’ inflation expectations have also eased to single digit % in December 2014, for the first time since September 2009. Keeping in view the trends in inflation and inflation expectations, RBI reduced the repo rate by 25 basis points to 7.75% on January 15, 2015. RBI also reiterated that once the monetary policy stance has shifted, subsequent policy actions will be consistent with this stance; key to further easing will be continuing disinflationary pressures & sustained high quality fiscal consolidation. The Government has announced several measures recently including re-issuance of the coal ordinance and initiation of the auction process, issuance of ordinance amending the Land Acquisition Act, 2013 and issuance of ordinance amending insurance laws whereby the composite cap on foreign equity investment has been increased from 26% to 49%. Also, the direct benefit transfer scheme to provide subsidy on cooking gas has become operational from January 2015. These developments are expected to positively impact the investment and growth climate in the country. With respect to the banking sector, non-food credit growth continued to remain moderate and was at 10.8% year-on-year as of December 26, 2014. Growth in total deposits moderated to 11.5% on a year-on-year basis at December 26, 2014 primarily on 4 account of the base effect due to FCNR (B) deposits. Demand deposits growth moderated to about 12.4% year-on-year at December 26, 2014 compared to about 15.8% year-on-year at October 3, 2014. With this background, let me now move to our performance during the quarter, including the progress on our 5Cs strategy: First, with respect to Credit growth: The Bank’s domestic loan portfolio grew by 15.6% on a year-on-year basis as of December 31, 2014, compared to a 10.8% growth in non-food credit for the system as of December 26, 2014. Loan growth for the Bank continues to be driven by the retail segment which grew by 25.6% year-on-year on December 31, 2014. The growth in our retail portfolio continues to be driven by secured products, with the outstanding mortgage and auto loan portfolios growing by 27% and 32% respectively on a year-onyear basis as of December 31, 2014. Growth in the business banking and rural lending segments was 13% and 35% year-onyear respectively. Commercial business loans declined by 13% on a year-on-year basis at December 31, 2014, reflecting primarily the run-down of the bought-out portfolio. The unsecured credit card and personal loan portfolio at 103.62 billion Rupees at December 31, 2014 continued to remain a small portion, about 2.8%, of the overall loan book, though the growth rate is high due to the low base. 5 In view of the operating environment, we continued to adopt a cautious approach to growth in the corporate and SME segments. The domestic corporate portfolio growth was 4.0% on a year-on-year basis as of December 31, 2014 compared to 4.5% growth as of September 30, 2014. The SME portfolio increased marginally on a sequential basis to 163.47 billion Rupees as of December 31, 2014. Going forward, we will continue to calibrate the growth in corporate and SME portfolios with the trends in the economic environment. Growth in net advances of the overseas branches, in US dollar terms, moderated to 3.5% on a year-on-year basis at December 31, 2014 compared to 11.9% year-on-year growth at September 30, 2014, as the lending against FCNR (B) deposits during the third quarter of fiscal 2014 is now reflected in the base. In rupee terms, the net advances of the overseas branches increased by 5.6% on a year-on-year basis due to the movement in the exchange rate. On a sequential basis, the overseas branches loan book grew marginally by about 1.5%, in US dollar terms. As a result of the above, total advances of the Bank increased by 12.8% on a year-on-year basis from 3.33 trillion Rupees at December 31, 2013 to 3.75 trillion Rupees at December 31, 2014. 6 Moving on to the second C on CASA deposits: The Bank continued to see healthy momentum in CASA deposit mobilisation. On a period-end basis, we saw an addition of 49.27 billion Rupees to our savings deposits while the current account deposits decreased by 22.02 billion Rupees during the quarter. However, on a daily average basis, current account deposits increased by about 13 billion Rupees during the quarter. As a result of above trends, the period end CASA ratio improved to 44.0% as of December 31, 2014 compared to 43.7% as of September 30, 2014. The daily average CASA ratio for the Bank for Q3 of 2015 was at 39.3% compared to 39.5% in Q2 of 2015 and 39.1% in the corresponding quarter last year. On the third C on Costs: The Bank maintained a healthy costto-income ratio of 36.3% in the third quarter of fiscal 2015 compared to 37.0% in the third quarter of fiscal 2014 and 36.5% in the second quarter of fiscal 2015. For the third quarter, operating expenses increased by 9.5% on a year-on-year basis. As mentioned on our previous calls, given the addition of about 14,000 employees in the previous two years and the Bank’s focus on productivity and efficiency, the employee base has decreased by about 4,700 during the nine months ending December 31, 2015, to 67,510 employees. This has been achieved primarily by not replacing attrition. While the Bank would expect the employee base to increase from this level, the Bank continues to focus on further enhancing the productivity 7 and efficiency of its employee base as well as the expanded distribution network in order to drive growth. Let me now move on to the fourth C on Credit quality: During the third quarter, we saw gross NPA additions of 22.79 billion Rupees, including slippages of 7.76 billion Rupees from the standard restructured category to the non-performing asset category. Deletions from NPA during the quarter were 5.07 billion Rupees and the Bank has also written-off 1.83 billion Rupees of NPAs. We also sold NPAs of a small amount of 0.53 billion Rupees to asset reconstruction companies during the quarter. The net NPA ratio was 112 basis points as of December 31, 2014 compared to 96 basis points as of September 30, 2014. During the quarter, we had gross additions of 17.55 billion Rupees to its restructured loans. After taking into account deletions, including the slippages mentioned earlier, and the required specific provisioning, the net restructured loans for the Bank were at 120.52 billion Rupees as of December 31, 2014 compared to 110.20 billion Rupees as of September 30, 2014. Our restructuring pipeline for the fourth quarter is estimated at about 23.00 billion Rupees. Provisions for Q3 of 2015 were at 9.80 billion Rupees compared to 6.95 billion Rupees in Q3 of 2014 and 8.50 billion Rupees in Q2 of 2015. As a result, credit costs as a percentage of average 8 advances were at 107 basis points on an annualised basis for Q3 of 2015. For the nine months period ended December 31, 2014, credit costs as a percentage of average advances were at 97 basis points. Provisions in Q3 of 2015 include standard asset provisions of about 480 million Rupees on account of exposure to clients having unhedged foreign currency exposure. This added about 5 basis points to the annualised provisions to average advances for Q3 of 2015. The provisioning coverage ratio on non-performing loans was 63.5% as of December 31, 2014. At the beginning of the current fiscal year, we had articulated our expectation that additions to restructured loans and nonperforming assets in the current year would not exceed the previous year. However, as mentioned on our previous calls, given the prolonged economic slowdown and uneven economic recovery, banks including us have witnessed slippages from the restructured portfolios. For the full year fiscal 2014, the aggregate addition to NPAs was 45.40 billion Rupees, of which the fresh NPA addition was 38.13 billion Rupees and slippage from restructured loans to the NPA category was 7.27 billion Rupees. Loans restructured during fiscal 2014 were 66.33 billion Rupees. Thus, the sum of loan restructuring during the period and NPA additions, excluding 9 slippages from the restructured portfolio, was 104.46 billion Rupees for the last year. In comparison, during the first three quarters of the current year, the aggregate addition to NPAs was 51.47 billion Rupees, of which the fresh NPA addition was 28.55 billion Rupees and slippage from restructured loans to the NPA category was 22.92 billion Rupees. Loans restructured during this period were 41.10 billion Rupees. Thus, the sum of loan restructuring during the period and NPA additions, excluding slippages from the restructured portfolio was 69.65 billion Rupees. After taking into account deletions and provisioning, the aggregate net NPAs and net restructured loans increased by 30.24 billion Rupees from 138.59 billion Rupees at March 31, 2014 to 168.83 billion Rupees at December 31, 2014. We believe that the aggregate restructuring and fresh addition to NPAs for the full year fiscal 2015 will not exceed the previous year. As you are aware, from April 1, 2015, any loan restructuring other than in specified sectors based on certain strict criteria, will lead to the asset being classified as nonperforming. The systemic loan restructuring trends in the fourth quarter of the current year would have to be closely monitored in this context. The total NPA additions in the fourth quarter are expected to be higher than the third quarter, primarily due to challenges with respect to one or two large restructured 10 borrowers. Apart from this, we are continuing to closely monitor other exposures such as a large gas-based power plant exposure originated in the late 1990s, where uncertainties exist regarding the mode and timing of resolution of the asset. Now to the fifth C on Customer centricity: The Bank continues to focus on enhancing its customer service capability and leveraging on its increased branch network to cater to its customer base. During the quarter, the Bank added 35 branches and 352 ATMs to its network. Accordingly, as of December 31, 2014, the Bank had a branch network of 3,850 branches and 12,091 ATMs. We also continued to strengthen our technology channels for increasing customer convenience. During the quarter, we launched the country’s first contactless debit and credit cards that use near-field communication, or NFC, techonology. The NFC technology provides customers improved convenience of speed and security over traditional cards, as these cards can complete a transaction faster and are more secure as they remain with the customer throughout the transaction. We have extended our ‘Pockets by ICICI Bank’ application on Facebook to our Non Resident Indian customers, offering NRI customers the convenience of banking while they are on the social media site. Our Facebook page continues to be appreciated by customers with over 3.4 million fans, the largest fan base on Facebook among Indian banks. We have also recently launched banking services on Twitter and are the first 11 bank in India to do so. We will continue to launch new digital banking propositions in the days ahead. Having talked about the performance on the 5Cs, let me move on to the key financial performance highlights for the quarter. 1. Net interest income increased by 13.1% year-on-year from 42.55 billion Rupees in Q3 of 2014 to 48.12 billion Rupees in Q3 of 2015. The net interest margin improved to 3.46% in Q3 of 2015 from 3.32% in the corresponding quarter last year and 3.42% in the preceding quarter. The domestic NIM was at 3.88% in Q3 of 2015 compared to 3.67% in the corresponding quarter last year and 3.84% in the preceding quarter. International margins were at 1.67% in Q3 of 2015 compared to 1.70% in the corresponding quarter last year and 1.58% in the preceding quarter. 2. Total non-interest income increased by 10.4% from 28.01 billion Rupees in Q3 of 2014 to 30.91 billion Rupees in Q3 of 2015. Within the non-interest income, Fee income grew by 5.7% from 19.97 billion Rupees in Q3 of 2014 to 21.10 billion Rupees in Q3 of 2015. The lower growth is mainly due to subdued corporate activity and consequent decline in corporate fee income. Retail 12 fees for the Bank continue to grow at a healthy rate and now constitute about 60% of overall fees. Other income was 5.38 billion Rupees in Q3 of 2015, compared to 3.57 billion Rupees in Q3 of 2014 and 4.98 billion Rupees in Q2 of 2015. The Bank continued to receive healthy dividend streams from its subsidiaries. During the quarter, the Bank made net exchange rate gains of 1.92 billion Rupees relating to its overseas operations. During the third quarter, treasury recorded a profit of 4.43 billion Rupees compared to 4.47 billion Rupees in the corresponding quarter last year and 1.37 billion Rupees in the previous quarter. The treasury income for Q3 of 2015 was primarily driven by gains on the fixed income portfolio. 3. I have already spoken about the trends in operating expenses and provisions while speaking about the 5Cs strategy. 4. As a result of these trends, the Bank’s standalone profit before tax increased by 8.4% from 37.44 billion Rupees in Q3 of 2014 to 40.57 billion Rupees in Q3 of 2015. 13 5. The Bank’s standalone profit after tax increased by 14.1% from 25.32 billion Rupees in Q3 of 2014 to 28.89 billion Rupees in Q3 of 2015. The return on average assets was 1.90% in Q3 of 2015, about 14 basis points higher compared to Q3 of 2014. The Bank’s capital adequacy on a standalone basis as per Reserve Bank of India’s guidelines on Basel III norms continues to remain strong. Including the profits for the nine months ended December 31, 2014, the Bank’s total capital adequacy ratio at December 31, 2014 was 17.57% and the Tier 1 capital adequacy ratio was 12.96%. Excluding the profits for the nine month period, the total capital adequacy ratio was 16.39% and Tier-1 capital adequacy ratio was 11.78%. I now move on to the performance of subsidiaries and the consolidated results. The profit after tax for ICICI Life in Q3 of 2015 was 4.62 billion Rupees as compared to 4.28 billion Rupees in Q3 of 2014. The new business annualised premium equivalent increased from 8.68 billion Rupees in Q3 of 2014 to 12.90 billion Rupees in Q3 of 2015. The new business margin for the company improved to 11.4% in Q3 of 2015 compared to 10.9% in Q2 of 2015. The retail weighted received premium for ICICI Life has grown by a healthy 37.5% on a year-on-year basis during the period April to December 2014 compared to 1.7% decrease in FY2014. While the IRDA numbers 14 for the industry are not available, we understand that the company has seen an increase in its market share to over 11% during the period April to December 2014. The profit before tax of ICICI General increased from 0.78 billion Rupees in Q3 of 2014 to 2.27 billion Rupees in Q3 of 2015. The increase in profits was mainly on account of higher investment income and lower expense on account of claims & benefits in Q3 of 2015. The profit after tax increased from 0.76 billion Rupees in Q3 of 2014 to 1.76 billion Rupees in Q3 of 2015. The lower increase in profit after tax compared to profit before tax reflects the normalisation of tax expense, which in fiscal 2013 and fiscal 2014 was low due to losses carried forward from earlier years. The gross premium income of ICICI General decreased marginally by 1.7% on a year-on-year basis to 17.08 billion Rupees in Q3 of 2015 as the company adopted a calibrated approach to growth given the pricing trends in the industry. The company continues to retain its market leadership among the private players. While the IRDA numbers for the industry are not available, we understand that the company had a market share of about 8.5% during the period April to December 2014. ICICI Securities and ICICI AMC have continued to see improvement in their performance. The profit after tax for ICICI Securities increased from 0.35 billion Rupees in Q3 of 2014 to 0.76 billion Rupees in Q3 of 2015. The profit after tax for ICICI AMC increased 15 by 42.6% from 0.47 billion Rupees in Q3 of 2014 to 0.67 billion Rupees in Q3 of 2015. ICICI AMC sustained its market position as the second largest mutual fund in India during Q3 of 2015. Let me move on to the performance of our overseas banking subsidiaries. As per IFRS financials, ICICI Bank Canada’s total assets were 5.64 billion Canadian Dollars at December 31, 2014 compared to 5.49 billion Canadian Dollars at September 30, 2014. Loans and advances were 4.97 billion Canadian Dollars at December 31, 2014 compared to 4.77 billion Canadian Dollars at September 30, 2014. The profit after tax for Q3 of 2015 was 3.0 million Canadian Dollars compared to 10.0 million Canadian Dollars for Q3 of 2014 and 9.2 million Canadian Dollars in Q2 of 2015. The decrease in profits was on account of higher specific provisions on account of change in risk categorisation of a mid-sized India-linked account during the quarter. The capital adequacy ratio for ICICI Bank Canada was 33.2% at December 31, 2014. ICICI Bank UK’s total assets were 4.17 billion US Dollars at December 31, 2014 compared to 4.16 billion US Dollars at September 30, 2014. Loans and advances were 2.90 billion US Dollars at December 31, 2014 compared to 2.71 billion US Dollars at September 30, 2014. The profit after tax for ICICI Bank UK for Q3 of 2015 was 6.1 million US Dollars compared to 8.5 million US 16 Dollars in Q3 of 2014 and 5.1 million US Dollars in Q2 of 2015. The capital adequacy ratio was 21.8% at December 31, 2014. Going forward, ICICI Bank UK and ICICI Bank Canada will continue to focus on short term loans, working capital lines, trade & transaction banking products to multinational corporations, select local market corporates and subsidiaries & joint ventures of Indian companies, including through participation in syndication transactions. Additionally, ICICI Bank Canada would also continue to grow its securitized insured mortgages portfolio. We expect that the approach to lending in ICICI Bank UK and ICICI Bank Canada will also yield synergies for the clients’ Indian banking requirements. The Bank and its UK and Canada subsidiaries also continue to work towards optimising the capital invested in these subsidiaries. ICICI Bank Canada has made an application to the Office of Superintendent of Financial Institutions, or OSFI, seeking approval for a second round of capital repatriation. Let me now talk about the overall consolidated profits. The consolidated profit after tax grew by 13.7% from 28.72 billion Rupees in Q3 of 2014 to 32.65 billion Rupees in Q3 of 2015. The annualised consolidated return on average equity was at 15.5% in Q3 of 2015. 17 The Bank’s capital adequacy on a consolidated basis as per Reserve Bank of India’s guidelines on Basel III norms continues to remain strong. Including the profits for the nine months ended December 31, 2014, the consolidated total capital adequacy ratio at December 31, 2014 was 17.99% and the Tier 1 capital adequacy ratio was 13.13%. Excluding the profits for the nine month period, the consolidated total capital adequacy ratio was 16.83% and Tier1 capital adequacy ratio was 11.97%. In summary, we have continued to pursue our core operating strategy during the quarter. In line with our focus areas, we have: 1. Sustained the improvement in net interest margins; 2. Maintained healthy non-interest income; 3. Sustained improvement in our operating efficiency; 4. Seen continued healthy trends in CASA mobilisation; 5. Continued to scale up growth in the retail segment while calibrating growth in the corporate and SME segments in view of the environment; and 6. Achieved strong performance in our non-banking subsidiaries. We would continue to pursue these objectives, while closely monitoring corporate asset quality trends. We believe that our strong and diversified franchise and large distribution network give us the ability to leverage opportunities for profitable growth across 18 our businesses, even as asset quality trends would improve with a lag on the back of the expected economic recovery. We are wellplaced with regard to the capital required to support our growth, and given our current capital position, we believe that we do not need to raise capital for at least the next two fiscal years. In addition, we would explore opportunities to monetise a part of our insurance holdings, given the recent policy developments in this regard. With these opening comments, my team and I will be happy to take your questions. 19


© Copyright 2026