
Fortune favours the bold - Bank for International Settlements
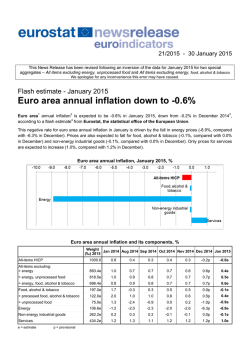
Mark Carney: Fortune favours the bold
Lecture by Mr Mark Carney, Governor of the Bank of England and Chairman of the Financial
Stability Board, to honour the memory of The Honourable James Michael Flaherty, P C,
Dublin, 28 January 2015.
*
1.
*
*
Introduction
It is a pleasure to be in Dublin and an honour to give this Iveagh House lecture in memory of
Jim Flaherty.
Jim’s attitude and actions typified the Flaherty family motto: Fortune Favours the Bold. Born
the sixth of eight children in La Chine, Quebec; Jim Flaherty worked odd jobs and won a
hockey scholarship to put himself through Princeton. Successful in private and public
sectors; he rose to become Attorney General and Minister of Finance of his province before
becoming Canada’s 37th Minister of Finance. Once there, his accomplishments were legion,
ranging from creating and enhancing support programs for the disabled and care givers to
setting the country back on the path to fiscal balance after the crisis and ensuing recession.
His tenure as Canadian finance minister was shaped by that crisis and its aftermath. It was
my honour to work with him as Canada weathered the storm. And many of you worked
closely with Jim as Ireland negotiated agreements with the Troika and devised policies to
rebuild its battered economy. I am confident he would be proud of the progress Ireland has
made.
I suspect he would be more than a little frustrated with the euro area, however. To his last
days he remained unconvinced that Europe had fixed its problems, often berating colleagues
at the G20 for the lack of progress. That was typical. Jim Flaherty was always forthright. He
wouldn’t avoid a problem, hoping it would get better.
On current projections it will take the euro area eight years to achieve the recovery that
Canada secured in two. Tonight I would like to draw on Jim’s legacy to reflect on how the
euro area could act to avoid another lost decade. This matters for Ireland, Europe and the
UK. The euro area is the world’s second largest economy. 1 With 27% of global banking
assets it is a key determinant of global financial stability. It is the UK’s largest trading partner
and the single largest destination for UK foreign direct investment.
The euro area would do well to live up to the Flaherty motto because, although there was
monetary boldness last week, the currency union has been relatively timid in putting in place
the other policies and, crucially, the institutions necessary to deliver sustainable prosperity
for its citizens.
Now is not the time for half measures. In all advanced economies, private investment is still
being held back by a combination of modest demand prospects and lingering concerns of
another major adverse shock. Nowhere are these impediments more severe than in the euro
area.
Since the financial crisis all major advanced economies have been in a debt trap where low
growth deepens the burden of debt, prompting the private sector to cut spending further.
Persistent economic weakness damages the extent to which economies can recover. Skills
and capital atrophy. Workers become discouraged and leave the labour force. Prospects
decline and the noose tightens.
1
At market prices. In PPP terms it is third largest after China and the US.
BIS central bankers’ speeches
1
As difficult as it has been, some countries, including the US and the UK, are now escaping
this trap. Others in the euro area are sinking deeper. This relative performance underscores
the importance of policy and institutions, particularly those that share and transfer risks.
Building institutions at a time of reform fatigue may not be easy, but it is essential.
Before I draw out this crucial point, I would like to quickly review how we got here.
2.
Setting the debt trap
Building the debt that now weighs on our economies was the work of a generation.
In the decade before the crisis, private financial balances became unsustainable. UK
households borrowed 4% of GDP year after year; Irish households at more than twice that
rate. Household debt peaked close to 100% of GDP in the UK, and 120% in Ireland. 2
This borrowing was largely for consumption and real estate investment rather than
businesses and projects that would generate the earnings necessary to service those
obligations. Property prices soared as a result (Chart 1).
Such excesses were possible because a decade of non-inflationary, consistent expansion
turned initially well-founded confidence into dangerous complacency. Beliefs grew that
globalisation and technology would drive perpetual growth, and that the omniscience of
central banks would deliver enduring stability.
With a growing conviction that financial innovation had transformed risk into certainty,
underwriting standards slipped from responsible to reckless and bank funding strategies from
conservative to cavalier.
Financial innovation made it easier to borrow. Bonus schemes valued the present and
discounted the future. Banks operated in a heads-I-win-tails-you-lose bubble and were
capitalised for perfection. And a steady supply of foreign capital from the global savings glut
– and in Ireland’s case, the initial euphoria of European Monetary Union – made it all
cheaper.
When the Minsky moment finally struck, debt tolerance decisively turned and the kindness of
strangers evaporated. UK households swung from borrowing 4% of GDP annually to saving
2% of GDP. The comparable swing in Ireland was more than twice as large. 3
In the wake of the crisis, three truths came back to the fore.
First, while asset prices rise and fall, debt endures.
Second, the distribution of debt and assets matters.
And third, it is very hard to reduce high debt in one sector or region without at least
temporarily increasing it in another.
The debt tail is wagging the market dog.
These realities continue to weigh on the European financial system.
It is often argued that the world is awash with liquidity and excessive risk taking. And yet the
rain is falling unevenly on the plain leaving some regions parched and others sodden.
Savings aren’t flowing freely to the areas that need them the most. This is certainly true in
the euro area, where many savings are trapped and much of finance remains fragmented.
2
While UK corporates accumulated debts to rival their household counterparts, Irish corporates surpassed that
with debt rising beyond 200% of GDP.
3
The UK and Irish private sectors swung dramatically into surplus (Charts 2 and 3).
2
BIS central bankers’ speeches
The result is demand compression, weighing on the outlook for growth and sustaining fears
that another major adverse shock is possible. Risk appetite is more fleeting than median
growth forecasts suggest.
The constellation of asset price moves since last summer bears this sober assessment out.
Yields on sovereign bonds have fallen across all maturities. France hasn’t borrowed this
cheaply since the ‘50s – the 1750s. Real rates are negative as far as the eye can see,
suggesting perpetually anaemic growth. 4
In the past six months, estimates of the equity risk premium have risen by over 100bps in the
UK and the euro area back to levels last seen in the heart of the crisis. 5 In addition, the
probability of large declines in equity prices implied by options prices rebounded during 2014.
This all suggests that investors may be attaching some probability to very bad outcomes,
possibly the tail risk of economies becoming stranded in a debt trap.
This market view is mirrored in elevated corporate caution. Investment remains subdued and
businesses continue to build cash in many advanced economies. 6 This is one reason why
the so-called “equilibrium” real interest rate is negative in many advanced economies, though
it has risen and is possibly now positive in others like the UK. 7 Reflecting these real
dynamics, central bank interest rates have had to be set at extraordinarily low levels and
supplemented by large scale asset purchases simply for monetary policy to remain neutral. 8
Escaping a debt trap requires a suite of measures including structural reforms to boost
productivity. But above all an economy needs to be able to channel all available savings –
household, corporate and foreign – to those sectors willing and able to spend. In many
respects, recent progress in the UK shows how.
3.
How the UK is escaping its debt trap
In recent years, the UK economy has shown increasing signs of normalisation. Non-financial
private debt has fallen by around 30% of GDP since its peak, the economy has grown
consistently above trend, and unemployment has fallen from a peak of 8.5% to less than 6%
today.
This performance underscores several structural features necessary to escape a debt trap.
The first is an integrated financial system which channels savings from one part of the
economy to investment in others. Since the near collapse of the UK banking system, bold
steps have since been taken to shore up its resilience. £140 billion of new bank capital has
4
Term premia, which measure investors’ compensation for holding long- rather than short-maturity claims, are
also estimated to have declined since last summer, perhaps reflecting growing expectations for central bank
asset purchases.
5
For the UK, December 2008; and for the euro area, June 2012.
6
The non-financial corporate sector was a net saver in Germany, Ireland, Spain, Greece and the UK at end
2013, based on Eurostat data (ESA 95 basis).
7
The “equilibrium” rate of interest is that which equates demand with potential output, thereby delivering
inflation at target in the absence of “cost-push” shocks.
8
As my colleague Ben Broadbent recently said, central banks aren’t the cause of low interest rates, but rather
are actors reading a script written by others, Broadbent, B (2014), “Monetary policy, asset prices, and
distribution”, speech at the Society of Business Economists Annual Conference.
BIS central bankers’ speeches
3
been raised in recent years, and banks’ performance in the recent UK stress test suggest
growing confidence in the resilience of the system is merited. 9
Second, the UK’s fiscal policy framework helps insure against severe systemic shocks.
The UK had the space to allow its automatic stabilisers to cushion the impact of the
recession. With the deficit rising to a peak of more than 10% of GDP before steadily
consolidating, fiscal policy effectively recycled elevated private savings and built a bridge to
the period when private balance sheets were repaired and confidence returned.
Fiscal stabilisers also play an important role in sharing risks across individuals, sectors and
regions, thereby reinforcing the resilience of the UK’s currency union. 10
A powerful demonstration of this comes with the recent sharp fall in global oil prices.
Because this risk is shared across the entire UK (which on the whole is a net beneficiary of
lower oil prices), the net impact on the Scottish public finances is a mere one tenth of what it
would have been if there were no risk sharing. 11 There are few clearer illustrations of the
benefits of sound fiscal arrangements in a currency union.
Third, the UK economy is open and flexible.
With a high degree of openness – its imports and exports summing to 60% of GDP – and a
flexible exchange rate, the UK has a safety valve that can be used to recycle surplus savings
to the rest of the world without driving down domestic demand, wages and prices.
The 25% depreciation of sterling that took place in the wake of the global crisis helped
smooth the path of adjustment, and also meant a “mark-to-market” gain to the tune of over
£500bn on the UK’s external balance sheet. 12
The UK labour market is also highly flexible. The fall in real incomes caused by the
depreciation of sterling was absorbed by employees, effectively purchasing faster job
creation. 13
In addition, large inflows of foreign capital – now financing a current account deficit of 6% of
GDP – mean spending and investment are higher than would otherwise be possible. This
underscores the value of the UK maintaining its attractiveness as an investment destination
through a competitive tax system, deep human capital, a flexible economy and ready access
to a wide range of markets.
Finally, the UK has a highly credible monetary policy framework.
The UK’s inflation target of 2% is symmetric: we care about inflation below the target as
much as above.
9
With other reforms to further the fairness and effectiveness of market-based finance, and major steps taken
towards end Too-Big-To-Fail, the UK is also on track to ensure greater risk-sharing between its creditors and
debtors.
10
It is estimated that on average around a fifth of variation in regional personal income relative to the national
average is stabilised by central government transfers. Estimates reported in Melitz and Zumer (2002),
“Regional Redistribution and Stabilization by the Center in Canada, France, the UK and the US: A
Reassessment and New Tests”. Journal of Public Economic, 86, pp. 263–286.
11
The geographical share of North Sea oil revenues, estimated by the Scottish Government, was 84.2% in
2012–3, down from 92.9% in 2008–9. In 2012–3, Scotland’s per capita share of North Sea oil revenues was
estimated by the Scottish Government to be 8.2%. See tables 4.4 and 4.5 of Scottish Government (2014),
“Government expenditure and revenue, Scotland 2012-3”.
12
Exchange rate effects alone led to an improvement of £573 billion to the UK’s net international investment
position between 2006 and 2008, estimated in Whittard (2012), “The UK’s External Balance Sheet – The
International Investment Position (IIP)”, ONS, March.
13
See Carney (2014), Speech at the 146th Annual Trades Union Congress, Liverpool.
4
BIS central bankers’ speeches
Our remit recognises that the inflation rate may, on occasion, depart from the target and that
attempts to keep it at the target may cause undesirable volatility in output. That flexibility and
focus meant that the Bank’s Monetary Policy Committee (MPC) could provide additional
stimulus through historically low interest rates, large scale asset purchases and monetary
policy guidance even when inflation was temporarily above target.
Inflation has recently dropped sharply to 0.5% – equalling its lowest rate on record.
So next month I will write the first open letter from a Bank of England Governor to a
Chancellor explaining why the inflation rate is too low and what we are going to do about it.
The why is relatively straightforward. The majority of the weakness is caused by sharp falls in
commodity prices, most notably oil, which has suffered its third largest fall in the past half
century.
Lower energy and food prices are unambiguously positive for the UK. Temporarily low
inflation will boost real take-home pay and help household finances.
Commodity prices do not explain wholly why inflation is so low. Generalised inflationary
pressures in the economy are also subdued. Core inflation measures are running at 1.3%.
That is a legacy of a long period following the crisis in which unemployment has been high
and wage growth muted. 14
With additional falls in petrol prices in the pipeline, inflation is likely to fall further over the
coming months and turn slightly negative for a period. It should pick up again in twelve
months or so as the direct effects of a lower energy price drop out of the inflation rate.
The Bank has the means, will and responsibility to return inflation to the 2% target within the
next two years. That is consistent with the average horizon over which the MPC has sought
to return inflation to target following overshoots in the past and with the nature of shocks the
UK currently faces.
The UK economy is expanding solidly. Over half a million jobs have been created in the past
year and there are signs that wage growth is picking up. Interest rates can be expected to
begin to return towards more normal levels over the next few years. Relative to what we and
the markets expected a year ago, that path of interest rate increases can be expected to be
more gradual and more limited.
4.
What is needed in the euro area?
The challenges for monetary policy are much greater in the euro area than in the UK.
Since the crisis, euro area nominal GDP has increased by a mere 5% in almost seven years.
Consumer price inflation is already below zero. Core inflation has been running at or below
1% for over a year.
This is potentially dangerous. Low nominal growth is intensifying the euro area’s debt burden
(Chart 4). 15 The fear of stagnation is holding back spending and investment.
The ECB’s actions last week were timely and welcome. They were also important not least
because they removed any residual concerns about whether it has the will or means to meet
its price stability mandate. By doing so, the ECB has reduced tail risks associated with the
debt overhang to the extent monetary policy can or should.
14
Unit labour costs rose by 0.5% in the year to 2014Q3, and unit wage costs rose by 0.9% over the same
period, based on the MPC’s backcast for UK GDP.
15
Aggregate euro-area household debt was 61% of GDP in 2007 and stood at 64% in 2013. The corresponding
figures for non-financial corporates were 94% in 2007 and 100% in 2013 and 66% and 92% respectively in the
aggregate government sector.
BIS central bankers’ speeches
5
However, the ECB alone cannot eliminate the risks of a prolonged stagnation. These exist
primarily because, in most respects, the current construction of the euro area is unfinished. 16
With limited cross-border banking in the euro area, savings don’t flow to potential
investments. Euro-area corporates’ cash balances have risen to the tune of €420 billion, or
3% of GDP, since the crisis, for example. Modest cross-border equity flows mean inadequate
risk sharing. Moreover, by design, there are virtually no cross-border fiscal flows so fiscal
space is separated from fiscal needs.
The burden of adjustment has been concentrated on efforts to improve
competitiveness.
Some of these efforts are entirely worthy. Boosting productivity reduces the burden of a debt
overhang as extra supply creates extra demand and incomes. But that takes time, during
which debt dynamics may become oppressive.
Improved competitiveness will also support exports to the rest of the world, but it is unlikely to
be decisive in a listless world economy. More important for a given country in the euro area
is to improve competitiveness against other members via internal devaluation. As you know,
this is not easy. 17, 18
Irish workers and citizens deserve great credit for the flexibility they have shown. Wages in
Ireland fell by almost 9%. In Spain they rose by 3%. Even though Irish unemployment rose to
painfully high rates, it peaked at only a little over half the rate reached in Spain.
That flexibility, by keeping unemployment lower than otherwise, has undoubtedly helped to
reduce the risk that high unemployment becomes entrenched and destroys future economic
capacity.
For three reasons it is no panacea, however.
First, internal devaluations simply reallocate demand within the currency union. They do not
boost aggregate demand in the euro area as a whole. Put another way, since
competitiveness is relative, a solution for some cannot be a solution for all.
Second, the degree of flexibility is not just an abstract economic choice; it is also a political
one that determines the burden of risk sharing between labour, firms, and the state. 19
Third, internal devaluation always forces down nominal incomes for a time, regardless of the
degree of price and wage flexibility. 20 In more flexible economies, these reductions are
concentrated in wages; in less flexible ones, unemployment. Cumulative nominal GDP
growth since the crisis has been no better in Ireland than it has been in Spain. And it is this
16
As President Draghi recently said, EMU is incomplete and there is unfinished business. See Draghi (2014),
“Stability and prosperity in monetary union”, speech at the University of Helsinki, Helsinki, 27 November 2014.
17
A truth laid bare by the large flow of people out of the Irish economy, overwhelmingly to economies outside the
euro area, since the crisis (Chart 5).
18
The only way to recycle surplus savings in peripheral economies has been to export them. But since
peripheral countries are not the average euro area economy, the euro exchange rate has not depreciated as
far as would be warranted for them alone. To move to running a current account surplus, they have needed to
undergo painful internal devaluation against the core countries of the euro area, by driving down demand,
prices and wages. The current account of Ireland has moved from a deficit of 6.6% of GDP to a surplus of
almost 6% today.
19
In this regard it is impressive that some suggest centralised oversight and influence over such decisions. See
Draghi (op. cit.) and Trichet, J C (2011), “Building Europe, building institutions”, on receiving the Karlspreis
2011 in Aachen, 2 June 2011.
20
Real incomes should eventually rise if structural reforms generate a productivity dividend.
6
BIS central bankers’ speeches
weakness of nominal income growth that is so harmful in dealing with a debt overhang and
creates the tail risk of stagnation.
So if increased flexibility is not sufficient, what else is required?
The answer is to build the risk sharing institutions that are present in any successful currency
union. This means financial integration and common fiscal arrangements. In other words,
both private and public risk sharing. It is not realistic to expect the private sector to do
everything the public sector will not.
Before the crisis, the European financial system appeared in many respects to be highly
integrated with cross-border bank loans amounting to more than a third of total bank lending.
However, most of this was interbank loans, implicitly backed by the state. With many of the
recipients being judged too big to fail during the crisis, creditors weren’t exposed to loss for
fear of systemic damage.
Since the crisis, cross-border banking lending has halved, and the ability of the European
system to recycle the surplus savings of peripheral nations to other parts of the private sector
has been severely curtailed.
The good news is that European authorities recognise the need to re-found the euro
area financial union on the principle of risk sharing.
The current fragmentation of the system stems in part from a collapse of confidence in
financial institutions across national borders. The recent Asset Quality Review and stress
tests conducted by the ECB represent a major step towards restoring that confidence. Close
to €60billion of capital has been raised since January 2014 as a result. 21
The establishment of a Banking Union and Single Resolution Mechanism as well as
implementation of the G20 proposal on Total Loss Absorbing Capacity (TLAC) will help break
the link between sovereigns and banks and establish greater risk sharing between creditors
and debtors. When combined with improved resiliency of banks, more sustainable crossborder banking flows should grow with time.
It is also welcome that the new Commission has advocated the creation of a Capital Markets
Union to boost cross-border flows of market-based finance. Such a union would deepen the
single market, could benefit all member states, and could promote much greater crossborder risk sharing within the euro area.
Had the cross-border financing of deficit countries taken the form of equity rather than debt,
firms in deficit countries would have been more robust and losses would have been
dispersed.
In addition, greater direct market-based debt financing could also help share risks. For
historical reasons Europe has a much less well developed system of market-based finance,
with banks dominating the provision of credit. 22 This need for diversity is one reason why the
Bank of England and the ECB are working towards proposals to revive the European
securitisation market. 23
21
See ECB (2014), “Aggregate report on the comprehensive assessment”, October.
22
In the euro area, banks have historically played an important role in financing the real economy. Banks loans
account for around 50% of firms’ external financing, which is very different from the US where around 80% of
firms’ financing comes from capital markets (equity and debt securities).
23
Had debts taken the form of corporate bonds or proper securitisations with real risk transfer, defaults by
borrowers in the periphery would have been passed to the creditors in the core and this would have meant the
financial system was more reliably available post crisis.
BIS central bankers’ speeches
7
To achieve this, the significant home bias in equity investment within Europe will need to be
reduced, through measures such as the removal of national restrictions on investments by
funds, greater provision of cross-border borrower information and greater pre and post trade
transparency of prices and investment terms.
These reforms hold out some promise of helping to prevent a repeat of the crisis. Unlike
banking union, they do not require institutional changes. They will benefit all member states
in the single market. However, they will take time to design and longer to implement, and
they will have no impact on the burden of the debt overhang that already exists.
For complete solutions to both current and potential future problems the sharing of
fiscal risks is required.
It is no coincidence that effective currency unions tend to have centralised fiscal authorities
whose spending is a sizeable share of GDP – averaging over a quarter of GDP for advanced
countries outside the euro area (Table 1).
I have already discussed how parts of the UK have benefitted from fiscal risk sharing. The
euro area also stands out from federal systems like the US, Canada and Germany. In those
systems, the impact of localised shocks to income is reduced by between one tenth and one
fifth by centralised fiscal transfers (Chart 6).
Without this risk sharing, the euro area finds itself in an odd position.
As the Presidents of the European Council, European Commission, Eurogroup and
European Central Bank argued in their report, European Monetary Union will not be
complete until it builds mechanisms to share fiscal sovereignty.
Possible options for sharing fiscal risks range from a transfer union to a pooled employment
insurance mechanism. The latter would appear to be an opportunity to combine the current
enthusiasm for labour market reform with the longer term imperative to build elements of an
efficient transfer union. And it would ensure risk sharing was based on cyclical, rather than
structural, labour market positions.
And what of short-term fiscal dynamics in the euro area? President Draghi recently
underscored the importance of fiscal policy as a short term stabilisation tool as well as the
difficulty of utilising it in the current imperfect union.
Consider the following comparison between the euro area and the UK.
In the euro area, the private sector continues to generate surplus savings of 3½% of GDP
(Chart 7). Those must be recycled effectively to generate an expansion. The UK no longer
faces that challenge. Its private sector is in balance.
The euro area unemployment rate of 11½% is twice that in the UK.
Gross general government debt in the euro area is roughly the same as in the UK and below
the average of advanced economies.
The weighted average yield on 10-year euro area sovereign debt is around 1%, compared to
1½% in the UK.
And yet, the euro area’s fiscal deficit is half that in the UK. It structural deficit, according to
the IMF, is less than one third as large.
It is difficult to avoid the conclusion that, if the euro zone were a country, fiscal policy would
be substantially more supportive. However, it is tighter than in the UK, even though Europe
still lacks other effective risk sharing mechanisms and is relatively inflexible. A more
constructive fiscal policy would help recycle surplus private savings and mitigate the tail risk
of stagnation. It would also bridge the drag from structural reforms on nominal spending and
would be consistent with the longer term direction of travel towards greater integration.
It would be bold, and it would be favoured by fortune.
8
BIS central bankers’ speeches
5.
Conclusion
Jim Flaherty understood the importance of having a plan, and implementing it diligently and
clearly.
Not just because, as policymakers, that is our job. But also because in the absence of such a
plan, businesses and households would shy away from the risk-taking we need for a
sustained global expansion.
Europe needs a comprehensive, coherent plan to anchor expectations, build confidence and
escape its debt trap.
That plan begins but does not end with the monetary policy boldness of the ECB.
That plan includes difficult structural reforms, but cannot be wholly reliant on them.
That plan requires greater private risk sharing via banking and capital markets unions.
But that plan also needs to recognise that private risk sharing will never fully replace public
risk sharing so that plan should include what every other successful currency union has at its
heart: mechanisms to share fiscal sovereignty.
As of this evening, progress on structural reforms in the euro area remains uneven. Cross
border risk sharing through the financial system has slid backwards. Europe’s leaders do not
currently foresee fiscal union as part of monetary union. 24
Such timidity has costs.
I think we all know what Jim Flaherty would have said about that.
24
As President Draghi recently noted, “In other political unions, cohesion is maintained through a strong
common identity, but often also through permanent fiscal transfers between richer and poorer regions that
even out incomes ex post. In the euro area, such one-way transfers between countries are not
foreseen…”
BIS central bankers’ speeches
9
Chart 1:
Chart 2:
House prices(a) rose significantly
during the boom years across euro area
periphery countries and in the UK
UK private sector swung sharply into
surplus when the crisis hit but now back
close to balance…
(a) Nominal house price indices. Source: OECD.
Source: Eurostat (ESA 95 definitions).
Chart 3:
Chart 4:
… while Irish private sector
surplus endures
Aggregate euro area debt has not
fallen relative to GDP since 2007
Non-financial private sector
General government
30
Other (incl rest of world)
20
10
Net saving
Per cent of GDP
0
-20
-30
2002
2004
2006
2008
2010
2012
Source: Eurostat (ESA 95 definitions).
10
-40
Net borrowing
-10
Source: Buttiglione, L, Lane, P, Reichlin, L and
Reinhart, V (2014) “Deleveraging, what deleveraging?”,
Geneva Reports on the World Economy, 16, Centre for
Economic Policy Research.
BIS central bankers’ speeches
Chart 5:
Chart 6:
Net migration(a) from Ireland
overwhelmingly to economies outside the
euro area since the crisis
Risk-sharing in EMU substantially
lower than in Canadian, US and German
federal systems
(a) Cumulative net migration between 2009–14 from
Ireland by destination. Source: Central Statistics Office
of Ireland.
Source: IMF – Toward a fiscal union for the euro area,
technical background notes (September 2013). Based
on Hepp and von Hagen (2012) for Germany;
Asdrubali, Sorensen and Yosha (1998) for the US;
Balli, Basher and Rosmy (2011) for Canada; and
Afonso and Furceri (2008) for the EMU and EU.
Chart 7:
Rest of the world now borrowing
from the euro area as a whole
Source: Eurostat (ESA 95 definitions).
BIS central bankers’ speeches
11
Table 1:
General and central government expenditure as a % of GDP
General government
expenditure,
% of GDP
Central government
expenditure,
% of GDP
Australia
36
26
Austria
53
27
Belgium
53
30
Canada
44
17
Czech Republic
44
30
Denmark
58
42
Estonia
40
30
Finland
56
28
France
57
24
Germany
48
16
Greece
51
40
Hungary
50
33
Iceland
52
40
Ireland
65
58
Israel
45
39
Italy
50
29
Japan
41
18
Korea
30
20
Luxembourg
44
31
Mexico
23
19
Netherlands
51
31
Norway
45
36
Poland
45
27
Portugal
51
39
Slovak Republic
40
23
Slovenia
49
31
Spain
46
19
Sweden
52
30
Switzerland
34
11
Turkey
40
29
United Kingdom
50
46
United States
43
26
Source: OECD
Notes: Table shows ratios of nominal government expenditure to nominal GDP
for 2010.
12
BIS central bankers’ speeches


© Copyright 2026