
No Slide Title - PT. Media Nusantara Citra Tbk
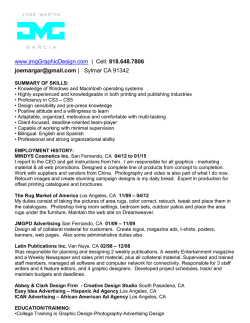
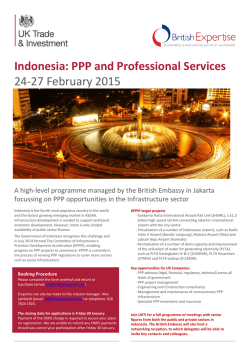
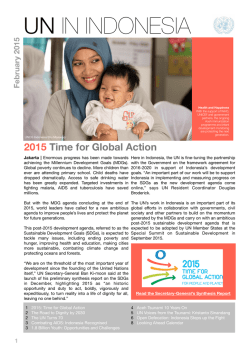
Listed and traded on the Indonesia Stock Exchange STOCK CODE: MNCN MNC Media PT Media Nusantara Citra Tbk. Corporate Update January 2015 Disclaimer By attending this presentation, you are agreeing to be bound by the restrictions set out below. Any failure to comply with these restrictions may constitute a violation of applicable securities laws. The information and opinions contained in this presentation are intended solely for your personal reference and are strictly confidential. The information and opinions contained in this presentation have not been independently verified, and no representation or warranty, expressed or implied, is made as to, and no reliance should be placed on the fairness, accuracy, completeness or correctness of, the information or opinions contained herein. It is not the intention to provide, and you may not rely on this presentation as providing, a complete or comprehensive analysis of the condition (financial or other), earnings, business affairs, business prospects, properties or results of operations of the company or its subsidiaries. The information and opinions contained in this presentation are provided as at the date of this presentation and are subject to change without notice. Neither the company (including any of its affiliates, advisors and representatives) nor the underwriters (including any of their respective affiliates, advisors or representatives) shall have any responsibility or liability whatsoever (in negligence or otherwise) for the accuracy or completeness of, or any errors or omissions in, any information or opinions contained herein nor for any loss howsoever arising from any use of this presentation. In addition, the information contained in this presentation contains projections and forward-looking statements that reflect the company's current views with respect to future events and financial performance. These views are based on a number of estimates and current assumptions which are subject to business, economic and competitive uncertainties and contingencies as well as various risks and these may change over time and in many cases are outside the control of the company and its directors. No assurance can be given that future events will occur, that projections will be achieved, or that the company's assumptions are correct. Actual results may differ materially from those forecast and projected. This presentation is not and does not constitute or form part of any offer, invitation or recommendation to purchase or subscribe for any securities and no part of it shall form the basis of or be relied upon in connection with any contract, commitment or investment decision in relation thereto. This presentation may not be used or relied upon by any other party, or for any other purpose, and may not be reproduced, disseminated or quoted without the prior written consent of the company. Any investment in any securities issued by the company or its affiliates should be made solely on the basis of the final offer document issued in respect of such securities. The contents of this presentation may not be reproduced, redistributed or passed on, directly or indirectly, to any other person or published, in whole or in part, for any purpose. 2 Section 1 Indonesia’s Media Industry Update Macro drivers support industry growth Population (2012) A Young Population : 80% - Below 50yr What are the macro drivers? 3% Millions A large & young population 13% 1,361 29% 1,223 200mn people below age of 50 A rising middle class 244 95 69 Strong economic growth driven 29% 29 23 5 by domestic consumption 26% 0-14 Source: MPA 2013 30-49 50-69 Source: Indonesia Bureau of Statistics 2012 Completed Education Level NA 22% 15-29 University 4% Monthly Household Expenditure (Rp1,000) E <600 5% Academy 3% D 601900 13% A1 3500 6% A2 2501- 3500 9% Senior High 29% Only 4% of population has university degrees Indonesians prefer to watch TV than to read, watching 5 hours of TV per day. C1 12511750 26% Junior High 19% Source: Indonesia Bureau of Statistics 2012 40mn TV household B 17512500 20% C2 9011250 21% Elementary 23% 70+ Source: Nielsen Media Research 4 Indonesia net ad spend growth highest in the region Media Partners Asia forecasts net ad spend growth of 15.5% in 2014 Growth is among the highest in the region Indonesia’s ad spend is growing from a small base; we expect growth to be sustainable Asia Pacific Net Adspend (2013 – 2014F) Asia Pacific Net Adspend Growth (2013-2014F) 2013 2014F In USD billion 2013 2014F Source: Media Partners Asia 2013 5 Well Positioned in a Conducive Growth Environment Net ad spend as % of GDP is the lowest in the region indicating solid growth potential The price for a 30 seconds prime time spot is cheap compare to other ASEAN countries Net Adspend as a Percentage of GDP (2013) 30 seconds prime time spot In USD/spot 0.9% $17,136 0.7% 0.7% 0.6% 0.6% $10,800 0.5% 0.4% 0.4% 0.4% 0.3% 0.3% 0.3% 0.3% 0.2% $5,400 Indonesia Thailand Philippines Source: Media Partners Asia 2014 6 Industry Dynamics Prime time advertising slots are limited; strong demand for advertising Local brands have been aggressive in advertising to compete with multi national companies We expect automotive and financial companies to increase TV advertising budget Limited supply: Only 10 FTA TV stations Demand (More brands advertising on TV) 4% 18% 34% 15% MNC Group EMTEK Trans Corp Visi Media Other 29% Source: Nielsen Prime time all demographic December 2014 7 Low Penetration Rates in Key Segments Asia Pacific TV Penetration of Total Households (2012-2014F) 100% 100% 100% 99% 100% 100% 100% 100% 96% 96% 99% 99% 97% 97% 97% 97% 93% 93% 85% 86% 82% 84% 61% 62% 58% 60% 2012 2014F Korea Japan Singapore Hong Kong Malaysia Australia Newspaper Circulation in Indonesia 6.0 Millions China Thailand Taiwan Vietnam Philippines India Indonesia Internet Household Penetration in Indonesia 6.0 30.2% 27.1% 5.9 23.7% 5.8 18.0% 20.5% 5.7 2010 2011 Source: Media Partners Asia 2012 2013 2014 2010 2011 2012 2013 2014 8 Indonesia’s Media Advertising Market Share Given the infrastructure constraint, TV is the only medium to reach a mass audience. TV advertising is expected to maintain a dominant market share Online advertising to take market share from Newspaper and Magazine 2019F 2014 OOH, 2.2% Radio, 1.3% OOH, 2.0% Online/Mobile, 7.3% Radio, 1.1% Online/Mobile, 10.5% Magazines, 2.6% Magazines, 2.4% Newspapers, 20.4% Newspapers, 18.2% TV, 65.8% TV, 65.5% Source: Media Partners Asia 9 Section 3 MNC Update The Largest Integrated Media Company in Southeast Asia Free-To-Air TV Content Sindo Media Others News Portal PAY TV Channels Tabloid & Magazine Radio More channels will be added Content library contains more than 200,000 hours and increasing by more than 15,000 hours per year 11 Our 4 Key Growth Drivers RCTI, MNCTV, and Global TV grow significantly outperforming the industry 19 exclusive channels on MNC Sky Vision to generate ad revenue SINDO TV to become a national network with focus on news and infotainment Integrated TV studios to be completed in mid 2015 is set to reduce programming and operation cost 12 Content is King Creating the best content is our top priority Content is the only way to capture audience share and monetize advertising dollars Indonesians love “Sinetrons” and we broadcast many of the top drama series We have licensed popular International programs such as Master Chef, Indonesia Idol and X Factor Exclusive programming with top Hollywood studios More than 150,000 hours of content library and increasing by more than 15,000 hours annually We also have 20 MNC branded Pay TV Channels. These channels are integral to our content strategy “Content is where I expect much of the real money will be made on the Internet, just as it was in broadcasting. The television revolution that began half a century ago spawned a number of industries, including the manufacturing of TV sets, but the long-term winners were those who used the medium to deliver information and entertainment.” “Content is King” by Bill Gates in 1996 All-time Nielsen TV stations ranking Rank 1 2 3 4 5 6 7 8 9 10 Station RCTI SCTV ANTV MNCTV IVM TRANS7 TRANS GTV TVONE METRO Target Audience ABC ABCD ABC ABCD ABCD ABC ABC ABC ABC AB Week I Jan 2015 Share 16,3 16,2 11,6 11,4 9,2 8 7,9 7,0 7,0 4,2 Source: Nielsen Monthly Prime Time All Demographic Audience Share 13 Strong recovery in Audience Share since June 2014 40 35 30 MNCN EMTK 25 VIVA TRANS 20 15 10 Jan-14 Feb-14 Mar-14 Source: Nielsen prime time audience share Apr-14 May-14 Jun-14 Jul-14 Aug-14 Sep-14 Oct-14 Nov-14 Dec-14 Jan-15 14 RCTI’s Prime Time is back to No. 1 Launched of 7 Manusia Harimau in Nov’14 24.0 22.0 20.0 18.0 RCTI SCTV 16.0 Plot Twist on Main Character and More Innovative story line 14.0 12.0 10.0 Jan-14 Feb-14 Mar-14 Source: Nielsen prime time audience share Apr-14 Mei-14 Jun-14 Jul-14 Agust-14 Sep-14 Okt-14 Nop-14 Des-14 Week I Jan 2015 15 MNC TV is Gaining Back Audience Share 15.0 14.0 Started airing Boboi Boy in Oct 20th 2014 Adit & Sopo Jarwo Audience share has increased drastically to 19.4% since moving to early Prime-Time. 13.0 12.0 MNC TV 11.0 IVM 10.0 9.0 8.0 7.0 Apr-14 May-14 Source: Nielsen prime time audience share Jun-14 Jul-14 Aug-14 Sep-14 Oct-14 Nov-14 Dec-14 Jan-15 16 Key Drama Series on RCTI 17 MNC Has The Best Talent Search Format Lineup 18 The most comprehensive Pay TV Channels line-up We have the most comprehensive Pay TV channel lineup in Indonesia Our customers prefer local content Producing content in Bahasa Indonesia is our competitive advantage We generate subscription revenue and advertising revenue Sports Movies Lifestyle News Entertainment Kids Local content means it is the leader in its Pay TV category 19 Top 20 Channels December 2014 NO. CHANNEL NO. CHANNEL 1 Cartoon Network 11 History 2 3 Disney Junior 12 AXN MNC Sports 2 13 MNC Comedy 4 Disney Channel 14 MNC Infotainment 5 MNC Shop 15 Vision 2 Drama 6 S-one 16 Cinemax 7 MNC Kids 17 Fox Crime 8 9 MNC Business 18 MNC Sports1 Fox Movies Premium 19 MNC Movie 10 Cbeebies 20 MNC Entertainment Source: AGB Nielsen Report 20 Pay TV Channels to drive ad revenue for MNCN OPPORTUNITIES MNC Channels share of Pay TV audience in 2013 MNCN has produced and packaged 20 Pay TV channels exclusively for MNC Sky Vision. In return MNCN receives 100% ad revenue MNC Sports, MNC Infotainment, MNC News and MNC Business, MNC Music are # 1 ranked in their respective categories versus International peers MNC Food & Travel and MNC Kids was recently launched. We will add 2 more channels: MNC Home & Living and MNC Wedding Rank Sports Channel We expect MNC Channels to generate meaningful advertising revenue as subscribers grow 28% Rank News Channel Channel Share 1 MNC Sports 2 4.65 1 MNC News 1.60 2 MNC Sports 1 3.21 2 Channel New Asia 0.04 3 Star Sports 1.17 3 CNN International 0.04 4 Euro Sports 0.45 4 AL Jazeera International 0.03 Rank Lifestyle Channel Channel Share 1 MNC Infotainment 3.05 1 MNC Music 1.32 2 MNC Lifestyle 2.17 2 Channel V 0.40 3 Asian Food Channel 0.42 3 Trace 0.04 4 MNC Fashion 0.26 4 NGC Music 0.02 Rank Entertainment Channel Channel Share Channel Share Rank Music Channel Rank Business Channel Channel Share Channel Share 1 S-One 4.08 1 MNC Business 0.32 2 MNC Entertainment 3.19 2 Bloomberg 0.00 3 AXN 1.96 3 CNBC Asia 0.00 4 MNC Drama 1.88 Source : Nielsen TV Audience Measurement 2013 MNC Channels Rest of market 72% 21 SINDOTV has full national coverage Sabang Banda Aceh Lhokseumawe Medan Pematang Siantar Tarakan Batam Pontianak Pekan Baru Payakumbuh Bukit Tinggi Padang Samarinda Bengkulu Lubuk Linggau Lampung Pangkal Pinang Palangkaraya Banjarmasin Palembang Jakarta Cirebon Semarang Bandung Tasikmalaya Banyumas Magelang Manado Gorontalo Ternate Manokwari Palu Biak Mamuju Pleihari Makassar Kendari Nebire Ambon Merauke Surabaya Bali Mataram Kupang Total : 46 stations • MNC has just acquired a local Jakarta TV giving us full national coverage on SINDOTV • The focus will be 24 hours news, entertainment and sports 22 Highly Qualified and Experienced Management Team Hary Tanoesoedibjo CEO, MNC Group 21 years of relevant experience Kanti Mirdiati Imansyah Director 23 years of relevant experience Faisal Dharma Setiawan CFO 25 years of relevant experience Diana Airin Director 14 years of relevant experience Group President & CEO of MNC since March 2004 Founding shareholder and Group Executive Chairman of PT Bhakti Investama Tbk. since 1989 Currently holds positions in several other companies, including Group President & CEO of PT Global Mediacom Tbk. since 2002, President Commissioner of RCTI since 2008, President Commissioner of PT MNC Sky Vision (Indovision), President Commissioner of Media Nusantara Informasi since 2008, President Commissioner of MNC Networks since 2008, President Commissioner of MNC Pictures since 2007, and many other companies within MNC Media and Bhakti Investama Group MBA degree from Ottawa University, Canada Bachelor of Commerce (Honors) degree from Carleton University, Ottawa, Canada Director Sales and marketing of RCTI from 2010 – 2012 GM Sales and Marketing manager and Director Sales and Marketing of CTPI from 2006-2010 AVP Sales and Marketing of Duta Visual Mandiri from 2003-2006 Head of Acquisition Manager of RCTI from 2002 – 2003 Sales Group Head Trans TV from 2000 – 2003 Sales Group Head & Account Executive1990 – 2000 Bachelor Degree of Science from La Jolla Academy of Advertising Arts and Associate Degree Fashion Merchandising from IFS San Diego, USA Independent Advisor - Business Solutions & Strategy for life and health insurance & Bank in 2013 Chief Executive Officer in PT Asuransi Jiwa Adisarana WanaArtha in 2012 Vice Chief Finance Officer – Strategy & Finance in PT Bank CIMB Niaga Tbk. in 2009 Commissioner in PT CIMB Sunlife in2009 Commissioner in PT Asuransi CIGNA in 2009 Director of Indo Kordsa Pension Fund (DPPK) in 1996 Graduated from Prasetya Mulya, Graduate School of Management with “MM” degree in International Business in 2001 Graduated from Universitas Katolik Parahyangan with Civil Engineer Degree (Bachelor Degree) in 1984 President Director of PT. Media Nusantara Informasi, PT. MNC Networks (Radio), & PT. Cross Media International (Media Buying Agency) since 2013 Director of Sales Marketing of Seputar Indonesia, SUN TV, High End & High End Teen, and Network Magazine in 2010 Bachelor Degree of Economy – Management from Tarumanegara University 23 Highly Qualified and Experienced Management Team Ella Kartika Director 27 years of relevant experience Gwenarty Setiadi Director 27 years of relevant experience Charlie Kasim Independent Director 12 years of relevant experience Managing Director in PT Global Informasi Bermutu in 2013 Programming & Production Director in PT Rajawali Citra Televisi Indonesia in 2011 Programming & Production Director in PT Global Informasi Bermutu in 2010 Sales & Marketing Director in PT Global Informasi Bermutu in 2008 Obtained Master of Management Program from University of Indonesia majoring in Finance & Banking in 1998 Director of Human Resources and General Services in PT MNC Sky Vision Tbk in 2009 General Human Manager Human Resources and General Services in PT Media Nusantara Citra Tbk in 2008 Vice President (VP), Human Resources and General Services in Citibank in 2007 Vice President (VP), Head of Direct Sales Training Academy & HRRM in Citibank in 2005 Vice President (VP), Outsourcing Management Head in Citibank in 2004 Assistant Vice President (AVP), Sales Human Resources and Compliance Manager in Citibank in 2000 Manager, Sales Recruitment and Training Manager in Citibank in 1998 Graduated from University of Satya Wacana with Bachelor degree in Agronomy in 1982 Deputy Finance and Technical Director in PT Rajawali Citra Televisi Indonesia in 2013 Finance Director, Technical Director, Operational Director and Head of Procurement of PT Cakrawala Andalas Televisi (ANTV) in 2011 Chief Finance Officer in PT. Visi Media Asia Tbk (VIVA) in 2007 Finance/HR/Sales Director & CEO at PT. Viva Media Baru (Previously vivanews.com, now VIVA.CO.ID) in 2008 Finance Director and Head of Procurement at PT. Lativi Media Karya (tvOne, previously known as Lativi) in 2007 Operational Director at PT. Fajar Bumi Sakti (coal mining company based in East Kalimantan) in 2005 Commissioner of PT. Bakrie Swasakti Utama (Bakrie real estate company handling Taman Rasuna Apartement, Pasar Festival and Klub Rasuna) in 2003 Vice President for Collection of PT. Bakrie Finance Corporation Tbk in 2002 Obtained MBA in Finance from University of Houston in 1997 24 Section 4 Financial Update Media Nusantara Citra Financial Performance from 12M 2011 until 12M 2013 12M 2011 to 12M 2013 Financials IDR trillion 2011 2012 2013 CAGR +5% CAGR +6% CAGR +10% 8.80 6.26 5.39 8.96 9.62 6.83 6.52 7.29 7.74 CAGR +23% 1.79 Revenue 2.38 2.72 EBITDA Asset Equity 12M 2011 to 12M 2013 Solvency Metrics 2011 55.83x 2012 2013 66.23x 47% 33% 30% 20% Debt / EBITDA Source: Company Financials 12% 10% 7% Debt / Equity 38% 42% 46% 40% 43% 51% 50% 52% 11.66x EBITDA / Interest EBITDA Margin 3 TV EBITDA Margin RCTI EBITDA Margin 26 MNCN (RCTI+GTV) vs. SCMA (SCTV+Indosiar) (In million Rupiah) Revenue RCTI GTV Total SCMA 3Q 2013 3Q 2014 YoY 799,032 198,560 997,592 913,015 897,402 201,368 1,098,770 945,836 12.31% 1.41% 10.14% 3.59% • More appropriate to compare RCTI + GTV with SCMA which only has 2 TV stations • We have outperformed the industry in growth and margins. Core EBITDA RCTI GTV Total SCMA 387,738 59,927 447,665 445,538 460,343 63,152 523,495 405,117 18.73% 5.38% 16.94% -9.07% EBITDA margins RCTI GTV Total SCMA 48.53% 30.18% 44.87% 48.80% 51.30% 31.36% 47.64% 42.83% 277 118 277 -597 • RCTI is by far the most dominant TV station in Indonesia, it’s EBITDA alone is bigger than our competitor. MNCN is undervalued, trading at 30% discount to our competitor. The analysis above does not take into account earnings from MNC TV, Sindo TV, and 19 Pay TV channels. 27 Summary of Financial Performance FY 2012 & 2013 – 9M 2013 & 9M 2014 IDR billion 12M 2012 12M 2013 %chg 9M 2013 9M 2014 %chg 6,265 6,522 4% 4,749 5,044 6% Advertising 5,351 5,720 7% 4,373 4,680 7% Advertising excluding Euro Cup 5,188 5,720 10% - - Content 197 267 36% 76 145 Value Added Services 216 0 -100% - - Others 500 536 7% 301 219 -27% Operating expenses 4,050 3,962 -2% 2,984 3,132 5% Core EBITDA 2,375 2,721 15% 1,883 2,041 8% Core EBITDA Margin 38% 42% 40% 40% Net Income 1,657 1,691 1,270 1,389 Revenue 2% 92% 9% 28 MNC Commands Highest Power Ratio Channel RCTI MNCTV GTV MNC Group SCTV IVM EMTEK Group Trans Trans7 Transcorp ANTV TVOne VIVA Group Metro TVRI1 Others Grand Total ADEX Nett Estimation Q3 2014 Revenue (in IDR billion) 2014 Audience Market 2013 2014 Growth Share Share 799 897 12% 15% 23% 434 391 -10% 8% 10% 200 201 1% 6% 5% 1.433 1.489 4% 30% 39% 657 602 -8% 18% 16% 213 320 50% 12% 8% 870 922 6% 30% 24% 425 390 -8% 9% 10% 579 280 -52% 8% 7% 1.004 670 -33% 17% 17% 150 340 127% 13% 9% 154 225 46% 6% 6% 304 565 86% 18% 15% 135 175 29% 4% 5% 7 9 24% 2% 0% 142 184 2% 5% 5% 3.753 3.830 2% 100% 100% Source : AGB Nielsen Arianna / Annual Report IDX & Adex Nett Assumption Q3 2013-2014 (In Billion) Power Ratio 1,5 1,2 0,9 1,3 0,9 0,7 0,8 1,2 0,9 1,0 0,7 1,0 0,8 1,3 0,1 0,9 1,0 • Despite soft audience share MNC group still holds the largest advertising Market share at 39% with a 1.3 Power Ratio 29 Strong revenue growth with increasing EBITDA Margins Room For Further Margins Improvement 47.0% - 48.0% 41.7% ~42.0% 2013A 2014E 37.9% 33.2% 2011A Source : Company information 2012A 2017E 30 Thank You For further information, please contact Investor Relations Division: Teddy Pun – SVP, Head of Corporate Finance and Investor Relations [email protected] Investor Relations: Christy Kusuma Atmaja [email protected] Fauzia Prawiranata [email protected] James Prananto [email protected] PT Global Mediacom Tbk MNC Tower 21st Floor Jl Kebon Sirih No.17-19 Jakarta 10340, Indonesia Tel: 62-21 3922949 Fax: 62-21 3910454 Website: www.mncgroup.com


© Copyright 2026