
Satellite Orbit and Ephemeris Determination using Inter Satellite Links
Satellite Orbit and Ephemeris
Determination using
Inter Satellite Links
by
Robert Wolf
Vollständiger Abdruck der an der Fakultät für Bauingenieur- und Vermessungswesen der
Universität der Bundeswehr München zur Erlangung des akademischen Grades eines Doktors
der Ingenieurswissenschaften (Dr.-Ing.) eingereichten Dissertation. (© 2000)
Inter Satellite Links
Page ii
R. Wolf
Inter Satellite Links
Abstract
Global navigation satellite systems like GPS, GLONASS or the future systems like Galileo
require precise orbit and clock estimates in order to provide high positioning performance.
Within the frame of this Ph. D. thesis, the theory of orbit determination and orbit computation
is reviewed and a new approach for precise orbit and ephemeris determination using intersatellite links is developed. To investigate the achievable accuracy, models of the various
perturbing forces acting on a satellite have been elaborated and coded in a complex software
package, allowing system level performance analysis as well as detailed evaluation of orbit
prediction and orbit estimation algorithms. Several satellite constellations have been
simulated, involving nearly all classes of orbit altitude and the results are compared.
The purpose of orbit determination in a satellite navigation system is the derivation of
ephemeris parameters which can be broadcast to the user community (or the other satellites)
and allow easy computation of the satellites position at the desired epoch. The broadcast
ephemeris model of both today existing satellite navigation systems, GPS and GLONASS are
investigated, as well as two new models developed within this thesis, which are derivates of
the GLONASS model.
Furthermore, the topic of autonomous onboard processing is addressed. A conceptual design
for an onboard orbit estimator is proposed and investigated with respect to the computational
load. The algorithms have been implemented. The main benefits of ISL onboard processing,
especially with respect to the great potential to ephemeris and clock state monitoring are
investigated using complex simulations of failure scenarios. By simulating several types of
non-integrity cases, it is showed that one single fault detection mechanism is likely to be
insufficient. Within the algorithm design of the onboard processor, a reasonable combination
of fault detection mechanisms is presented, covering different fault cases.
Zusammenfassung
Globale Navigationssysteme wie GPS, GLONASS oder zukünftige Systeme wie Galileo
erfordern die hochpräzise Bestimmung der Orbital- und Uhrenparameter, um hohe
Navigationsgenauigkeit bieten zu können. Im Rahmen dieser Dissertation wurde die Theorie
der Orbitprädiktion und der Orbitbestimmung erörtert und ein neuer Ansatz für die präzisen
Orbitbestimmung mit Hilfe von Intersatelliten-Messungen entwickelt. Um die erreichbare
Genauigkeit und Präzision der Orbitbestimmung zu untersuchen, wurden mathematische
Modelle der zahlreiche Orbitstörungen erarbeitet und in einem komplexen Software-Paket
implemetiert. Dieses bietet die Möglichkeit für Systemstudien von SatellitennavigationsSystemen beliebiger Orbitklassen, sowie zur detaillierten Untersuchung spezieller
Fragestellungen der Orbitprädiktion und -bestimmung. Eine Reihe von Simulationen mit
existierenden sowie fiktiven Satelliten-Navigations-Systemen wurden durchgeführt, deren
Ergebnisse in dieser Arbeit präsentiert werden.
Die präzise Orbitbestimmung in einem SatNav-System ist kein Selbstzweck, sondern dient
lediglich der Bestimmung der Ephemeridenparameter, die - vom Satellite gesendet - es dem
Nutzer-Empfänger erlauben, mit Hilfe einfacher Berechnungen die Position des Satelliten zu
ermitteln. Die Ephemeridenformate beider existierender SatNav-Systeme - GPS und
R. Wolf
Page iii
Inter Satellite Links
GLONASS - wurden untersucht und mit zwei weiteren Formaten verglichen, die im Rahmen
dieser Arbeit entwickelt wurden.
Desweiteren wurde das Thema der bordautonomen Verarbeitung von Messungen behandelt.
Ein konzeptuelles Design für einen Onboard-Prozessor wurde vorgeschlagen und die
Algorithmen implementiert. Dabei erfolgte eine Abschätzung der benötigten
Prozessorleistung. Einer der Hauptvorteile der bordautonomen Verarbeitung von
Intersatellitenmessungen, die Möglichkeit zur Überwachung der Integrität der Ephemeriden
und Uhrenparameter, wurde in komplexen Simulationen untersucht. Durch die Simulation
verschiedener Fehlerfälle wurde gezeigt, das kein Detektionsmechanismus allein, wohl aber
eine
sinnvolle
Kombination
solcher
Mechanismen,
zur
bordautonomen
Integritätsüberwachung geeignet sind. Die Ergebissen werden hier präsentiert.
Page iv
R. Wolf
Inter Satellite Links
Table of Contents
1 INTRODUCTION............................................................................................................................ 1
2 ISL OBSERVATION MODEL....................................................................................................... 4
2.1
2.2
DERIVATION OF THE RANGE EQUATION .................................................................................. 4
DERIVATION OF THE RANGE RATE EQUATION ........................................................................ 5
3 STATE ESTIMATION.................................................................................................................... 7
3.1
3.2
3.3
3.4
3.4.1
3.4.2
3.5
3.5.1
3.5.2
3.5.3
LINEARIZATION OF DYNAMIC AND OBSERVATION MODEL .................................................... 7
STATE VECTOR ........................................................................................................................... 8
STATE TRANSITION AND TRANSITION MATRIX ..................................................................... 10
LEAST SQUARES BATCH ESTIMATION .................................................................................... 13
WEIGHTED LEAST SQUARES ............................................................................................... 14
INTRODUCING APRIORI STATISTIC INFORMATION ............................................................... 15
KALMAN FILTERING ................................................................................................................ 15
REAL TIME ESTIMATION ..................................................................................................... 15
FILTERING TO EPOCH........................................................................................................... 16
FILTER STRUCTURES ........................................................................................................... 17
4 ORBIT COMPUTATION ............................................................................................................. 19
4.1
ANALYTICAL SOLUTION .......................................................................................................... 19
4.1.1
KEPLER ORBITS ................................................................................................................... 20
4.1.2
ACCOUNTING FOR SECULAR PERTURBATIONS .................................................................... 22
4.2
NUMERICAL INTEGRATION OF THE EQUATIONS OF MOTION ............................................... 23
4.2.1
EARTH’S GRAVITY .............................................................................................................. 26
4.2.1.1
Computation of Legendre Polynomials and Functions................................................. 27
4.2.1.2
Normalisation................................................................................................................ 28
4.2.1.3
Computation of Gravity ................................................................................................ 29
4.2.2
THIRD BODY ATTRACTION .................................................................................................. 32
4.2.3
SOLAR PRESSURE ................................................................................................................ 32
4.2.4
AIR DRAG ............................................................................................................................ 33
4.2.5
SOLID EARTH TIDES ............................................................................................................ 35
4.2.6
OCEAN TIDES....................................................................................................................... 36
4.2.7
EARTH ALBEDO ................................................................................................................... 37
4.2.8
VEHICLE THRUST ................................................................................................................ 37
4.3
FORCE MODEL ERRORS ........................................................................................................... 39
4.3.1
EARTH'S GRAVITY ............................................................................................................... 39
4.3.2
THIRD BODY ATTRACTION (DIRECT TIDAL EFFECTS) ........................................................ 47
4.3.3
SOLAR RADIATION PRESSURE ............................................................................................. 50
4.3.4
AIR DRAG ............................................................................................................................ 52
4.3.5
OTHER PERTURBATIONS ...................................................................................................... 55
4.3.6
NUMERICAL ERRORS ........................................................................................................... 58
R. Wolf
Page i
Inter Satellite Links
4.4
PRECISE SHORT TERM ORBIT REPRESENTATION ..................................................................61
4.4.1
GLONASS BROADCAST EPHEMERIS ..................................................................................63
4.4.1.1
Extended GLONASS Format........................................................................................64
4.4.2
GPS BROADCAST EPHEMERIS .............................................................................................64
4.4.3
WAAS GEO BROADCAST EPHEMERIS................................................................................67
4.4.4
INTELSAT EPHEMERIS FORMAT ........................................................................................68
5 SOFTWARE DESCRIPTION ......................................................................................................70
5.1
5.2
5.3
5.3.1
5.3.2
5.3.3
5.3.4
5.4
5.4.1
5.4.2
5.4.3
5.4.4
5.5
5.5.1
5.5.2
5.6
ORBIT INTEGRATION ................................................................................................................72
REAL TIME STATE ESTIMATION ..............................................................................................74
MEASUREMENT SIMULATION ..................................................................................................75
THERMAL NOISE ..................................................................................................................76
IONOSPHERIC MODEL ..........................................................................................................81
TROPOSPHERIC MODEL........................................................................................................83
MULTIPATH SIMULATION ....................................................................................................83
CO-ORDINATE TRANSFORMATION ..........................................................................................84
PRECESSION .........................................................................................................................84
NUTATION ............................................................................................................................85
POLAR MOTION....................................................................................................................85
EARTH ROTATION (HOUR ANGLE) ......................................................................................85
BROADCAST EPHEMERIS ..........................................................................................................87
ADJUSTMENT OF THE BROADCAST MESSAGE .....................................................................87
EPHEMERIS CONTRIBUTION TO URE ...................................................................................88
AUTONOMOUS INTEGRITY MONITORING ...............................................................................89
6 SIMULATION AND RESULTS ...................................................................................................92
6.1
CONSTELLATIONS, GROUND NETWORKS AND SIMULATION SCENARIOS ............................92
6.1.1
CONSTELLATIONS ................................................................................................................92
6.1.1.1
Optimized GPS Constellation .......................................................................................93
6.1.1.2
IGSO Walker Constellation...........................................................................................95
6.1.1.3
IGSO on three Loops.....................................................................................................97
6.1.1.4
GEO / IGSO ..................................................................................................................98
6.1.1.5
Pure LEO Constellation...............................................................................................100
6.1.1.6
GEO / LEO..................................................................................................................101
6.1.1.7
Galileo 1 (Pure MEO) .................................................................................................103
6.1.1.8
Galileo 2 (GEO/MEO) ................................................................................................104
6.1.2
NETWORKS.........................................................................................................................106
6.1.2.1
GPS OCS.....................................................................................................................106
6.1.2.2
DORIS Network..........................................................................................................106
6.1.2.3
Proposed Galileo Network ..........................................................................................108
6.1.2.4
Custom Global Network..............................................................................................109
6.1.2.5
Custom Regional Network ..........................................................................................109
6.1.3
SIMULATION SCENARIOS ...................................................................................................110
6.2
ORBIT DETERMINATION ACCURACY ....................................................................................111
6.2.1
OPTIMIZED GPS CONSTELLATION .....................................................................................112
6.2.1.1
Ground Tracking (OCS)..............................................................................................112
6.2.1.2
Ground Tracking with Augmented Network...............................................................113
Page ii
R. Wolf
Inter Satellite Links
6.2.2
IGSO WALKER CONSTELLATION ...................................................................................... 114
6.2.2.1
Ground Tracking......................................................................................................... 114
6.2.2.2
Ground and Inter Satellite Tracking............................................................................ 115
6.2.2.3
Ground and Inter Satellite Tracking with Reduced Network...................................... 115
6.2.3
IGSO ON THREE LOOPS ..................................................................................................... 117
6.2.3.1
Ground Tracking......................................................................................................... 117
6.2.3.2
Ground and Intersatellite Tracking ............................................................................. 118
6.2.4
GEO / IGSO ...................................................................................................................... 119
6.2.4.1
Ground Tracking......................................................................................................... 119
6.2.4.2
Ground and Intersatellite Tracking ............................................................................. 121
6.2.4.3
Ground and Intersatellite Tracking (Regional Network) ............................................ 123
6.2.5
PURE LEO CONSTELLATION ............................................................................................. 125
6.2.5.1
Ground Tracking with Full Network........................................................................... 125
6.2.5.2
Ground Tracking with Reduced Network ................................................................... 126
6.2.5.3
Ground and Intersatellite Tracking (Reduced Network)............................................. 127
6.2.6
GEO / LEO........................................................................................................................ 128
6.2.6.1
Ground Tracking (Full Network) ................................................................................ 128
6.2.6.2
Ground Tracking (Reduced Network) ........................................................................ 128
6.2.6.3
Ground and Intersatellite Tracking (Reduced Network)............................................. 128
6.2.7
GALILEO 1 (PURE MEO) ................................................................................................... 130
6.2.7.1
Ground Tracking......................................................................................................... 130
6.2.7.2
Ground and Intersatellite Tracking ............................................................................. 131
6.2.8
GALILEO 2 (GEO/MEO).................................................................................................... 132
6.2.8.1
Ground Tracking......................................................................................................... 132
6.2.8.2
Ground and Intersatellite Tracking (Full Network) .................................................... 134
6.3
ACCURACY OF BROADCAST EPHEMERIS (USER EPHEMERIS) ............................................ 136
6.3.1
MODEL FITTING ERROR ..................................................................................................... 136
6.3.2
ORBIT DETERMINATION AND PROPAGATION ERROR ........................................................ 138
6.3.3
EPHEMERIS ACCURACY OF SCENARIOS ............................................................................ 148
6.3.3.1
Optimized GPS ........................................................................................................... 149
6.3.3.2
IGSO Walker Constellation ........................................................................................ 149
6.3.3.3
IGSO on Three Loops ................................................................................................. 149
6.3.3.4
GEO / IGSO Constellation.......................................................................................... 149
6.3.3.5
Pure LEO Walker Constellation.................................................................................. 150
6.3.3.6
GEO / LEO Constellation ........................................................................................... 150
6.3.3.7
Galileo Option 1 (Pure MEO) ..................................................................................... 150
6.3.3.8
Galileo Option 2 (GEO / MEO) .................................................................................. 151
7 AUTONOMOUS ONBOARD PROCESSING.......................................................................... 152
7.1
7.2
7.2.1
7.2.2
7.3
7.3.1
7.3.2
7.4
7.4.1
7.4.2
WHY ONBOARD PROCESSING?.............................................................................................. 152
IMPLEMENTATION ASPECTS OF ONBOARD PROCESSING .................................................... 154
COMPLEXITY OF ORBIT PREDICTION AND ESTIMATION ALGORITHMS ............................. 155
ONBOARD PROCESSING USING ISLS .................................................................................. 156
APPLICATION EXAMPLE: AVAILABILITY DURING ORBIT MANOEUVRES .......................... 158
CONTINUED SERVICE DURING MANOEUVRES ................................................................... 160
FREQUENTLY UPDATED EPHEMERIS CORRECTIONS ......................................................... 163
APPLICATION EXAMPLE: AUTONOMOUS ONBOARD INTEGRITY MONITORING................ 163
USER POSITION ERROR DUE TO NORMAL ORBIT AND CLOCK DEGRADATION ................. 168
USER POSITION DEGRADATION DUE TO UNFORESEEN ORBIT MANOEUVRE .................... 172
R. Wolf
Page iii
Inter Satellite Links
7.4.3
7.4.3.1
7.4.3.2
7.4.3.3
7.4.3.4
USER POSITION ERROR WITH ONBOARD INTEGRITY MONITORING ..................................174
Strong Orbit Manoeuvre..............................................................................................174
Weak Orbit Manoeuvre ...............................................................................................178
Clock Drift...................................................................................................................182
Clock Jump..................................................................................................................185
8 CONCLUSION.............................................................................................................................189
8.1
8.2
8.3
RESULTS AND FURTHER CONSIDERATIONS ..........................................................................189
RECOMMENDATIONS FOR GALILEO ......................................................................................190
ACHIEVEMENTS ......................................................................................................................191
9 REFERENCES .............................................................................................................................193
Page iv
R. Wolf
Inter Satellite Links
List of Figures
Figure 1-1Principle of Inter Satellite Measurements ..................................................................1
Figure 1-2 ISL Tracking Geometry for a GEO Satellite.............................................................2
Figure 1-3 Tracking Geometry for LEO Satellite.......................................................................3
Figure 4-1 Prediction Error of LEO 1250 km with 15 x 15 Geopotential................................40
Figure 4-2 Orbit Error of MEO with 5 x 5 gravity model after 1 day ......................................43
Figure 4-3 Orbit Error of LEO 1250 km neglecting Lunar Attraction .....................................47
Figure 4-4 Orbit Error of MEO neglecting Lunar Attraction ...................................................48
Figure 4-5 Orbit Error of 1250km LEO neglecting Solar Radiation Pressure .........................50
Figure 4-6 4-7Orbit Error of MEO neglecting Solar Radiation Pressure .................................51
Figure 4-8 Orbit Error of 800 km LEO neglecting Air Drag....................................................53
Figure 4-9 Radial / Cross Track Error of 800 km LEO neglecting Air Drag ...........................54
Figure 4-10 Orbit Error of 800 km LEO neglecting Solid Earth Tides ....................................55
Figure 4-11 Orbit Error of MEO neglecting Solid Earth Tides ................................................56
Figure 4-12 Prediction Error of IGSO neglecting Major Planets Attraction ............................57
Figure 4-13 Integration Step Width vs. Orbit Altitude.............................................................59
Figure 4-14 Number of Function Evaluations vs. Orbit Altitude .............................................60
Figure 4-15 Absolute Error vs. Orbit Altitude..........................................................................61
Figure 5-1 Orbit Integration Process ......................................................................................73
Figure 5-2 State Estimation Process .......................................................................................74
Figure 5-3 Code Noise vs. Range .............................................................................................78
Figure 5-4 Carrier Noise vs. Range ..........................................................................................79
Figure 5-5 Range Rate Noise vs. Distance ...............................................................................81
Figure 5-6 Chapman Profile of the Ionosphere ......................................................................82
Figure 5-7 Broadcast Message Adjustment ............................................................................87
Figure 5-8 Integrity Processing Check ..................................................................................89
Figure 6-1 Ground Tracks of Optimized GPS constellation.....................................................93
Figure 6-2 Visibility of Optimized GPS Constellation over 24 h.............................................94
Figure 6-3 Ground Tracks of IGSO Walker Constellation......................................................95
Figure 6-4 Visibility of IGSO Walker Constellation................................................................96
Figure 6-5 Ground Tracks of IGSO Constellation "on three Loops" .......................................97
Figure 6-6 Visibility of IGSO Constellation "on three Loops" ................................................98
R. Wolf
Page v
Inter Satellite Links
Figure 6-7 Ground Tracks of GEO - IGSO Constellation........................................................ 99
Figure 6-8 Visibility of GEO – IGSO Constellation................................................................ 99
Figure 6-9 Ground Tracks of LEO Constellation................................................................... 100
Figure 6-10 Visibility of LEO Constellation.......................................................................... 101
Figure 6-11 Ground Tracks of LEO Constellation................................................................. 102
Figure 6-12 Visibility of LEO – GEO Constellation ............................................................. 102
Figure 6-13 Ground Tracks of Galileo Option 1 Constellation.............................................. 103
Figure 6-14 Visibility of Galileo Option 1 Constellation ...................................................... 104
Figure 6-15 Ground Tracks of Galileo Option 2 Constellation.............................................. 105
Figure 6-16 Visibility of Galileo Option 2 Constellation ...................................................... 105
Figure 6-17 Tracking Accuracy with GPS OCS .................................................................... 112
Figure 6-18 Tracking Accuracy with proposed Galileo Ground Network............................. 113
Figure 6-19 Tracking Accuracy with Custom Global Net ..................................................... 114
Figure 6-20 Tracking Accuracy with Custom Global Net using additional ISL's ................. 115
Figure 6-21 Tracking Accuracy of S/C using ISL's, but not visible to Ground Network
(Custom Regional Network) .......................................................................................... 116
Figure 6-22 Tracking Accuracy of IGSO on a Loop with Custom Global Network ............. 117
Figure 6-23 Tracking Accuracy of IGSO on a Loop with Custom Global Network using
additional ISL's............................................................................................................... 118
Figure 6-24 Tracking Accuracy of GEO using Ground Links only....................................... 119
Figure 6-25 Tracking Accuracy of IGSO using Ground Links only...................................... 120
Figure 6-26 Tracking Accuracy of IGSO with ISL's ............................................................. 121
Figure 6-27 Tracking Accuracy of GEO with ISL's .............................................................. 122
Figure 6-28 Tracking Accuracy of IGSO with rare Ground Contact using ISL's.................. 123
Figure 6-29 Tracking Accuracy of GEO without Ground Contact, only via ISL's................ 124
Figure 6-30 Tracking Accuracy of LEO using DORIS Network only................................... 125
Figure 6-31 Tracking Accuracy of a LEO using Galileo Network ........................................ 126
Figure 6-32 Tracking Accuracy of LEO using Ground and Intersatellite Tracking .............. 127
Figure 6-33 Tracking Accuracy of LEO using Ground and LEO-GEO-ISL's....................... 129
Figure 6-34 Tracking Accuracy of MEO using Galileo Network.......................................... 130
Figure 6-35 Tracking Accuracy of MEO all available ISL's ................................................. 131
Figure 6-36 Tracking Accuracy of MEO using Galileo Network.......................................... 132
Figure 6-37 Tracking Accuracy of GEO using Galileo Network .......................................... 133
Page vi
R. Wolf
Inter Satellite Links
Figure 6-38 Tracking Accuracy of MEO using ISL's.............................................................134
Figure 6-39 Tracking Accuracy of GEO using ISL's .............................................................135
Figure 6-40 Propagation Error MEO raw estimate ground only 12 states 1 hour .................139
Figure 6-41 Ageing of Ephemeris MEO, raw estimate ground only 12 states 1 hour............140
Figure 6-42 MEO propagation error with 6 hour smoothing..................................................141
Figure 6-43 Ageing of MEO Ephemeris with 6 hours smoothing..........................................142
Figure 6-44 MEO Propagation Error with 12 hours of smoothing.........................................143
Figure 6-45 URE with 12 hours smoothing............................................................................144
Figure 6-46 MEO Propagation Error without smoothing derived from Raw Estimate using
ISL's ................................................................................................................................145
Figure 6-47 URE without smoothing using ISL's...................................................................146
Figure 6-48 MEO Propagation Error with 12 hours smoothing using ISL's ..........................147
Figure 6-49 URE with 12 hours smoothing using ISL's.........................................................148
Figure 7-1 Block Diagram of Orbit Determination .............................................................155
Figure 7-2 Process Flow of the Onboard Integrity Monitor ...................................................167
Figure 7-3 Orbit and Clock Degradation of SV 26.................................................................168
Figure 7-4 Orbit and Clock Degradation of SV 15.................................................................169
Figure 7-5 Orbit and Clock Degradation of SV 10.................................................................170
Figure 7-6 User Position Error over Time ..............................................................................171
Figure 7-7 User Horizontal Position Error .............................................................................171
Figure 7-8 SV 26 Orbit Error due to 2N Thrust / 0.1 m/s Delta V .........................................172
Figure 7-9 User Position Error in Horizontal Plane ...............................................................173
Figure 7-10 User Position Error over Time ............................................................................173
Figure 7-11 Trigger Values for Fault Detector .......................................................................174
Figure 7-12 Absolute Orbit Error of SV 26 ............................................................................175
Figure 7-13 Estimated vs. True Error for SV 26 ....................................................................175
Figure 7-14 User Error during Manoeuvre .............................................................................178
Figure 7-15 Absolute Error SV 26..........................................................................................179
Figure 7-16 Estimated vs True Error SV 26 ...........................................................................179
Figure 7-17 User Position Error during Manoeuvre ...............................................................181
Figure 7-18 Absolute Clock Error SV 04 ...............................................................................182
Figure 7-19 Estimated vs True Error SV 04 ...........................................................................182
Figure 7-20 Absolute Error SV 04..........................................................................................185
R. Wolf
Page vii
Inter Satellite Links
Figure 7-21 Estimated minus True Error ............................................................................... 185
Figure 7-22 User Error over Time (Spike of Altitude Error at T = 12:02:30) ....................... 188
Page viii
R. Wolf
Inter Satellite Links
List of Tables
Table 4-1 Coefficients of the Adams-Bashford Algorithm ......................................................25
Table 4-2 Coefficients of the Adams-Moulton Algorithm .......................................................25
Table 4-3 Atmospheric Density and Scale Height .................................................................35
Table 4-4 Assessed Gravity Models .........................................................................................39
Table 4-5 1250 km LEO 1 day ...............................................................................................41
Table 4-6 1250 km LEO 6 hours ..............................................................................................42
Table 4-7 20200 km MEO 1 day .............................................................................................44
Table 4-8 20200 km MEO 6 hours ..........................................................................................44
Table 4-9 GEO 1 day ...............................................................................................................45
Table 4-10 GEO 6 hours ..........................................................................................................46
Table 4-11 Lunar Tide Perturbation .........................................................................................49
Table 4-12 Solar Tide Perturbation...........................................................................................49
Table 4-13 Solar Radiation Perturbation ..................................................................................52
Table 4-14 Air Drag Perturbation after 1 Day..........................................................................52
Table 4-15 Air Drag Perturbation after 6 Hours.......................................................................53
Table 4-16 Solid Earth Tide Perturbation after 1 day...............................................................56
Table 4-17 Attraction from Major planets Perturbation after 1 Week......................................58
Table 5-1 Main Software Features............................................................................................71
Table 6-1 Optimized GPS Constellation ..................................................................................94
Table 6-2 Fitting error.............................................................................................................137
Table 7-1 Estimated Algorithmic Complexity of Orbit Estimation Process (AUNAP 1996)155
Table 7-2 Characteristics of Hughes XIPS Ion Drives ........................................................159
Table 7-3 Thrust Phase Navigation Message Extension......................................................160
Table 7-4 Simulation Parameters .........................................................................................161
Table 7-5 Ephemeris Error during an Orbit Manoeuvre ........................................................162
R. Wolf
Page ix
Inter Satellite Links
List of Acronyms
ABM
Adams-Bashford-Moulton
AUNAP
Autonavigationsprozessor
CAT I/II/II
Category (Precision Landings)
CDMA
Code Division Multiple Access
CPU
Central Processing Unit
DE200
Precise Planetary Ephemeris from Jet Propulsion Laboratory
DIODE
Détermination Immédiate d'Orbite par Doris Embarqué (Onboard NavProcessor using Doris)
DLL
Delay Lock Loop
DOF
Degrees of Freedom
DORIS
Doppler Orbitography and Radiopositioning Integrated by Satellite
ECEF
Earth-Centred-Earth-Fixed (Reference Frame)
ECI-J2000
Earth Centred Inertial Reference Frame
EGM-96
Earth Gravity Model of 1996
EGNOS
European Geostationary Overlay System
ESA
Europen Space Agency
FD
Failure Detection (Algorithm)
FDI
Failure Detection and Isolation (Algorithm)
FDMA
Frequency Division Multiple Access
Galileo
Name of European Satellite Navigation System
GEM-T1/2/3
Goddard Earth Model
GEO
Geostationary Earth Orbit
GLONASS
Global Navigation Satellite System (Russia)
GNSS
Global Navigation Satellite System
GO
Integrity Flag State (= Healthy)
GPS
Global Positioning Service (also called Navstar GPS) (USA)
GRIM4-S4
Gravity Model from (Geoforschungzentrum Potsdam) based on Satellite
Measurements only
ID
Identification (Number)
IERS
International Earth Rotation Service
IGSO
Inclicned Geosynchronous Orbit
ISL
Intersatellite Link
Page x
R. Wolf
Inter Satellite Links
J2
Earths Oblateness Coefficient
JGM-2/3
Joint Gravity Model (Type 2 or 3)
JPL
Jet Propulsion Laboratory
LEO
Low Earth Orbit
LOS
Line of Sight
MEO
Medium Earth Orbit
MMH
Monometyl-Hydrazin
MOPS
Minimum Operational Performance Standards
MSAS
MSAT Space Augmentation System
NO GO
Integrity Flag State (= Unhealthy)
NTO
Nitro-Tetroxide
OCS
Operational Control System
PLL
Phase Lock Loop
PR
Pseudo Range
PRARE
Precise Range and Range-Rate Equipment
RAIM
Receiver Autonomous Integrity Monitoring
RK
Runge-Kutta
RMS
Root Mean Square
S/C
Spacecraft
S/V
Space Vehicle
SBAS
Space Based Augmentation System
SDMA
Space Division Multiple Access
TDMA
Time Division Multiple Access
TEC
Total Elctron Content (of the Ionosphere)
URE
User Range Error
UT
Universal Time
UT1
Universal Time 1(Siderial Time)
UTC
Universal Time Coordinated
WAAS
Wide Area Augmentation System
WGS-84
World Geodetic System of 1984
XIPS
Xenon Ion Propulsion System
R. Wolf
Page xi
Inter Satellite Links
Page xii
R. Wolf
Inter Satellite Links
Introduction
1 INTRODUCTION
The conventional way of precise orbit determination is to take pseudorange, Doppler or angle
measurements of a satellite with respect to a fixed point on the ground, and apply differential
corrections to a (more or less accurate) predicted reference orbit.
A radio signal travelling from one satellite to another can also be used to derive the distance
between these two space crafts. Although the distance is not measured between a satellite and
a known point– like a ground station – but between two satellites, these measurements can be
used to derive the satellite’s state vectors, i.e. their position and velocity at a given time.
Although these measurements can not be used solely, i.e. with out any ground reference, they
provide additional information. The following picture shows two satellites, which are
conducting inter satellite measurements. At the same time, ranging stations on the ground take
measurements from both satellites.
Figure 1-1Principle of Inter Satellite Measurements
The ISL (inter satellite links) provides an observation with a geometry completely different
from those of the ground referenced links, as can be seen from the figure. This is an a
advantage especially for satellites at higher orbits. From a satellite in geostationary orbit, the
earth is seen under a small angle of approximately 17°, which implies also the limit for the
R. Wolf
Page 1
Introduction
Inter Satellite Links
maximum possible separation angle between two ground referenced observations. This leads
to a significant larger uncertainty in the off-radial components of the orbit, than in the radial
component. In the following figure the distances between satellites and earth, as well as the
earth’s diameter are approximately drawn to scale.
GEO
GEO
Figure 1-2 ISL Tracking Geometry for a GEO Satellite
An ISL to another GEO satellite results in a much better observability of the tangential orbit
errors. As a result, the decorrelation of the clock error and the radial orbit error is enhanced
and shortened. Another benefit from ISL’s is the improvement in satellite tracking capability
for satellites at low earth orbit (LEO). Usually a large scale ground network is required to
provide reasonable coverage of the complete LEO satellite orbit. The ground network of the
DORIS system, for instance, consist of 51 ground beacons distributed over the entire world. If
for example a GEO would be used to establish an ISL, the LEO satellite would remain in
view to that satellite for more than one third of its orbit. The next figure indicates the tracking
geometry for a LEO / GEO inter satellite link.
Page 2
R. Wolf
Inter Satellite Links
Introduction
GEO
LEO
Figure 1-3 Tracking Geometry for LEO Satellite
On the other hand, its also clear that an ISL payload increases the complexity of the space
craft (mass, power consumption) and therefore its cost. There is a trade off between the
benefits with respect to accuracy / observability and overall system complexity, which has to
be done.
This text deals with the mathematical methods to account for ISL’s in the state estimation
process. The majority of the equations and algorithms given in the next chapters have been
implemented in a software package, thus also results from simulation runs will be given. At
the end in this text, the topic of autonomous (onboard) state estimation will be investigated,
which seems to be a perfect match for inter satellite links, at least on the first glance. The
closing chapters contain recommendation concerning the possibilities of ISL’s in the context
of a future GNSS 2 as well as a conclusion.
R. Wolf
Page 3
ISL Observation Model
Inter Satellite Links
2 ISL OBSERVATION MODEL
The majority of the observation used in the orbit determination of satellites orbiting the earth,
are radio frequency (pseudo-) range and Doppler measurements. Angle measurements, i.e.
azimuth and elevation provide insufficient accuracy for precise orbit determination. Laser
ranging measurements, which are the most precise measurements available today, are strongly
subjected to weather conditions. Thus, they are used mainly for calibration purposes. The
observations considered in this text, are therefore only one and two-way range and range rate
(Doppler) measurement.
2.1 Derivation of the Range Equation
The pseudo range between two points is the difference between two clock readings, the clock
at the sender and the clock at the receiver. If the clocks are coarsely synchronized, the largest
part of the measured clock difference will be due to the signal travelling at the speed of light,
thus representing the geometric distance.
L = (TSat − TGround / Sat 2 ) ⋅ c =
Eq. 2.1-1
= ρ Geometric + c ⋅ (δTSat − δTGround / Sat 2 ) + δ iono + δ Tropo + δ Multipath + ε noise
with
L
Pseudo range
c Speed of light
δTSat Deviation of satellite clock from system time
δTGround
Deviation of ground receiver clock from system time
δIono Ionospheric delay
δTropo Troposheric delay
δMultipath
Multipath error
εnoise Thermal noise
and
ρ Geometric =
( x1 − x2 )2 + ( y1 − y 2 )2 + ( z1 − z 2 )2
Eq. 2.1-2
being the geometric distance between the two points.
To obtain a linear measurement equation, the partials with respect to the unknown parameters
have to be formed. Assuming that all other error contributions except the satellite clock can be
measured or modelled, and therefore removed, we can write the linearized observation
equation as a function of the three position errors and the satellite clock error. Remaining
errors e.g. due to mismodelling are added to the measurement noise.
Page 4
R. Wolf
Inter Satellite Links
ISL Observation Model
For a ground measurement, only the partials with respect to the satellites states are formed.
The position of the ground station is assumed to be exact. The range equation for example
would yield
L − L0 =
x Sat − xGS
y − yGS
z − z GS
⋅ ∆x + Sat
⋅ ∆y + Sat
⋅ ∆z + c ⋅ δTSat
L0
L0
L0
Eq. 2.1-3
with
L0 Predicted pseudo range computed from nominal trajectory
For inter satellite links, the partial of the range equation with respect to both satellites states
would have to be formed. Above equation would transform to
L − L0 =
=
−
x Sat ,1 − x Sat , 2
L0
x Sat ,1 − x Sat , 2
L0
Eq. 2.1-4
⋅ ∆x1 +
⋅ ∆x 2 −
y Sat ,1 − y Sat , 2
L0
y Sat ,1 − y Sat , 2
L0
⋅ ∆y1 +
⋅ ∆y 2 −
z Sat ,1 − z Sat , 2
L0
z Sat ,1 − z Sat , 2
L0
⋅ ∆z1 + c ⋅ δTSat1
⋅ ∆z 2 − c ⋅ δTSat 2
As can be seen from the equation above, an ISL observation impacts the state variables of
both, the measuring and the target satellite.
2.2 Derivation of the Range Rate Equation
A radio signal being emitted from a moving sender is subjected to shift in the received
frequency, called the Doppler shift. This frequency shift is proportional to the velocity along
the line of sight.
f Re ceive
LD
LD
= 1 − or ∆f = f Transmit ⋅
f Transmit
c
c
Eq. 2.2-1
Normally, the frequency shift can not be directly measured, but has to be derived from the
phase rate, (or the so called integrated Doppler count) instead. In the context of orbit
determination, we are not interested in the frequency shift itself, but in the range rate which
caused the shift. Fortunately, the phase rate can be directly scaled to a delta-range by
multiplying with the carrier wave length. A division through the integration time yields the
range rate, the value we are interested in. A drawback of a range rate derived from integrated
Doppler counts is that it is an averaged instead of an instantaneous value. But for short
integration times, this fact can be neglected.
From geometric considerations, or by forming the derivative of the range equation with
respect to time, we obtain the measurement equation for a range rate observable.
R. Wolf
Page 5
ISL Observation Model
Inter Satellite Links
The range rate, i.e. the velocity along the line of sight vector between two points can be
written as:
x − x2
y − y2
z −z
LD = 1
⋅ ( xD 1 − xD 2 ) + 1
⋅ ( yD 1 − yD 2 ) + 1 2 ⋅ (zD 1 − zD 2 )
L
L
L
Eq. 2.2-2
with point index 1 being the (first) satellite and point two being either a known location on the
earth’s surface or a second satellite.
Forming the partials with respect to the satellites state yields
∂LD x1 − x 2
=
∂xD
L
D
∂L xD1 − xD 2 LD ⋅ ( x1 − x 2 )
=
−
=0
∂x
L
L2
Eq. 2.2-3
The partial with respect to the position and velocity in y- and z-direction can be obtained in a
similar manner. From the two equations above it can be see that the range rate equation is
already linear. We can therefore write the linear measurement equation for a range rate
observable in the case of an inter satellite link as
L − L0 =
=
−
x Sat ,1 − x Sat , 2
L0
x Sat ,1 − x Sat , 2
L0
Eq. 2.2-4
⋅ ∆x1 +
⋅ ∆x 2 −
y Sat ,1 − y Sat , 2
L0
y Sat ,1 − y Sat , 2
L0
⋅ ∆y1 +
⋅ ∆y 2 −
z Sat ,1 − z Sat , 2
L0
z Sat ,1 − z Sat , 2
L0
⋅ ∆z1
⋅ ∆z 2
Note that the range rate measurement is independent of the clock state of the satellite.
Page 6
R. Wolf
Inter Satellite Links
State Estimation
3 STATE ESTIMATION
Generally spoken, the satellites orbit is determined by presuming an approximate trajectory
and determining and applying differential corrections to that a-priori orbit. Basically, there are
two concepts of ephemeris determination using differential corrections
• estimating the real time state using a Kalman filter
• estimating the initial conditions, i.e. position and velocity together with model parameters
using a batch estimator. This can be done using the classical least squares adjustment or
via Kalman filter.
The a-priori orbit, used for state prediction and linearization, can be generated using a
geometric or dynamic model. The estimated orbit corrections can be fed back into the orbit
propagator to obtain a better a priori orbit for successive epochs.
3.1 Linearization of Dynamic and Observation Model
Regardless of the estimator type, the observation equation as well as the dynamic equation
have to be linear. The differential equations for the state dynamic have to be of the form
xD = F ⋅ x + n
Eq. 3.1-1
The systems state is observed by means of some measurements z, which are related to the
systems state by the measurement matrix H, a system of linear observation equations
z = H⋅x + n
Eq. 3.1-2
where
n
white noise
Unfortunately orbit propagation is a highly non-linear problem and the derivative of the
systems state with respect to time is a system of non-linear functions of the systems state and
of time.
Eq. 3.1-3
dx
= f ( x ( t ), t ) + n
dt
Measuring a slant range or a slant range rate also yields non-linear observation equations
represented by
z = h (x ( t ) ) + n
Eq. 3.1-4
A solution is obtained by linearization of the dynamic functions and observation equations
around a approximate system state, i.e. a precomputed trajectory.
( )
∂f
f (x (t )) = f xˆ (t ) + ∂x
x = xˆ
(x − xˆ )+ ...
Eq. 3.1-5
with
R. Wolf
Page 7
State Estimation
∂f
F= ∂x
Inter Satellite Links
Dynamic matrix of the residual or error state
x = xˆ
and
( )
∂h
h(x (t )) = h xˆ (t ) + ∂x
x = xˆ
(x − xˆ )+ ...
Eq. 3.1-6
with
∂h
H= ∂x
Measurement matrix of the residual or error state
x = xˆ
The error state is the difference between thr real and the nominal system state
∆x k = x k
− xk
real
no min al
Eq. 3.1-7
where the nominal state is obtained by integrating the nonlinear equations, i.e. numerically
integrating the equations of motion.
xk
no min al
=
tk
∫ f (x (t ), t )dt
Eq. 3.1-8
t k −1
In a similar manner, the residual observations can be derived
∆z k = z k
real
− zk
zk
= h( x ( t ) no min al , t )
no min al
Eq. 3.1-9
with
no min al
Eq. 3.1-10
3.2 State Vector
The state vector at least contains the position errors, i.e. the difference between nominal and
real position. If the clock offset can not be measured directly e.g. by two way measurements,
it has to be estimated together with the orbit errors. This implies that for each epoch at least
four measurement are available to estimate the instantaneous position. However, in orbit
determination there are frequently less observations than states per measurement epoch. For
example, a GPS satellite is (nearly) never tracked by more than two ground stations
simultaneously. To allow the accumulation of measurements over a longer orbit arc, the
velocity errors have to be estimated as well.
Thus, the minimum state vector consists of the following elements
Page 8
R. Wolf
Inter Satellite Links
∆x
∆y
∆z
X = ∆x
∆y
∆z
δT
State Estimation
Eq. 3.2-1
This state vector is normally sufficient for real time estimation, where the orbit integration
time is relatively short. If a batch estimator is used, other states like dynamic model parameter
errors and observation biases can be (and have to be!) included because integration times are
typically several hours, up to days. The main accuracy driver of the orbit determination via
batch estimation process is the prediction accuracy, because the state vector is estimate only at
a certain epoch as a initial condition. Thus, if there is a weakness or imperfection in the
physical modelling of the acting forces, the orbit determination accuracy will degrade with
increasing integration time. The augmented state vector could therefore look like
∆x
∆y
∆z
∆xC
∆yC
X=
∆zC
δT
δρ
δP
S
etc.
Eq. 3.2-2
These force model imperfections may be for instance an inaccurate knowledge of the air
density or the solar radiation flux. The estimator has to solve for these parameters additional
to the satellites states. Thus, the solve-for parameter vector of a batch estimator normally has
to be significantly larger than the state vector of a real time estimator.
If inter satellite links have to be considered, the state vector has to consist of the complete
state vectors of all involved satellites.
R. Wolf
Page 9
State Estimation
Inter Satellite Links
X1
X 2
X =
...
X n
Eq. 3.2-3
With at least 7 states, which have to be considered per satellite, it can easily be seen that the
state of a complete constellation gets very large. This leads for instance to a state vector
magnitude of 126 states for a constellation of 18 space vehicles. Although many small filters
(one per each satellite) would result in a smaller computational burden, it is absolutely
necessary to process all satellites in one large filter, because the state estimates of the
satellites get correlated due to the inter satellite links.
3.3 State Transition and Transition Matrix
The system of linear differential equations
xD = F ⋅ x
Eq. 3.3-1
is not very well suited for the implementation of a discrete estimation process in a digital
computer. The discrete formulation of the Kalman filter for example requires the state
transient to be expressed by a simple vector-matrix-operation
x k = Φ(t k , t k −1 ) ⋅ x k −1
Eq. 3.3-2
with Φ(tk,tk-1) being the transition matrix from the epoch tk-1 to the epoch tk. In a more general
way, Eq. 3.3-2 can be expressed as
∂x k x k = ⋅ x k −1
∂x k −1
Eq. 3.3-3
with the transition matrix Φ(tk,tk-1) being interpreted as the Jacobian
∂x k
∂x k −1
Page 10
∂x k
∂x
k −1
∂y k
= ∂x k −1
∂z k
∂x k −1
...
∂x k
∂y k −1
∂x k
∂z k −1
∂y k
∂y k −1
∂y k
∂z k −1
∂z k
∂y k −1
∂z k
∂z k −1
...
...
...
...
...
...
Eq. 3.3-4
R. Wolf
Inter Satellite Links
State Estimation
The transition matrix is needed not only for the state transition and covariance propagation in
the Kalman filter, but also for mapping observations from an arbitrary time to the initial epoch
in a batch estimation process.
There are several ways to derive the transition matrix Φ(tk,tk-1). If the dynamic matrix F is
constant over the interval (tk,tk-1), the transition matrix Φ(tk,tk-1) can be obtained by solving
the differential equation using the so called matrix exponential.
dx
= F⋅x
x=
dt
dx
⇒ = F ⋅ dt
x
k
k
k
dx
⇒ ∫ = ∫ F ⋅ dt = F ⋅ ∫ dt
x k −1
k −1
k −1
x
⇒ ln x k − ln x k −1 = ln k = F ⋅ (t k − t k −1 )
x k −1
x
⇒ k = e F⋅( t k − t k −1 )
x k −1
⇒ x k = e F⋅( t k − t k −1 ) ⋅ x k −1
Eq. 3.3-5
By using the power expansion of the exponential function
e F⋅∆t = I + F ⋅ ∆t + 21! ⋅ F 2 ⋅ ∆t 2 + 31! ⋅ F 3 ⋅ ∆t 3 + ... + n1! ⋅ F n ⋅ ∆t n
Eq. 3.3-6
and truncating after the linear term, we obtain the transition matrix by
Φ = I + F ⋅ ∆t
Eq. 3.3-7
It has to be considered that the dynamic matrix has been obtained from linearization.
Furthermore it can be considered as approximately constant only over relatively short period
of time. Therefore, this way of obtaining the transition matrix is limited to short transition
times.
Starting with the equations of motion and neglecting all influences but the point mass
attraction of the Earth, we yield
dx
dy
= xD ,
= yD
dt
dt
dxD
GM
= DxD = − 3 ⋅ x
dt
r
dyD
GM
= DyD = − 3 ⋅ y
dt
r
dzD
GM
= DzD = − 3 ⋅ z
dt
r
R. Wolf
,
dz
= zD
dt
Eq. 3.3-8
Page 11
State Estimation
Inter Satellite Links
Calculating the partial with respect to position and velocity, the part of the a satellites
dynamic matrix considering only position and velocity errors can therefore be expressed by
FSat
0
0
0
x k 2 GM
− (1 − 3 2 ) 3
rk
rk
=
x
y
3 k k GM
rk 5
3 x k z k GM
rk 5
3
0
0
0
0
x k yk
0
0
x kzk
GM
rk 5
y 2 GM
− (1 − 3 k2 ) 3
rk
rk
y z
3 k 5 k GM
rk
3
3
rk 5
yk z k
GM
GM
rk 5
z 2 GM
− (1 − 3 k2 ) 3
rk
rk
1 0 0
0 1 0
0 0 1
0 0 0
0 0 0
0 0 0
Eq. 3.3-9
An other way would be to compute the Jacobian directly, either analytically or by means of
computing the partials numerically. The possible length of the transition interval (and
therefore the orbit arc) is nearly unlimited, thus enabling long integration times.
Unfortunately, the analytical solution is restrained to very simple orbit models. The numerical
solution is the most accurate, because the state propagation is computed using the non linear
force model. A drawback is the high computational burden, because for n states, the trajectory
has to be propagated n+1 times. One trajectory is derived from the nominal state at epoch tk-1,
and n trajectories are computed by adding a small increment on each of the states, as indicated
in Eq. 3.3-10.
X 0,k
X x ,k
X y,k
X z ,k
X xD ,k
X yD ,k
X zD ,k
= f ( x k −1 , y k −1 , z k −1 , xD k −1 , yD k −1 , zD k −1 ,....)
Eq. 3.3-10
= f ( x k −1 + ∆x , y k −1 , z k −1 , xD k −1 , yD k −1 , zD k −1 ,....)
= f ( x k −1 , y k −1 + ∆y, z k −1 , xD k −1 , yD k −1 , zD k −1 ,....)
= f ( x k −1 , y k −1 , z k −1 + ∆z, xD k −1 , yD k −1 , zD k −1 ,....)
= f ( x k −1 , y k −1 , z k −1 , xD k −1 + ∆xD , yD k −1 , zD k −1 ,....)
= f ( x k −1 , y k −1 , z k −1 , xD k −1 , yD k −1 + ∆yD , zD k −1 ,....)
= f ( x k −1 , y k −1 , z k −1 , xD k −1 , yD k −1 , zD k −1 + ∆zD ,....)
...
The transition matrix is then simply derived by subtracting the appropriate state at tk, resulting
from the modified state at epoch tk-1 and the nominal state and dividing by the increment.
Page 12
R. Wolf
Inter Satellite Links
State Estimation
x x , k − x 0, k
∆x
x − x
y,k
0, k
∆y
x z , k − x 0, k
Φ(t k , t k −1 ) =
∆z
x xD , k − x 0, k
∆xD
x yD , k − x 0, k
∆yD
...
y x , k − y0, k
∆x
y y , k − y 0, k
z x , k − z 0, k
∆x
z y, k − z 0, k
xD x , k − xD 0, k
∆x
xD y , k − xD 0, k
∆y
y z , k − y 0, k
∆z
y xD , k − y0, k
∆xD
y yD , k − y0, k
∆yD
...
∆y
z z , k − z 0, k
∆z
z xD , k − z 0, k
∆xD
z yD , k − z 0, k
∆yD
...
∆y
xD z , k − xD 0, k
∆z
xD xD , k − xD 0, k
∆xD
xD yD , k − xD 0, k
∆yD
...
...
...
...
...
...
... ...
Eq. 3.3-11
In the case of using inter satellite links, a transition matrix for the complete constellation is
obtained simply arranging the individual transition matrices as indicated in Eq. 3.3-12.
Φ Total
Φ Sat ,1
0
=
...
0
0
Φ Sat , 2
...
0
0
...
0
...
...
... Φ Sat ,n
...
Eq. 3.3-12
3.4 Least Squares Batch Estimation
Using a linear or linearized relationship between measurement z and state vector x
Eq. 3.4-1
z=H⋅x
the sum of squares of the residual error gets minimised by
(
x = HTH
)
−1
⋅ HT ⋅ z
Eq. 3.4-2
The Matrix H contains the partial derivatives of the measurements with respect to the
instantaneous state. For orbit determination, the measurements of a longer orbit arc have to be
considered to estimate the state at a certain epoch, so the equation has to be rewritten
z = H′ ⋅ x 0
Eq. 3.4-3
where the modified measurement matrix H' contains the partial derivatives of the
measurements z with respect to the state vector at epoch x0. This transforms Eq. 3.4-2 to
(
x 0 = H′T H′
)
−1
⋅ H′T ⋅ z
Eq. 3.4-4
The partials of the measurements with respect to the state at epoch are obtained by
R. Wolf
Page 13
State Estimation
H ′k =
Inter Satellite Links
∂z
∂z ∂x
∂x
=
⋅
=H⋅
∂x 0 ∂x ∂x 0
∂x 0
Eq. 3.4-5
The partials of the actual state x with respect to the state at epoch x0 are expressed by the
Jacobian, and therefore the transition matrix Φ .
x=
∂x
⋅ x 0 = Φ(t , t 0 ) ⋅ x 0
∂x 0
Eq. 3.4-6
Thus we can write for an arbitrary instant of time tk
H ′k = H k ⋅ Φ k
Eq. 3.4-7
The transition matrix from epoch to a time tk can be computed successive from the preceding
transition matrices, only the transient from the previous point to the instant has to be
computed
Φ k = Φ(t k , t 0 ) = Φ(t k , t k −1 ) ⋅ Φ(t k −1 , t k − 2 ) ⋅ .... ⋅ Φ(t 1 , t 0 )
Eq. 3.4-8
If the transition matrix F is computed from a linearized dynamic matrix F, the time interval
(tk,t0) has to be relatively short. For longer batch lengths one would use the numerically
derived Jacobian (see Eq. 3.3-10, Eq. 3.3-11).
The measurement equation system containing measurements of a certain time interval is
obtained by forming the appropriate observation matrices H'k. For example, if the
measurements of four observation times t0 – t3 are used to determine the state at t0, the
observation model would look the following way
z 3 H 3 ⋅ Φ(t 3 , t 0 )
z 2 H ⋅ Φ(t , t )
2 0
= 2
⋅ x0
z
1 H 1 ⋅ Φ(t 1 , t 0 )
z
H0
0
Eq. 3.4-9
3.4.1 Weighted Least Squares
Usually, not all measurements z are made with the same accuracy. Thus, Eq. 3.4-2 has be
rewritten as
(
x = HT ⋅ W ⋅ H
)
−1
⋅ HT ⋅ W ⋅ z
Eq. 3.4-10
to account for the weights of the individual measurements. For uncorrelated measurements,
the weighting matrix W is simply
Page 14
R. Wolf
Inter Satellite Links
1
σ2
1
0
W=
0
...
0
State Estimation
0
0
1
σ 221
0
...
1
σ 32
...
0
0
0
Eq. 3.4-11
0
... 0
... 0
... 0
1
0
σ 2n1
...
with σi² being the variance of the i-th measurement.
3.4.2 Introducing apriori Statistic Information
Sometimes, a good a-priori estimate of some states or the complete state vector, together with
a related accuracy value (variance) is available. One way would be, to introduce the apriori
knowledge of the known state variables as pseudo observations, and therefore to augment the
measurement vector.
If an estimate of the complete state vector is available, typically from the last iteration in an
iterative process, Eq. 3.4-2 can be, according to [BIR-77] rewritten to
(
x LS = Λ + H T H
) ⋅ (Λ ⋅ x
−1
0
+ HT ⋅ z
)
Eq. 3.4-12
with Λ being the so called apriori information matrix. The information matrix is the inverse of
the covariance matrix. Especially in the case of bad observation geometry together with good
predictability (high orbit altitudes) this method can be used very successful.
3.5 Kalman Filtering
3.5.1 Real Time Estimation
If real time state estimation is desired, the state estimator can be implemented as a linearized
or extended Kalman filter. In the following, only a brief overview of the Kalman filter
algorithm is given. More detailed information can be found in literature, e.g. [GEL-88]. The
Kalman filter estimates the state vector x of dynamic system, described by a system of first
order linear differential equations contained in the transition matrix Φ .
With the linearized equations of motion, the transition or prediction of the error state can be
written as
~
x k = Φ k −1 ⋅ xˆ k −1
Eq. 3.5-1
with
x
R. Wolf
state vector
Page 15
State Estimation
Φ
Inter Satellite Links
(linearized) transition matrix
The transition matrix can either be derived from the linearized dynamic matrix or by
numerical derivation of the Jacobian (see chapter 3.3). The transition matrix is not only
needed for state prediction, but also for propagation of the covariance matrix P. In fact, the
"noise shaping" function of the transition matrix is essential, if states which can not be
directly observed are included in the state vector, e.g. velocity is estimated from range
measurements. According to [GEL-88], the covariance propagation can be written as
~
Pk = Φ k −1 ⋅ Pˆ T ⋅ Φ Tk −1 + diag(Q k −1 )
Eq. 3.5-2
with
P
covariance matrix
Q
process noise
If measurements are available, the predicted covariance matrix and state vector can be
updated. The updated state is then obtained by
(
~
~
xˆ k = x k + K k ⋅ z k − H k ⋅ x k
)
Eq. 3.5-3
with
z
measurement
K
Kalman gain matrix
and the updated covariance matrix by
~
Pˆ = (I − K k H k )Pk
Eq. 3.5-4
with
I
Identity matrix
The Kalman gain matrix can be interpreted as a weighting matrix of the innovation introduced
by the measurement z. It depends on the apriori covariance and the measurement noise and
can be computed from the following equation.
(
)
−1
~
~
K k = Pk ⋅ H Tk H k ⋅ P ⋅ H Tk + diag(R k )
Eq. 3.5-5
with
R
measurement noise
H
(linearized) observation matrix
3.5.2 Filtering to Epoch
It is possible to operate the Kalman filter as a batch estimator. The filter algorithms are the
same as for the real time filter, except there is no process noise, state transient or covariance
propagation within the processed batch interval. Instead of the real time measurement matrix
H, the measurement matrix
Page 16
R. Wolf
Inter Satellite Links
State Estimation
H k ⋅ Φ (t k , t 0 )
H ⋅ Φ(t , t )
k −1 0
k −1
H 'k =
...
H1 ⋅ Φ(t1 , t 0 )
H0
Eq. 3.5-6
which maps the measurements to an epoch, has to be applied. The remaining step from the
Kalman filter algorithm have to be rewritten as follows:
(
)
−1
~
~
K k = Pk ⋅ H'Tk H'k ⋅P ⋅ H'Tk + diag(R k )
(
~
~
xˆ k = x k + K k ⋅ z k − H'k ⋅x k
Eq. 3.5-7
)
Eq. 3.5-8
~
Pˆ = (I − K k H' k )Pk
Eq. 3.5-9
The results obtained from a Kalman filter in batch mode are the same as obtained by the least
squares adjustment.
3.5.3 Filter Structures
A Kalman filter can be implemented applying various structures. In a linearized Kalman filter
the estimator would have an open loop structure, in which the filter observes the system state.
In the context of orbit estimation this would mean, that the deviation from a pre-computed
trajectory is estimated and corrections are only fed forward.
Kalman
Filter
Measurement
State Vector
If the estimated deviations from the predicted orbit are fed back into the orbit propagator to
obtain a better prediction for the next time, one has an extended Kalman filter utilising a
closed loop structure.
Measurement
Kalman
Filter
(Error) State Vector
lim x = 0
t→ ∞
Orbit Propagator
R. Wolf
State Vector
Page 17
State Estimation
Inter Satellite Links
The greater flexibility of the extended filter if compared to the linearized filter is an advantage
as well as a disadvantage. Good measurements presumed, the extended filter stays closer to
the true state than the linearized, but it can be corrupted easily by biased measurements.
In practice, a mixed structure would be applied to the orbit estimation problem. The estimated
errors are only fed back into the orbit propagator, if they are assumed to be known precise
enough. The "feed back" criterion could be for example
x
σx
> c Treshold ,
with
Eq. 3.5-10
1 < c Treshold < 10
where σx is the square root of the variance, obtain from the Kalman filter covariance matrix.
In other words this would mean, the trajectory is corrected only if the uncertainty of the error
is several times lower than the error itself.
Page 18
R. Wolf
Inter Satellite Links
Orbit Computation
4 ORBIT COMPUTATION
The computation of a satellite orbit can be done using different approaches:
•
The analytical solution, where orbits are treated as conical sections (Kepler orbits)
•
The numerical integration of the equations of motion, described by a (more or less)
accurate force model.
Satellite orbiting in the relative vicinity of the earth are subject to a lot of disturbing forces,
thus only the numeric integration approach leads to satisfactory result. An accurate orbit
propagator is required not only for simulation purpose, but also for state prediction in the orbit
estimation process, where differential corrections are applied to a reference trajectory. The
longer the processed orbit arc, the more accurate the force model has to be.
4.1 Analytical Solution
The analytical solution is obtained by neglecting all acting forces but the central force. This is
also known as the restricted two body problem, which has first been solved by Johannes
Kepler. Starting with Newton's law of gravity about the attraction of two masses A and B
FAB ( x ) = G ⋅ m A m B ⋅
x A − xB
(x A − xB )
Eq. 4.1-1
3
and assuming one mass to be negligible if compared to the other and building the sum of
kinetic and potential energy leads to the Keplerian equations, where satellite orbits are treated
as conical sections. Depending on whether the sum of kinetic and potential energy is positive,
negative or zero determines the type of conical section.
GM
v 2 GM
−
=−
r
2a
2
v 2 GM
−
=0
r
2
Ellipse
Parabola
v 2 GM GM
−
=
Hyperbola
r
2a
2
Eq. 4.1-2
Eq. 4.1-3
Eq. 4.1-4
withGM Gravitation constant times mass of central body
v
Velocity of point mass
r
Distance of point mass
a
Major semiaxis of conical section
R. Wolf
Page 19
Orbit Computation
Inter Satellite Links
The negative sign of the total trajectory energy is related to a body which is never leaving the
gravity influence of the earth as the central body. Therefore the orbits of earth orbiting
satellites are represented by ellipses.
4.1.1 Kepler Orbits
The classical Kepler orbit is described by six parameters:
a
major semiaxis
ε
numerical eccentricity
i
inclination of the orbital plane
Ω
right ascension of the ascending node
ω
argument of perigee
T0
time of perigee crossing
The three Keplerian law are associated with the following equations:
1. Keplerian law (orbit energy)
GM
v 2 GM
−
=−
r
2a
2
Eq. 4.1-5
2. Keplerian law (rotational impact)
h = r ⋅ v ⋅ cos γ
with
γ
Eq. 4.1-6
angle between the normal on the radius vector and the velocity vector
3. Keplerian law (orbit period)
T2 =
4π 2 3
a
GM
Eq. 4.1-7
Together with the geometrical equations for the ellipse, the movement of a satellite in his
orbital plane can be described. In the following the equations are given only with a brief
description.
Page 20
R. Wolf
Inter Satellite Links
r=
Radius:
p
1 + ε cos ϕ
p = a (1 − ε 2 )
Ellipse parameter:
Time of flight:
Orbit Computation
Eq. 4.1-10
ε + cos ϕ
E = arccos
1 + ε ⋅ cos ϕ
Eq. 4.1-11
Mean anomaly:
M = E − ε ⋅ sin E
Mean Motion:
n=
360 2π
=
T
T
Flight path angle: tan γ =
withϕ
Eq. 4.1-9
T
⋅ (M − ε sin M )
2π
t − T0 =
Eccentric anomaly:
Eq. 4.1-8
ε sin ϕ
1 + ε sin ϕ
Eq. 4.1-12
Eq. 4.1-13
Eq. 4.1-14
true anomaly
M mean anomaly
T
orbital period
To obtain three dimensional Cartesian co-ordinates, the ellipse parameters have to be
transformed to Cartesian vector using the following expression:
x OP
r cos ϕ
= r sin ϕ
0
Eq. 4.1-15
The index OP indicates a reference frame lying in the orbital plane with the x-axis coinciding
with the line of apsis, the z-axis normal to the orbit plane and the origin being the focus of the
ellipse.
The transformation from the orbital plane frame to an inertial fixed frame (e.g. J2000) is done
applying the following vector-matrix operation.
R. Wolf
Page 21
Orbit Computation
Inter Satellite Links
− cos Ω sin ω
cos Ω cos ω
− sin Ω sin ω cos i − sin Ω cos ω cos i sin Ω sin i
sin Ω cos ω
− sin Ω sin ω
xI =
− cos Ω sin i ⋅ x OP
+ cos Ω sin ω cos i + cos Ω cos ω cos i
sin ω sin i
cos ω sin i
cos i
Eq. 4.1-16
Likewise, the transformation from the inertial to an earth centred earth fixed frame (e.g.
WGS-84) is achieved by a similar operation.
x ECEF
Eq. 4.1-17
cos Θ sin Θ 0
= − sin Θ cos Θ 0 ⋅ x I
0
0
1
with
Θ
hour angle
4.1.2 Accounting for Secular Perturbations
A satellite trajectory computed using the Keplerian equations would diverge very soon from
the actual one. Most of the acting forces cause periodically varying perturbations, although
with increasing amplitude. The main secular perturbations are caused by the oblate shape of
the earth's gravity field. The major deviation is due to the nodal regression caused by the
oblateness. The following equation gives the derivative of the right ascension with respect to
time.
2
RE
dΩ
3
= −n ⋅ ⋅ J 2 ⋅
⋅ cos i
dt
2
a 2 ⋅ 1− ε 2
Eq. 4.1-18
with J2 being the oblateness coefficient. The oblate gravity field has also an impact on the line
of apsis
(
R 2E 4 − 5 sin 2 i
dω 3
= ⋅n ⋅J2
dt 4
a 2 1− ε 2
)
Eq. 4.1-19
and a minor impact on the mean motion
M = M 0 + n J2 ⋅ t
Eq. 4.1-20
(
)
3
R 2 3 cos 2 i − 1
⋅ cos i
n J 2 = n 0 1 + ⋅ J 2 ⋅ E
3
4
a 2 ⋅ 1 − ε2
(
)
with
M mean anomaly at time t
Page 22
R. Wolf
Inter Satellite Links
Orbit Computation
M0 mean anomaly at time T0
Applying these equations, the Kepler orbits can be computed with Kepler parameters
corrected for the influence of the oblate earth, thus leading to a somewhat more accurate orbit
computation. Note, that the transformation into the earth fixed frame has to be conducted
using the corrected values for Ω and ω.
4.2 Numerical Integration of the Equations of Motion
The equations of motion of a satellite are described by the following system of six ordinary
linear differential equations, which has to be solved to obtain the satellites position and
velocity vector in time.
dz
dy
dx
= xD ,
= yD ,
= zD
dt
dt
dt
F
dxD
= DxD = ∑ x ,k = ∑ a x ,k = f ( x, y, z)
dt
m
k
k
F
dyD
= DyD = ∑ y ,k = ∑ a y,k = f ( x, y, z)
m
dt
k
k
F
dzD
= DzD = ∑ z ,k = ∑ a z ,k = f ( x, y, z)
dt
m
k
k
Eq. 4.2-1
The integration of such a system of 1st order linear differential equations can not be done
analytically, but is a well known problem to numerical mathematics. There are several
standard procedures to solve it, e.g. Runge-Kutta or Adams-Bashford-Moulton. These two
shall be briefly outlined in this section.
One of the most versatile numerical integration algorithms is the Runge-Kutta procedure. It is
a one-step algorithm, requiring only the preceding state vector to compute the actual one. It
solves differential equations of the type
xD i ( t ) = f i ( x, t )
Eq. 4.2-2
x i (t 0 ) = c 0
applying the following difference equation
Eq. 4.2-3
v
x n +1 = x n + ∑ w i k j
i =1
i −1
k i = h ⋅ f ( t n + ci h , x n + ∑ a ij k j )
j=1
with
h
ci, ai
R. Wolf
step width (in time)
coefficients, determined by the order and stage number of the algorithm
Page 23
Orbit Computation
Inter Satellite Links
The classical Runge-Kutta algorithm is of 4th order and has 4 stages. The stage number
indicates, how often the right hand function f(x, t) has to be evaluated. The four derivatives k1
through k4 are computed the following way:
k1 = f (x i )
Eq. 4.2-4
h
k 2 = f x i + ⋅ k1
2
h
k3 = f xi + ⋅ k 2
2
(
k 4 = f xi + h ⋅ k3
)
With these, the new state vector can be obtained by
x i +1 = x i +
h
6
(
⋅ k1 + 2 ⋅ k 2 + 2 ⋅ k 3 + k 4
)
Eq. 4.2-5
The step width h can be varied easily to minimise degradation due to round of errors. For an
algorithm of order n, the error is of order n+1.
Multistep procedures use the last n state vectors to obtain the state at time k+1. The AdamsBashford algorithm, indicated in Eq. 4.2-6 is called predictor, because it uses the past function
evaluations to compute the present state. If the fk's are stored, only one function evaluation per
time interval h is required, regardless of the order.
Eq. 4.2-6
n −1
x k +1 = x k + h ∑ β i f k −i
i=0
The coefficients βi are determined by the order of the algorithm, as indicated in Table 4-1. A
drawback of the prediction algorithm are round off errors due to large coefficients at high
orders. It is therefore often combined with a so called corrector algorithm (Adams-Moulton),
using a predicted state at time k+1 to evaluate the right hand function.
n −1
x k +1 = x k + h ⋅ β−1 ⋅ f k +1 + h ∑ β*if k − i
Eq. 4.2-7
i=0
The coefficients β* are determined by the order of the procedure and are indicated in Table
4-2.
The combined predictor-corrector-algorithm leads to satisfactory results, comparable with a
Runge-Kutta procedure of the same order. It requires only 2 function evaluation per time
interval h, regardless of the order. In practice, only the combined predictor-corrector
algorithm is used.
The following equations describe explicitly the algorithm for a 4th order Adams-BashfordMoulton numerical integration procedure.
Page 24
R. Wolf
Inter Satellite Links
Orbit Computation
Eq. 4.2-8
h
p k +1 = x k +
⋅ (55 ⋅ f (x k ) − 59 ⋅ f (x k −1 ) + 37 ⋅ f (x k − 2 ) − 9 ⋅ f (x k −3 ))
24
h
x k +1 = x k +
⋅ (9 ⋅ f (p k +1 ) + 19 ⋅ f (x k ) − 5 ⋅ f (x k −1 ) + f (x k − 2 ))
24
The following tables summarise the coefficients for Adams-Bashford predictor and the
corresponding Adams-Moulton corrector up to 8th order. Note, that the error of a nth order
algorithm is also of (n+1)th order, similar to the Runge-Kutta type algorithms.
i
β1i
0
1
2
3
4
5
6
7
1
β2i
3/2
-1/2
β3i
23/12
-16/12
5/12
β4i
55/24
-59/24
37/24
-9/24
β5i
1901/720
-1387/360
109/30
-637/360
251/720
β6i
4277/1440
-2641/480
4991/720
-3649/720
959/480
-95/288
β7i
198721/6048
0
-18637/ 2520
235183/
20160
-10754/ 945
135713/
20160
-5603/2520
β8i
16083/4480
-1152169/
120960
242653/
13440
-296053/
13440
2102243/
120960
-115747/
13440
19087/ 60480
32863/ 13440 -5257/ 17280
Table 4-1 Coefficients of the Adams-Bashford Algorithm
i
-1
β∗1i
1/2
β∗2i
5/12
2/3
-1/12
β∗3i
9/24
19/24
-5/24
1/24
β∗4i
251/720
323/360
-11/30
53/360
-19/720
β∗5i
95/288
1427/1440
-133/240
241/720
-173/1440
3/160
β∗6i
19087/ 60480
2713/2520
-15487/
20160
586/945
-6737/ 20160
263/2520
-863/60480
β∗7i
5257/17280
139849/
120960
-4511/4480
123133/
120960
-88547/
120960
1537/4480
-11351/
120960
0
1
2
3
4
5
6
1/2
275/24192
Table 4-2 Coefficients of the Adams-Moulton Algorithm
R. Wolf
Page 25
Orbit Computation
Inter Satellite Links
A draw back of all multistep procedures is the necessity of n-1 preceding state vector. This
means, multistep procedures require a "starter", usually a Runge-Kutta procedure. Another
draw back is the inflexibility in adapting integration step width h to the required accuracy
demands. Fortunately, nearly circular orbit can be computed using a fixed step width. This
allows, after a starting phase with a low order Runge-Kutta type, the usage of higher order
Adams-Bashford-Moulton type of numerical integrator.
Necessary for all numerical integration algorithms are starting values x 0 , xD 0 as well as the
explicit calculation of the sum of all acting forces or accelerations at each instant of time.
∑a = a
G
+ a L + a S + a SP + a D + a T + a SET + a OT + a A + a Minor + ...
Eq. 4.2-9
k
with the indices
G
Gravity
L
Lunar attraction
S
Solar attraction
SP Solar Pressure
D
Aerodynamic drag forces
T
Thrust (vehicles propulsion system)
SETSolid earth tides
OT Ocean tides
A
Earth Albedo
The following chapters deal with the computation of these contributors to the sum of
accelerations.
4.2.1 Earth’s Gravity
The major part of the earth's gravity field is the spherical term, expressed by
g=−
Eq. 4.2-10
GM
r
2
is already taken into account in Kepler's formulation of the orbital movement. The largest
orbit error, if compared to an unperturbed Keplerian orbit is the non-spherical part of the
earth's gravity field. The gravity potential of the Earth can be described analytically in terms
of spherical harmonics using the following expression:
N
U=
n
GM
a en
+ GM
P (sin ϕ)(C nm cos mλ + Snm sin mλ)
n +1 nm
r
n = 2 m =0 r
∑∑
Eq. 4.2-11
with
Page 26
R. Wolf
Inter Satellite Links
U
Orbit Computation
Gravity potential
GM Earth's gravity constant
r magnitude of radius vector (of an arbitrary point)
a
Earth's equatorial radius
n,m Degree and order of spherical harmonics
Pnm Legendre functions
Cnm,Snm Coefficients of spherical harmonics
ϕ
Latitude
λ
Longitude
The Legendre polynomials Pn and associated functions Pnm are defined as
Pn ( x ) =
1
dn
n
2 n! dx
n
( x 2 − 1) n
Eq. 4.2-12
and
Pnm ( x ) = (1 − x 2 ) m / 2
d m Pn ( x )
dx
Eq. 4.2-13
m
The force acting on a point in the gravitation field is obtained by computing the gradient of
the potential.
∂U ∂U ∂U
g = grad( U ) = (
,
,
)
∂x ∂y ∂z
Eq. 4.2-14
This analytical expression is not very well suited for implementation. Soop (1994) indicates a
recursive method for computing the Legendre polynomials and functions, as well as the
partial derivatives required to compute the gravity force.
4.2.1.1
Computation of Legendre Polynomials and Functions
The Legendre polynomials can be computed recursively using starting values for the first two
terms:
P0 ( x ) = 1;
P1 ( x ) = x
Eq. 4.2-15
2n − 1
n −1
p n (x ) =
⋅ xPn −1 ( x ) −
⋅ Pn − 2 ( x ) if n ≥ 2
n
n
The associated Legendre functions are obtained in two steps. First, the m-fold derivative of
each polynomial Pn(x) is computed
Pn( m ) ( x ) =
R. Wolf
d m Pn ( x )
dx
Eq. 4.2-16
m
Page 27
Orbit Computation
Inter Satellite Links
A direct derivation of the polynomials is, although straight forward, only applicable for lower
degree and order of Legendre functions. Higher derivatives have to be computed recursively
using the following algorithm:
Eq. 4.2-17
Pn( m ) ( x ) = 0 if n < m
Pn( m ) ( x )
= 1 ⋅ 3 ⋅ ... ⋅ (2m − 1) if n = m
Pn( m ) ( x ) =
2n − 1
n + m − 1 (m)
)
⋅ x ⋅ Pn( m
⋅ Pn − 2 ( x ) if n > m
−1 ( x ) −
n−m
n−m
with the starting values:
P0(1) ( x ) = 0
Eq. 4.2-18
P1(1) ( x ) = 1
P1( 2) ( x ) = 0
and afterwards multiplied by the factor
Eq. 4.2-19
(1 − x 2 ) m / 2
4.2.1.2
Normalisation
Usually, the coefficients Cnm and Snm are given in fully normalised form. With this, the
integral over the complete sphere equals 4π. To de-normalise the coefficients, they would
have to be multiplied by the following factors:
(2n + 1)
für m=0;
2(2n + 1)
(n − m)!
(n + m)!
für m≥1
Eq. 4.2-20
This is not always desirable, because the reason for normalisation is the greater numerical
stability of the normalised form. Non-normalised Legendre polynomials Pn and functions Pnm
reach very high values for increasing degree and order, while the coefficients Cnm and Snm get
very small.
For example, the maximum range of a 64-bit double precision variable is exceeded for n,m >
150, while numerical errors become significant much earlier, at about degree and order 20.
One has to keep in mind that for the computation of the geoid undulation the spherical
harmonics up to degree and order 360 are computed. Recursive computation of normalised
Legendre functions and polynomials is possible, although a bit tricky. Each function has to be
multiplied by a normalisation factor and divided by the factors of the preceding functions. Eq.
4.2-15 to Eq. 4.2-19 therefore have to be rewritten. For the polynomials, the recursive
normalisation factors can directly be applied.
Page 28
R. Wolf
Inter Satellite Links
Orbit Computation
P0 ( x ) = 1;
Eq. 4.2-21
Pn ( x ) =
−
P1 ( x ) = x ⋅ 3
2n − 1
2n + 1
⋅ x ⋅ Pn −1 ( x ) ⋅
n
2n − 1
n −1
2n + 1
⋅ Pn − 2 ( x ) ⋅
if n ≥ 2
2n − 3
n
The normalisation factors of the associated Legendre functions contains faculties, which
should not be computed explicitly.
Pn( m ) ( x ) =
d m Pn ( x )
(n − m )!
⋅ 2(2n + 1)
m
(n + m )!
dx
Eq. 4.2-22
Fortunately, they can be reduced in the resulting recursive normalisation factors. The
recursive algorithm for fully normalised Legendre functions is given as
Eq. 4.2-23
Pn( m ) ( x ) = 0 if n < m
Pn( m ) ( x ) = 1 ⋅ 3 ⋅ ... ⋅ (2m − 1) ⋅
Pn( m ) ( x ) =
−
2n + 1
if n = m
(2n − 1)(n + m )(n + m − 1)
(2n + 1)(n − m )
(2n − 1)(n + m )
(2n + 1)(n − m )(n − m − 1)
(2n − 3)(n + m )(n + m − 1)
2n − 1
⋅ x ⋅ Pn(−m1) ( x ) ⋅
n−m
n + m − 1 (m)
⋅ Pn − 2 ( x ) ⋅
n−m
if n > m
with the normalized starting values:
P0(1) ( x ) = 0
Eq. 4.2-24
P1(1) ( x ) = 3
P1( 2) ( x ) = 0
The method described above is numerically very stable and has been successfully used to
compute Legendre functions up to degree and order 700. A drawback of this method is that
the computational burden is about twice as high as for non-normalised Legendre functions.
Thus, for a spherical harmonics expansion up to degree and order of say 15 –20 the denormalisation of the coefficients would be favourable.
4.2.1.3
Computation of Gravity
The expression of the gravity potential in terms of a spherical harmonics expansion
U=
N
n
an
GM
+ GM ∑ ∑ n e+1 Pnm (sin ϕ)(C nm cos mλ + S nm sin mλ )
r
n =2 m=0 r
Eq. 4.2-25
can be rearranged the following way (Colombo 1981)
R. Wolf
Page 29
Orbit Computation
Inter Satellite Links
U=
N n
an
GM
+ GM ∑∑ ne+1 cos m ϕ ⋅ Pn( m ) (sin ϕ)(C nm cos mλ + Snm sin mλ)
r
n = 2 m =0 r
U=
N n
an
GM
+ GM ∑∑ n + me +1 Pn( m ) (sin ϕ)(C nm r m cos m ϕ ⋅ cos mλ + Snm r m cos m ϕ ⋅ sin mλ )
r
n = 2 m =0 r
Eq. 4.2-26
with
x = r cos ϕ cos λ
Eq. 4.2-27
y = r cos ϕ sin λ
z = r sin ϕ
Introducing the following abbreviations
ξ m = r m cosm ϕ cos mλ
Eq. 4.2-28
η m = rm cos m ϕ sin mλ
yields for the gradient of the gravity potential
grad (U ) = (
N
n
GM
an
∂U ∂U ∂U
,
,
) = grad (
) + GM ∑ ∑ grad{ n + em +1 Pn( m ) (sin ϕ )(Cnmξ m + Snmη m )}
r
r
∂x ∂y ∂z
n=2 m=0
Eq. 4.2-29
ξ m , η m can be computed recursively using the following simple expressions
ξ0 = 1
Eq. 4.2-30
η0 = 0
ξ m = ξ m −1 x − η m −1 y
η m = ξ m −1 y + η m −1 x
In the following the partials of the above expression are given
Page 30
∂
an
an
{ n + me +1 } = −(n + m + 1) n + me + 3 x
r
∂x r
Eq. 4.2-31
∂
an
an
{ n + me +1 } = −(n + m + 1) n + me + 3 y
∂y r
r
Eq. 4.2-32
aen
∂ aen
{
} = −(n + m + 1) n + m + 3 z
∂z r n + m +1
r
Eq. 4.2-33
zx
∂ (m)
[ Pn (sin ϕ )] = − 3 Pn( m +1) (sin ϕ )
∂x
r
Eq. 4.2-34
zy
∂ ( m)
[ Pn (sin ϕ )] = − 3 Pn( m +1) (sin ϕ )
∂y
r
Eq. 4.2-35
R. Wolf
Inter Satellite Links
Orbit Computation
∂ (m)
1 z2
[ Pn (sin ϕ )] = − 3 Pn( m +1) (sin ϕ )
r r
∂z
Eq. 4.2-36
∂ξ m m x
sin λ
= [ ξ m + tan ϕ cos λ sin ϕξ m + η m
] = mξ m −1
cos ϕ
∂x
r r
Eq. 4.2-37
∂ξ m m y
cos λ
= [ ξ m + tan ϕ sin λ sin ϕξ m − η m
] = − mη m −1
cos ϕ
∂y
r r
Eq. 4.2-38
∂ξ m m z
= [ ξ m − tan ϕ cos ϕξ m ] = 0
∂z
r r
Eq. 4.2-39
∂η m m x
sin λ
= [ η m + tan ϕ cos λ sin ϕη m − ξ m
] = mη m −1
cos ϕ
∂x
r r
Eq. 4.2-40
∂η m m y
cos λ
= [ η m + tan ϕ sin λ sin ϕη m + ξ m
] = mξ m −1
cos ϕ
∂y
r r
Eq. 4.2-41
∂η m m z
= [ η m − tan ϕ cos ϕη m ] = 0
∂z
r r
Eq. 4.2-42
Especially the computation of the η and ξ is subject to numerical problems because they are
in the order of magnitude of rm. For a high order spherical expansion it is advantageous to
compute
η
rm
ξ
ξ= m
r
Eq. 4.2-43
η=
which is dimensionless and restricted to the range between 0 and 1. The remaining factor rm
can be multiplied with the terms
a en
r
n + m +1
and
a en
r
Eq. 4.2-44
n + m +3
This has the additional advantage of bringing them into a numerical stable form
R. Wolf
Page 31
Orbit Computation
a en
r n + m +1
a en
r n + m+3
Inter Satellite Links
ae
1 r
⋅ m =
r
r
n
ae
1 r
⋅ m =
r
r3
n
Eq. 4.2-45
which is desirable even for lower degrees of spherical harmonics. The ratio of earth's
equatorial radius and satellite orbit radius is always between 0 and 1, enhancing numerical
stability. However, using the dimensionless values η and ξ doesn't increase computational
load.
4.2.2 Third Body Attraction
The attraction acting on an orbiting satellite due to the other celestial bodies in the solar
system, mainly Sun and Moon, could basically be computed like the acceleration from the
earth's gravity field. However, due to the usually large distances it is sufficient to neglect all
higher order terms, and regard the gravity field of celestial bodies as perfect spheres. The
resulting acceleration, with respect to an earth centred inertial fixed reference frame, can be
obtained from the following equation.
*
d2r
dt 2
Sun , Moon
*
*
*
rS,M − r
rS, M
= GM S,M [ *
* 3− 3 ]
| rS,M − r |
rS, M
Eq. 4.2-46
with
r Radius vector, S,M being indices for Sun and Moon. Without index means
satellites radius vector.
GM Gravity constant of perturbing body (Sun, Moon)
This equation holds also for the major planets, although the influence even from Jupiter is
several orders of magnitude lower than lunisolar perturbations. It is also referred to as the
direct tidal effect.
4.2.3 Solar Pressure
The acceleration acting on an orbiting body due Solar radiation pressure can be obtained from
the following expression, which simply characterises the satellite by it's cross section and
mass.
* *
c R ⋅ A 2 r − rs
*
⋅ as ⋅ * * 3
a d = µ ⋅ Ps ⋅
m
| r − rs |
Page 32
Eq. 4.2-47
R. Wolf
Inter Satellite Links
Orbit Computation
where
PS =E/c
E
Solar constant (nominal 1358 W/m²)
c
vacuum speed of light
cR reflectivity coefficient
aS astronomical unit
A
area / cross section
m
mass
r , rSradius vectors of Satellite and Sun respectively
µ
eclipse factor
Normally, the "sensitivity" of the satellite to solar radiation, in Eq. 4.2-47 simplified as
cR ⋅ A
Eq. 4.2-48
m
is a complicated function of the satellites shape, used materials and attitude with respect to the
sun. But for generic system level studies, this simplification is absolutely sufficient.
The eclipse factor µ determines the amount of solar radiation acting on the satellite, being
defined as
µ=1
for complete sun light
µ=0
for umbra phase
0<µ<1
for penumbra phase
Occultation of the Sun can arise from Earth or Moon. It depends on the model, whether the
penumbra phase is taken into account or not. Simpler models treat the earth's shadow as a
cylinder or a cone, more sophisticated models computes the eclipse factor for the penumbra
phase from the percentage of the visible sun "disc".
4.2.4 Air Drag
Satellites below 1000 km orbit height are strongly affected by drag forces. Although the air
density is extremely low at such altitudes, the high velocity of a satellite leads to significant
acceleration (or better deceleration), obtained by the following equation:
c ⋅ A ρ D D
aD = D
⋅ ⋅ r ⋅r
m
2
Eq. 4.2-49
where
aD Acceleration due to air drag
cD Drag coefficient
R. Wolf
Page 33
Orbit Computation
A
area
m
mass
ρ
D
r
air density
Inter Satellite Links
velocity vector with respect to earth centred earth fixed coordinates
Again, shape and attitude of the satellite are simplified for the sake of generality, by
characterising the satellite using the so called ballistic coefficient
cD ⋅ A
m
Eq. 4.2-50
Determination of the air density is the most critical part in Eq. 4.2-49. It is subject to variation
in solar flux and very difficult to model. Normally, the air density is modelled as a
exponential function over a certain altitude range hL < h < hU.
ρ(h ) = ρ L ⋅ e
h−h L
H0
Eq. 4.2-51
with the so called scale height
H0 =
R ⋅T
g
Eq. 4.2-52
and
ρ(h) air density at altitude h
ρL air density an lower bound of altitude range
R
special gas constant (for air: 287 J / (kg * K))
T
Thermodynamic temperature in Kelvin
g
Gravity
The following table, found in [WEZ-91], indicates the parameters for an atmospheric model:
Page 34
R. Wolf
Inter Satellite Links
Orbit Computation
Atmospheric Density ρ [kg/m³]
Altitude [km]
Solar Min
Solar Max
Scale Height H0 [km]
Solar Min
Solar Max
h
Night
Day
Night
Day
Night
Day
Night
Day
100
9.8e-9
9.8e-9
9.8e-9
9.8e-9
6.0
5.9
5.9
5.9
200
1.8e-10
2.1e-10
3.2e-10
3.7e-10
33.4
37.9
43.2
49.4
300
5.0e-12
1.1e-11
2.6e-11
4.7e-11
44.5
53.2
57.0
67.9
400
4.8e-13
1.6e-12
5.0e-12
1.2e-11
52.8
60.5
69.5
79.8
500
4.1e-14
2.0e-13
8.5e-13
3.1e-12
60.4
67.4
74.6
88.7
600
1.0e-14
3.9e-14
2.0e-13
1.0e-12
76.1
76.4
81.8
96.1
700
4.1e-15
1.0e-14
4.8e-14
3.1e-13
133.7
95.6
92.8
105.0
800
2.4e-15
4.3e-15
1.7e-14
1.1e-13
213.4
138.7
113.5
115.8
900
1.6e-15
2.4e-15
7.3e-15
4.3e-14
324.8
215.4
153.2
134.2
1000
9.6e-16
1.7e-15
4.2e-15
2.0e-14
418.2
308.9
217.1
164.9
Table 4-3 Atmospheric Density and Scale Height
4.2.5 Solid Earth Tides
The solid earth tides result as a indirect effect from the attraction of Moon and Sun. They
cause a deformation of the earth figure and the therefore of the earth's gravity field, which can
be expressed as a deviation of the harmonic coefficients. The deviations of the earth's
harmonic coefficients of 2nd and 3rd order due to solid tides can be expressed by following
equation found in [ITN-96]:
∆C nm + i∆S nm
3 GM
k
j
= nm ∑
2n + 1 j=2 GM E
RE
r
j
n +1
Pnm (sin Φ j )e
−imλ j
Eq. 4.2-53
with
knm
Nominal degree Love number for degree n and order m
RE
Equatorial radius of the Earth
GMj Gravitational parameters for Earth (E), Moon (j = 2) and Sun (j = 3)
rj Distance from geocenter to Moon (j = 2) and Sun (j = 3)
R. Wolf
Page 35
Orbit Computation
Fj
Inter Satellite Links
Earth fixed geocentric latitude of Moon and Sun
lj Earth fixed geocentric longitude of Moon and Sun
Pnm
Legendre function of degree n and order m
The Love numbers are a measure for the elasticity of the earth body. A somewhat more
simple expression for the acceleration due to the solid earth tides can be found in [RIZ-85].
The force acting on a satellite due to solid earth tides is given as
5
r = k 2 ⋅ GMS, M ⋅ a E ⋅ 3 − 15 ⋅ cos 2 θ ⋅ rSat + 6 ⋅ cos θ ⋅ rS, M
Sat
4
2
rS3, M
rSat
rSat
rS, M
(
)
Eq. 4.2-54
with
r Radius vector of satellite (Sat), Sun (S) and Moon (M)
θ Angle between radius vectors of satellite and tide causing body.
aE
Equatorial radius of Earth.
GM Gravitational constant of Sun (S) and Moon (M).
k2
Love Number
In this model, only the dominating deformation effect on the earth's dynamic oblateness,
represented by the 2nd zonal harmonic coefficient is considered. Despite being a simple earth
tide model, it is sufficient for basic evaluations. It can be seen from Eq. 4.2-54 that the
influence decreases with fourth power of the satellites radius vector.
4.2.6 Ocean Tides
The deformation of the earth's gravity field caused by ocean loading tides, can also be
accounted for as a deviations of the harmonic coefficients. In [ITN-96], following expression
can be found
∆C nm − i∆S nm = Fnm
∑ ∑ (C
−
s ( n ,m ) +
±
snm
)
±
Ssnm
e ±iθf ,
Eq. 4.2-55
where
Fnm =
4πGρ w
g
(n + m )!
1 + k ′n
(n − m )!⋅(2n + 1) ⋅ (2 − δ om ) 2n + 1
with
g mean equatorial gravity
Page 36
G
Gravity constant
k'n
load deformation coefficients
R. Wolf
Inter Satellite Links
Orbit Computation
Csnm , Ssnm Ocean tide coefficients for the tide constituent s
θ Argument of tide constitudent s
For a more detailed description see [ITN-96]. The computed deviations are used to correct the
rigid earth gravity model coefficients. These modified coefficients are then used to compute
the gravity acceleration, corrected for ocean tides.
4.2.7 Earth Albedo
The reflection of sun light from the earth's surface produces a force, similar to solar radiation
pressure but smaller, acting on the satellite. Unfortunately, the reflected solar flux is subject to
the density of clouds, the angle between satellite, earth and sun etc. A very rough estimate can
be given using the following formula:
*
c ⋅A r
*
⋅ * 3
a Albedo = Ψ ⋅ R
m |r|
Eq. 4.2-56
with
Ψ
Radiation pressure from earth
r
satellites position vector
cR reflectivity coefficient
A
area / cross section
m
mass
where
Ψ = f (c R ,Earth , α,...)
Eq. 4.2-57
is still a function of at least the earth's reflectivity, subject to cloud density and the angle
between sun earth and satellite. Especially for LEO satellites, earth albedo is hard to model.
For higher satellite orbits, earth albedo can usually be neglected.
4.2.8 Vehicle Thrust
When orbit corrections become necessary, an additional force resulting from the vehicles
propulsion system has to taken into account.
T a Thrust =
⋅ b (t )
m (t )
Eq. 4.2-58
with
T
Thrust
b
Vehicles thrust vector
m(t) Mass being a function of time
where the mass decrease while fuel is burned and exhausted is described by
R. Wolf
Page 37
Orbit Computation
D ⋅t
m (t ) = m 0 − m
Inter Satellite Links
Eq. 4.2-59
The mass flow can be also be a (commanded) function of time. However, most of the
chemical propulsion systems have a fixed mass flow.
Page 38
R. Wolf
Inter Satellite Links
Orbit Computation
4.3 Force Model Errors
A given force model will only be accurate to a certain degree. This lead to a divergence of the
predicted trajectory, and the actual one. On the other hand, if computational recourses are
rare, the orbit arc is short or the required accuracy is not that demanding, it is necessary to
assess the impact of simplifying the force model. This section deals with the impact of these
force model simplifications, as well as force model errors on the orbit prediction error.
4.3.1 Earth's Gravity
As shown in chapter 4.2.1, the impact of the higher order spherical harmonics of the earth's
gravity field decreases with orbit altitude. Neglecting higher order terms will therefore lead to
prediction errors, but depending on orbit altitude. Another error source is the imperfection of
the harmonic coefficients. To assess the impact of neglecting higher order terms, as well as an
imperfect gravity model, a reference trajectory has been computed using the full JGM-3,
being a state of the art gravity model. Degree and order of the model has been decreased
successively and the resulting trajectory has been compared to the reference orbit.
Furthermore the reference trajectory has been compared to orbits computed with other full
gravity models. The following gravity models have been compared:
Gravity Model
Maximum Degree x
Order
JGM-3 (Reference
Model)
70 x 70
JGM-2
70 x 70
GEM-T3
50 x 50
GRIM4-S4
66 x 66
Table 4-4 Assessed Gravity Models
All these models have been derived by satellite measurements. To show the impact of the
orbit altitude, different reference orbit have been computed:
•
a low earth orbit (LEO) with 1250 km orbit altitude
•
a GPS like orbit (MEO) with 20200 km orbit altitude
•
a geostationary orbit (GEO) with approximately 36 000 km orbit altitude
The following figure indicates the prediction errors if a 1250 km LEO is predicted using only
a 15 x 15 gravity model. The errors shows a periodic behaviour reflecting the orbital period of
R. Wolf
Page 39
Orbit Computation
Inter Satellite Links
the satellite, as can be seen from the figure. Although the along track error seems to have a
secular trend, the approximately quadratic trend is only the ascending branch of a sine wave,
with the major semi axis being the amplitude. This isn't very surprising due to the fact that the
equations of motion are described by a second order differential equation.
400
Orbit Error [m]
300
Radial
Along Track
Cross Track
200
100
0
20:52:30.000
05:12:30.000
13:32:30.000
UTC [hours:minutes:seconds]
Figure 4-1 Prediction Error of LEO 1250 km with 15 x 15 Geopotential
The following tables show the evaluations of the orbit errors induced by successively
neglecting more higher order harmonics down to a pure spherical gravity field, as well as a
comparison to other gravity models. The gravity model "deviated JGM-3" has been obtained
by adding to a coefficient the one sigma value of that coefficients uncertainty times a normal
distributed random number with zero mean and variance one.
Table 4-5 shows the orbit error after one day for the LEO satellite. The neglecting of
harmonics above 30 causes an error of the same order of magnitude as the uncertainties of the
gravity model, represented by "deviated JGM-3". The differences to other gravity models
(besides GEM-T3) are higher, but JGM-3 can be regarded as the state of the art gravity
model. Comparison to the Kepler orbit shows a large error. For precise orbit determination,
even for short time prediction with frequent measurement updates, a model considering less
than degree and order 30 x 30 is not acceptable.
Table 4-6 shows the orbit error after shorter prediction period of 6 hours. Here, neglecting
harmonics above 50's degree and order causes only small but noticeable orbit errors. But they
are far below the model uncertainties.
Page 40
R. Wolf
Inter Satellite Links
Orbit Computation
Radial [m]
Along Track [m]
Cross Track [m]
50 x 50
0
0.11
0
30 x 30
0.18
4.21
0.02
15 x 15
4.94
158.5
0.41
10 x 10
12.34
196.5
5.25
5x5
42.5
2.33 km
18.1
2x2
387
4.5 km
50.7
J2-Propagator (2 x 0)
1.1 km
79.4 km
42 km
Kepler (0 x 0)
18.4 km
404 km
90.4 km
JGM-2 (70 x 70)
0.36
24.4
0.1
GEM-T3 (50 x 50)
0.24
0.87
0.02
GRIM4-S4 (66 x 66)
0.37
24.6
0.03
Deviated JGM-3
0.18
2.94
0.03
Table 4-5 1250 km LEO 1 day
R. Wolf
Page 41
Orbit Computation
Inter Satellite Links
Radial [m]
Along Track [m]
Cross Track [m]
50 x 50
0
0.01
0
30 x 30
0.04
0.34
0.01
15 x 15
0.91
4.53
0.19
10 x 10
4.2
67.6
2.8
5x5
43.7
762
7.6
2x2
330
1.4 km
62.1
J2-Propagator (2 x 0)
1.1 km
33 km
21 km
Kepler (0 x 0)
7.8 km
175 km
49.3 km
JGM-2 (70 x 70)
0.30
4.26
0.06
GEM-T3 (50 x 50)
0.11
0.48
0.02
GRIM4-S4 (66 x 66)
0.29
4.35
0.02
Deviated JGM-3
0.05
0.23
0.02
Table 4-6 1250 km LEO 6 hours
The next figure show the results obtained for a medium earth orbit (MEO). The chosen orbit
of approximately 20200 km orbit altitude with 55° inclination represents a generic GPS orbit,
which is the most appropriate for navigation satellites. It has been propagated using a 5 x 5
gravity model, and compared to the reference orbit using the full 70 x 70 model.
Page 42
R. Wolf
Inter Satellite Links
Orbit Computation
1.0
0.8
Orbit Error [m]
0.6
Radial
Along Track
Cross Track
0.4
0.2
0.0
-0.2
20:52:30.000
05:12:30.000
13:32:30.000
UTC [hours:minutes:seconds]
Figure 4-2 Orbit Error of MEO with 5 x 5 gravity model after 1 day
Here also the orbital period can also be seen in the error behaviour. The following tables
indicates the 1σ error after one day and after six hours of prediction, for different gravity
models.
R. Wolf
Page 43
Orbit Computation
Inter Satellite Links
Radial [m]
Along Track [m]
Cross Track [m]
7x7
0
0.01
0
5x5
0.07
0.46
0.01
2x2
13.1
84.6
3.2
J2-Propagator (2 x 0)
378
3.3 km
2 km
Kepler (0 x 0)
1.5 km
16.8 m
4.7 km
JGM-2 (70 x 70)
0.02
0.13
0
GEM-T3 (50 x 50)
0.44
5.4
0
GRIM4-S4 (66 x 66)
0.32
3.96
0
Deviated JGM-3
0
0.01
0
Table 4-7 20200 km MEO 1 day
Radial [m]
Along Track [m]
Cross Track [m]
7x7
0
0
0
5x5
0.02
0.07
0
2x2
8.2
10.7
2.9
J2-Propagator (2 x 0)
374
409
600
Kepler (0 x 0)
1.6 km
3.2 km
1.5 km
JGM-2 (70 x 70)
0.01
0.01
0
GEM-T3 (50 x 50)
0.48
1.22
0
GRIM4-S4 (66 x 66)
0.33
0.81
0
Deviated JGM-3
0
0
0
Table 4-8 20200 km MEO 6 hours
Page 44
R. Wolf
Inter Satellite Links
Orbit Computation
It can be seen that a satellite in that orbit altitude is fairly good predicted if a gravity model of
7 degree and order is used. Even for long term prediction (< 1 week) a 15 x 15 model is
suffcient.
The next two tables shows the orbit errors for the GEO. It is obvious that the GEO is affected
only by the lower harmonics. For a short prediction period a spherical harmonic expansion up
to degree and order 5 is sufficient. For longer prediction periods, a gravity model up to 9
degree and order is sufficient.
Radial [m]
Along Track [m]
Cross Track [m]
7x7
0
0
0
5x5
0
0.03
0.01
2x2
6.23
36.41
0.76
J2-Propagator (2 x 0)
71
187
0.8
Kepler (0 x 0)
1.8 km
13.1 km
0.97
JGM-2 (70 x 70)
0
0.01
0
GEM-T3 (50 x 50)
0.7
4.6
0
GRIM4-S4 (66 x 66)
0.5
3.4
0
Deviated JGM-3
0
0
0
Table 4-9 GEO 1 day
R. Wolf
Page 45
Orbit Computation
Inter Satellite Links
Radial [m]
Along Track [m]
Cross Track [m]
7x7
0
0
0
5x5
0
0.01
0
2x2
6.2
14.8
0.8
J2-Propagator (2 x 0)
4.4
18.5
0.7
Kepler (0 x 0)
786
763
0.3
JGM-2 (70 x 70)
0
0
0
GEM-T3 (50 x 50)
0.44
0.58
0
GRIM4-S4 (66 x 66)
0.26
0.3
0
Deviated JGM-3
0
0
0
Table 4-10 GEO 6 hours
Another interesting fact is that the model uncertainties are negligible, especially if compared
to the LEO orbit. This is due to the fact that the uncertainties of the lower order harmonics
compared to their magnitude are far smaller than those of the higher order harmonics.
It is clear that the GEO orbit, due to the fact the it has a non inclined orbit and see's always the
same part of the gravity field is subjected to extreme low perturbation from the higher order
harmonics. A more general class of orbits, the inclined geosynchronous orbit (IGSO) has the
same revolution period (and therefore orbit altitude) as the GEO. The error introduced to an
IGSO orbit by neglecting higher order harmonics shows similar tendencies as for the GEO
orbit. The IGSO is slightly more affected by tesseral and sectorial harmonics than the GEO,
due to its inclined orbit. But also for this orbit class a 9 x 9 gravity model is sufficient.
Page 46
R. Wolf
Inter Satellite Links
Orbit Computation
4.3.2 Third Body Attraction (Direct Tidal Effects)
Figure 4-3 and Figure 4-4 show the orbit errors arising from neglecting the lunar attraction.
All orbit errors show a oscillating characteristic with the along track error being superimposed
by a linear trend.
10
0
Orbit Error [m]
-10
-20
-30
-40
Radial
Along Track
Cross Track
-50
19:12:30.000
01:52:30.000
08:32:30.000
UTC [hours:minutes:seconds]
Figure 4-3 Orbit Error of LEO 1250 km neglecting Lunar Attraction
R. Wolf
Page 47
Orbit Computation
Inter Satellite Links
400
200
0
Orbit Error [m]
-200
-400
-600
-800
-1000
-1200
-1400
Radial
Along Track
Cross Track
19:12:30.000
01:52:30.000
08:32:30.000
UTC [hours:minutes:seconds]
Figure 4-4 Orbit Error of MEO neglecting Lunar Attraction
Obviously the LEO satellite is less affected by third body attractions than satellites in MEO (or GEO and IGSO)
orbits. It is a general tendency that the direct tidal effect increases with orbit height. This can easily be verified
by setting the satellites radius in Eq. 4.2-46 to zero which causes the third body attraction to vanish.
The following table show the orbit errors due to neglecting lunar attraction for prediction
periods of one day and six hours.
Page 48
R. Wolf
Inter Satellite Links
Orbit Computation
Radial [m]
Along Track [m]
Cross Track [m]
LEO 1 day
1.24
23.5
4.0
LEO 6 hours
1.1
7.0
1.4
MEO 1 day
167
687
101
MEO 6 hours
201
288
19
GEO 1 day
1 km
2.9 km
370
GEO 6 hours
219
385
96
IGSO 1 day
1 km
3.1 km
446
IGSO 6 hours
464
410
175
Table 4-11 Lunar Tide Perturbation
The solar attraction, although being slightly lower in magnitude shows in principle the same
error characteristic. Thus only the summary table or the root mean square error is given
below.
Radial [m]
Along Track [m]
Cross Track [m]
LEO 1 day
0.47
4.12
4.99
LEO 6 hours
0.46
1.05
1.3
MEO 1 day
69
144
119
MEO 6 hours
55
177
37
GEO 1 day
429
1 km
309
GEO 6 hours
308
240
94
IGSO 1 day
423
1 km
525
IGSO 6 hours
259
420
226
Table 4-12 Solar Tide Perturbation
R. Wolf
Page 49
Orbit Computation
Inter Satellite Links
Third body attraction has to be modelled, regardless of the application (but especially for
navigation satellites). The errors introduced by neglecting these contributing forces are far
from being negligible.
4.3.3 Solar Radiation Pressure
The following figures shows the orbit error due to direct solar radiation pressure for the
investigated orbits. Obviously the LEO is affected less by (neglecting) solar radiation, due to
the fact that the exciting force (=solar radiation pressure) has a slowly varying geometry.
80
70
60
Orbit Error [m]
50
Radial
Along Track
Cross Track
40
30
20
10
0
-10
-20
19:12:30.000
01:52:30.000
08:32:30.000
UTC [hours:minutes:seconds]
Figure 4-5 Orbit Error of 1250km LEO neglecting Solar Radiation Pressure
Page 50
R. Wolf
Inter Satellite Links
Orbit Error [m]
600
Orbit Computation
Radial
Along Track
Cross Track
400
200
0
-200
19:12:30.000
01:52:30.000
08:32:30.000
UTC [hours:minutes:seconds]
Figure 4-6 4-7Orbit Error of MEO neglecting Solar Radiation Pressure
The shorter revolution time is an important factor. The orbit error due to solar radiation shows
also the characteristic of a sine wave with increasing amplitude, with the orbital period as
natural frequency. Compared to the LEO orbit, the perturbation of the MEO orbit has a lower
frequency, but is faster increasing in amplitude, as can be seen in the figures. Table 4-13
indicates the RMS error for different prediction periods and satellite orbits.
R. Wolf
Page 51
Orbit Computation
Inter Satellite Links
Radial [m]
Along Track [m]
Cross Track [m]
LEO 1 day
8.8
27.6
0.57
LEO 6 hours
2.3
7.2
0.17
MEO 1 day
78.6
211
3.6
MEO 6 hour
7.2
35.5
3.6
GEO 1 day
182
589
10.3
GEO 6 hours
21.6
18.6
4.4
IGSO 1 day
175
511
19
IGSO 6 hours
23
26
12
Table 4-13 Solar Radiation Perturbation
It can be seen that for all orbits, even for short term prediction, this perturbation has to be
considered.
4.3.4 Air Drag
The following tables shows the orbit error due to neglecting air drag. Satellites in orbits above
1000 km are hardly or not at all affected by air drag, thus being indicated in this table only for
completeness. Unlike the other perturbations, the air drag error is not given as RMS value, but
the instantaneous value at the end of the indicated period. This is due to the secular nature of
air drag perturbation.
Radial [m]
Along Track [m]
Cross Track [m]
500 km LEO
70
6.4 km
2.5
800 km LEO
1.96
199
0.1
1250 km LEO
0.09
6.2
0
MEO
0
0
0
GEO
0
0
0
IGSO
0
0
0
Table 4-14 Air Drag Perturbation after 1 Day
Page 52
R. Wolf
Inter Satellite Links
Orbit Computation
Radial [m]
Along Track [m]
Cross Track [m]
500 km LEO
14
322
0.19
800 km LEO
0.65
9.83
0
1250 km LEO
0.01
0.18
0
MEO
0
0
0
GEO
0
0
0
IGSO
0
0
0
Table 4-15 Air Drag Perturbation after 6 Hours
The following figures indicates the orbit error of a 800 km LEO neglecting air drag, over a
prediction period of one day.
0
Orbit Error [m]
-50
-100
Radial
Along Track
Cross Track
-150
-200
06:39:30.000
13:19:30.000
19:59:30.000
UTC [hours:minutes:seconds]
Figure 4-8 Orbit Error of 800 km LEO neglecting Air Drag
Air drag forces act in direction of the flight path, i.e. the along track error is affected most. As
a secondary effect, the orbit altitude decreases due to the dissipation of kinetic energy. The
R. Wolf
Page 53
Orbit Computation
Inter Satellite Links
cross track however error shows a periodic error characteristic, with the orbital period as a
natural frequency and increasing amplitude. This characteristic also superimposed to the
(linear) secular tendency in the radial error.
3.0
0.10
Radial
Cross Track
2.5
Orbit Error [m]
Orbit Error [m]
0.05
2.0
1.5
1.0
0.00
-0.05
0.5
-0.10
0.0
06:39:30.000
13:19:30.000
19:59:30.000
UTC [hours:minutes:seconds]
06:39:30.000
13:19:30.000
19:59:30.000
UTC [hours:minutes:seconds]
Figure 4-9 Radial / Cross Track Error of 800 km LEO neglecting Air Drag
Thus, for satellite orbits below 1000 km, air drag has to be modelled.
Page 54
R. Wolf
Inter Satellite Links
Orbit Computation
4.3.5 Other Perturbations
Other forces which contribute to the orbit perturbations are
•
Solid earth tides
•
Ocean tides
•
Albedo (reflection from earth)
•
Third body attraction due to major planets
In this section, only a few of them will be considered. LEO satellites are subject to
perturbations from earth albedo, solid earth tides and ocean loading tides. These perturbations
can be of non negligible magnitude in orbits below 800 km. Here, the major focus is on
satellite orbits suited for navigation applications. A constellation consisting of LEO satellites
requires a high number of space craft to make sure that always a minimum of four space
vehicles are visible from any location on earth. The required number increases with
decreasing orbit height, thus a navigation constellation would have an orbit altitude above
1000 km. Therefore, only two of the minor perturbation are shown in this section.
Figure 4-10 and Figure 4-11 show the prediction error due to neglecting solid earth tides. For
the 800 km LEO, the error is quite noticeable after one day, but for the MEO it is almost
negligible.
5
0
Orbit Error [m]
-5
Radial
Along Track
Cross Track
-10
-15
-20
-25
-30
-35
06:39:30.000
13:19:30.000
19:59:30.000
UTC [hours:minutes:seconds]
Figure 4-10 Orbit Error of 800 km LEO neglecting Solid Earth Tides
R. Wolf
Page 55
Orbit Computation
Inter Satellite Links
0.2
0.0
Orbit Error [m]
-0.2
-0.4
-0.6
-0.8
-1.0
Radial
Along Track
Cross Track
-1.2
-1.4
19:12:30.000
01:52:30.000
08:32:30.000
UTC [hours:minutes:seconds]
Figure 4-11 Orbit Error of MEO neglecting Solid Earth Tides
The following table indicates the resulting orbit errors (RMS), depending on the orbit type
and prediction interval.
Radial [m]
Along Track [m]
Cross Track [m]
500 km LEO
0.24
22
0.9
800 km LEO
0.23
20.5
0.82
1250 km LEO
0.24
16.3
0.47
MEO
0.07
0.75
0.02
GEO
0.04
0.27
0.01
IGSO
0.04
0.25
0.01
Table 4-16 Solid Earth Tide Perturbation after 1 day
Page 56
R. Wolf
Inter Satellite Links
Orbit Computation
As can be seen from the table above, the error contribution is negligible for MEO, GEO and
IGSO orbits, but not for LEO orbits. In fact, for precise orbit prediction of LEO satellites even
the ocean tides will have to be evaluated.
The attraction of the major planets in our solar system also cause a tidal effect like sun and
moon, but orders of magnitude lower. Figure 4-12 shows the prediction error for an IGSO
neglecting the attraction of the major planets over one week.
0.06
0.04
Orbit Error [m]
0.02
0.00
-0.02
-0.04
Radial
Along Track
Cross Track
-0.06
-0.08
-0.10
0
2
4
6
8
Time [days]
Figure 4-12 Prediction Error of IGSO neglecting Major Planets Attraction
Table 4-17 summarises the effect on different orbits after one week of prediction. It is clear
that this perturbation can be neglected for earth orbiting satellites. They become more
essential if interplanetary trajectories are to be considered. But this is far from the scope of
this text focussing on (earth) navigation satellites.
R. Wolf
Page 57
Orbit Computation
Inter Satellite Links
Radial [m]
Along Track [m]
Cross Track [m]
500 km LEO
0
0
0
800 km LEO
0
0
0
1250 km LEO
0.001
0
0
MEO
0
0.005
0.005
GEO
0.002
0.005
0.012
IGSO
0.003
0.047
0.022
Table 4-17 Attraction from Major planets Perturbation after 1 Week
4.3.6 Numerical Errors
Numerical integration algorithms have the possibility to estimate the so called local error by
halving or doubling the step width and comparing the results. Unfortunately, the global error
due to round off introduced by numerical integration can not be estimated that way. To assess
the global error following calculation have been conducted:
Neglecting all accelerations except the central force, exact one revolution of a satellite orbit
has been propagated. The resulting end state vector has been compared to the initial state
vector, which would have to be identical presuming a perfect integration procedure. Three
different integration algorithms have been evaluated:
•
4th order Runge-Kutta
•
4th order Adams-Bashford-Moulton
•
8th order Adams-Bashford-Moulton
The step width has been varied to keep the local error below 1 cm.
Figure 4-13 shows the necessary step width for each integration method. It can be generally
said, if the orbit altitude is low the step width has to be small due to the strong acceleration.
Page 58
R. Wolf
Inter Satellite Links
Orbit Computation
250
Step Width [s]
200
RK4_H
ABM4_H
ABM8_H
150
100
50
0
0
10000
20000
30000
40000
50000
Orbit Altitude [km]
Figure 4-13 Integration Step Width vs. Orbit Altitude
It ca be seen that the Adams-Bashford-Moulton method of 4th order achieves the same local
error as the 4th order Runge-Kutta using a slightly higher step width. The step width has a
linear impact on the number of function evaluations which have to be performed. The 8th
order A-B-M method achieves much higher step widths which is not surprising regarding the
higher order. The next figure shows the number of necessary function evaluations,
corresponding to the method and step width.
R. Wolf
Page 59
Orbit Computation
Inter Satellite Links
Number of Function Evaluations [-]
18000
RK4_Nf
ABM4_Nf
ABM8_Nf
16000
14000
12000
10000
8000
6000
4000
2000
0
0
10000
20000
30000
40000
50000
Orbit Altitude [km]
Figure 4-14 Number of Function Evaluations vs. Orbit Altitude
The "sawtooth" figure results from the fact that the number of function evaluations is halved
when the step width is doubled. It can be seen that the 4th order Runge-Kutta method requires
about double the number function evaluations than the 4th order Adams-Bashford-Moulton
method. This is also not surprising, due to the fact that The Runge-Kutta requires for each
step 4 function evaluations, and the Adams-Bashford-Moulton only two, regardless of the
order.
Page 60
R. Wolf
Inter Satellite Links
Orbit Computation
0.05
RK4_dx
ABM4_dx
ABM8_dx
Absolut Error [m]
0.04
0.03
0.02
0.01
0.00
0
10000
20000
30000
40000
50000
Orbit Altitude [km]
Figure 4-15 Absolute Error vs. Orbit Altitude
Figure 4-15 Absolute Error vs. Orbit Altitude shows the absolute position error after one
revolution. A surprising result is that the position error is nearly independent from the method
used but depends linear on orbit altitude. However, this is only true if the optimum step width
has been applied.
Another intresting fact is that the absolute error is not bounded by the local error, which is
kept constant at 1 cm. Thus, it can be said that the numerical accuracy is not the primary
driver for the choice of the integration method. If long arcs have to be integrated without a
discontinuing change in acceleration (e.g. thruster firing), one would choose a high order
multistep method to save computation time. If only short arcs are processed, e.g. because the
ephemeris data is needed every 10, 30 or 60 seconds, lower order algorithms are sufficient.
Furthermore one has to keep in mind that mulistep methods need a starter calculation from a
one-step method. When the orbit integration has to be reinitiated frequently, e.g. because of
orbit manoeuvres (discontinuity in acceleration) or trajectory corrections from the state
estimation process, the Runge-Kutta method will be in operation most of the time.
4.4 Precise Short Term Orbit Representation
In satellite navigation, the position of a satellite is required with a certain accuracy ranging
from a few meters down to decimeter level. To achieve such an accuracy over a long time, a
sophisticated orbit model is required, as has been shown in the preceding sections.
Unfortunately, a user receiver is not equipped with a super computing facility, thus a simpler
orbit representation is required.
R. Wolf
Page 61
Orbit Computation
Inter Satellite Links
The so called broadcast ephemeris message contain the actual parameters of an orbit model,
which is accurate enough over a short period of validity. The parameter model is designed in a
way that it represents only the desired orbit class with a sufficient accuracy over the period of
validity, using only modest computation power. There are various possible models suited for
the broadcast ephemeris message, but they all share some common characteristics:
•
The state prediction requires no other information than included in the navigation
message, or constants which are permanently stored in the receiver and need not to be
updated.
•
The user-receiver has to compute the positions of maybe up to 12 satellites. It is obvious
that this should require only modest computational effort. That means, the state
calculation has to be done using a geometric model(like the GPS broadcast ephemeris) or
the numerical integration of a state vector (like the GLONASS broadcast ephemeris) using
a simple force model.
•
The ephemeris are given in Earth centred Earth fixed co-ordinates. Otherwise the user
would have to compute all the earth rotation parameters (precession, nutation, polar
motion, sidereal time).
The broadcast ephemeris are not derived directly from measurements. From the orbit
determination process, the satellites state as well as some physical parameters have been
determined to a certain accuracy. This information is used to extrapolate the satellites state
vector. The computed satellite positions have to be converted into the earth centred earth fixed
coordinate frame. The parameters of that simple, earth fixed broadcast ephemeris model are
adjusted using a least squares estimator so that the position difference between the precise
ephemeris and the broadcast ephemeris becomes minimal over that fit interval. It is obvious
that the derived broadcast ephemeris is only optimal and therefore valid for that specified fit
interval.
Both navigation satellite systems (GPS and GLONASS) provide an additional format of orbit
representation, the almanac. This is an even more simple orbit description, fit over a longer
interval, typically a week. This orbit propagator is only for visibility evaluations, therefore
accuracy lies in the range of several kilometers. Both almanac types consist of a Keplerian
orbit including the secular perturbation due to earth's oblateness.
In the following section, an overview over a few broadcast models is given, to show the
variety of orbit representation possibilities.
Page 62
R. Wolf
Inter Satellite Links
Orbit Computation
4.4.1 GLONASS Broadcast Ephemeris
The GLONASS navigation message consists, besides some other information, of 9 ephemeris
states:
x 0 , y0 , z0
Position in Cartesian ECEF coordinates
x 0 , y 0 , z 0
Velocity in Cartesian ECEF coordinates
DxD Re s , DyD Re s , DzD Re s Residual acceleration over the fit interval, mainly due to lunisolar
attraction, in Cartesian ECEF coordinates
Reference time of ephemeris
t0
A broadcast message as described above, requires a very simple force model, referenced in
the earth fixed frame, which accounts for the following components:
•
central force of earth's gravity
•
dynamic oblateness represented by the C20 coefficient
•
centripetal acceleration introduced by the rotating reference frame
•
Coriolis acceleration introduced by the rotating reference frame
The simplified equations of motion expressed by
dx
dt
dy
dt
dz
dt
dxD
dt
dyD
dt
dzD
dt
Eq. 4.4-1
= xD
= yD
= zD
GMae2
µ
3
= − 3 x + C 20
2
r
r5
GMae2
µ
3
= − 3 y + C 20
2
r
r5
GMae2
µ
3
= − 3 z + C 20
2
r
r5
z2
x1 − 5 2 + ω e2 x + 2ω e yD + DxD Re s
r
z2
y1 − 5 2 + ω e2 y − 2ω e xD + DyD Re s
r
z2
z 3 − 5 2
+ DzD Re s
r
with
ωe = 7.292115 ⋅ 10 −5 s −1
R. Wolf
Angular velocity of Earth's rotation
Page 63
Orbit Computation
Inter Satellite Links
are solved using a fourth order Runge-Kutta algorithm. Note that the integration is performed
in the earth fixed frame, thus, it is not necessary for the user to compute earth rotation
parameters.
The desired position at time t is obtained by integrating from the position at time t0 which is
given in the navigation message. The GLONASS navigation message valid for
t − t 0 ≤ 15 minutes
Eq. 4.4-2
which means, the time of the reference state t0 lies in the middle of the 30 minutes period of
validity.
4.4.1.1
Extended GLONASS Format
It is easy to augment the GLONASS message to enhance accuracy or adapt the message for
more perturbed orbits, simply by allowing the acceleration to vary over time. An extended
GLONASS message using 12 Parameters could look like
X Broadcast = (x 0 , y 0 , z 0 , xD 0 , yD 0 , zD 0 , a x 0 , a y 0 , a z 0 , a x1 , a y1 , a z1 , a x 2 , a y 2 , a z 2 )
Eq. 4.4-3
with the reference position and velocity being the same as in the GLONASS message, and the
constant residual acceleration being replaced by
DxD Re s = a x 0 + a x1 (t − t 0 )
DyD Re s = a y 0 + a y1 (t − t 0 )
Eq. 4.4-4
DzD Re s = a z 0 + a z1 (t − t 0 )
If even more adaptability to perturbations, or simply a longer period of validity is required,
the navigation message could also be extended to 15 Parameters,
X Broadcast = (x 0 , y 0 , z 0 , xD 0 , yD 0 , zD 0 , a x 0 , a y 0 , a z 0 , a x1 , a y1 , a z1 , a x 2 , a y 2 , a z 2 )
Eq. 4.4-5
with the residual acceleration being modelled as a quadratic term.
>x> Re s = a x 0 + a x1 (t − t 0 ) + a x 2 (t − t 0 )2
Eq. 4.4-6
>y> Re s = a y 0 + a y1 (t − t 0 ) + a y 2 (t − t 0 )2
>z> Re s = a z 0 + a z1 (t − t 0 ) + a z 2 (t − t 0 )2
In both cases, the same propagator is used as in the standard GLONASS message.
4.4.2 GPS Broadcast Ephemeris
In contrary to the integrating-a-force-model based GLONASS broadcast ephemeris, the GPS
state propagator consists of a Keplerian orbit propagator accounting for secular and periodic
Page 64
R. Wolf
Inter Satellite Links
Orbit Computation
perturbations. The following 15 ephemeris related parameters are part of the GPS navigation
message.
M0
Mean anomaly at reference time
∆n
Mean motion difference from computed value
e
Eccentricity
Square root of semi-major axis
A
Ω0
Longitude of ascending node of orbital plane at weekly epoch
i0
Inclination angle at reference time
ω
Argument of perigee
OMEGADOT
(=dΩ/dt)
Rate of right ascension
IDOT (=di/dt)
rate of inclination angle
Cuc
Amplitude of the cosine harmonic correction term to the argument
of latitude
Cus
Amplitude of the sine harmonic correction term to the argument of
latitude
Crc
Amplitude of the cosine harmonic correction term to the orbit radius
Crs
Amplitude of the sine harmonic correction term to the orbit radius
Cic
Amplitude of the cosine harmonic correction term to the angle of
inclination
Cis
Amplitude of the sine harmonic correction term to the angle of
inclination
toe
reference time of ephemeris
The following computations are necessary, to derive the satellites position in an earth centred
earth fixed reference frame.
A=
( A)
n0 =
R. Wolf
2
GM
A3
Semi-major axis
Eq. 4.4-7
Computed mean motion
Eq. 4.4-8
Page 65
Orbit Computation
Inter Satellite Links
t k = t − t oe
Time from ephemeris reference epoch Eq. 4.4-9
n = n 0 + ∆n
Corrected mean motion
Eq. 4.4-10
Mk = M0 + n ⋅ tk
Mean anomaly
Eq. 4.4-11
M k = E k − e ⋅ sin E k
Kepler's equation for eccentric
anomaly, solved by iteration
Eq. 4.4-12
True anomaly
Eq. 4.4-13
Eccentric anomaly
Eq. 4.4-14
Φk = νk + ω
Argument of latitude
Eq. 4.4-15
δu k = C us ⋅ sin 2Φ k + C uc ⋅ cos 2Φ k
Argument of latitude correction
Eq. 4.4-16
δrk = C rs ⋅ sin 2Φ k + C rc ⋅ cos 2Φ k
Radius correction
Eq. 4.4-17
δi k = C is ⋅ sin 2Φ k + C ic ⋅ cos 2Φ k
Correction to inclination
Eq. 4.4-18
u k = Φ k + δu k
Corrected argument of latitude
Eq. 4.4-19
rk = A ⋅ (1 − e ⋅ cos E k ) + δrk
Corrected radius
Eq. 4.4-20
i k = i 0 + δi k + IDOT ⋅ t k
Corrected inclination
Eq. 4.4-21
Corrected longitude of ascending
node
Eq. 4.4-22
1 − e 2 sin E
k
ν k = arctan
cos E k − e
e + cos ν k
E k = arccos
1 + e ⋅ cos ν k
D −Ω
D )⋅ t − Ω
D ⋅t
Ω k = Ω 0 + (Ω
E
k
E
oe
x ′k = rk ⋅ cos u k
y′k = rk ⋅ sin u k
x k = x ′k cos Ω k − y′k cos i k sin Ω k
y k = x ′k sin Ω k + y′k cos i k cos Ω k
z k = sin i k
Eq. 4.4-23
Position in orbital plane
Eq. 4.4-24
Position in Earth-Centered-EarthFixed coordinates
This propagator accounts for secular as well periodic perturbations, as can be seen from the
equation. Period of validity is 4 hours.
Page 66
R. Wolf
Inter Satellite Links
Orbit Computation
4.4.3 WAAS GEO Broadcast Ephemeris
The broadcast ephemeris proposed for the GEO's within a SBAS (Space Based Augmentation
System) makes use of the fact that a geostationary satellite nominally is a fixed point in the
sky, with respect to earth. The ephemeris parameters look similar to the GLONASS
navigation message.
x 0 , y0 , z0
Position in Cartesian ECEF co-ordinates
x> 0 , y> 0 , z> 0
Velocity in Cartesian ECEF co-ordinates
>x> 0 , >y> 0 , >z> 0
Acceleration over the fit interval in Cartesian ECEF co-ordinates
t0
Reference time of ephemeris
But unlike the GLONASS propagator, no "earth gravity model" is used to propagate the space
craft position. Instead, a very simple polynomial of second degree is used to account for the
perturbations, as indicated in Eq. 4.4-25.
2
x ( t ) = x 0 + xD 0 ⋅ (t − t 0 ) + 12 DxD ⋅ (t − t 0 )
Eq. 4.4-25
2
y( t ) = y 0 + yD 0 ⋅ (t − t 0 ) + 12 DyD ⋅ (t − t 0 )
2
z( t ) = z 0 + zD 0 ⋅ (t − t 0 ) + 12 DzD ⋅ (t − t 0 )
This propagator is not suited to account for periodic perturbations, thus the period of validity
is limited to a few minutes.
R. Wolf
Page 67
Orbit Computation
Inter Satellite Links
4.4.4 INTELSAT Ephemeris Format
Although the INTELSAT space crafts are communication and not navigation satellites, the
ephemeris representation used is quite interesting. Like in the WAAS GEO ephemeris
message, it makes also use of the unique property of the geostationary orbit. The space craft
motion represented by the following 11 parameters.
LM0
Longitude at reference time
LM1
Rate of change of longitude angle
LM2
Rate of change of longitude drift
LonC
Amplitude of the cosine harmonic correction term to satellites longitude
LonC1
Rate of change of amplitude of the cosine harmonic correction term to
satellites longitude
LonS
Amplitude of the sine harmonic correction term to satellites longitude
LonS1
Rate of change of amplitude of the sine harmonic correction term to
satellites longitude
LatC
Amplitude of the cosine harmonic correction term to satellites latitude
LatC1
Amplitude of the cosine harmonic correction term to satellites latitude
LatS
Amplitude of the cosine harmonic correction term to satellites latitude
LatS1
Amplitude of the cosine harmonic correction term to satellites latitude
toe
reference time of ephemeris
This ephemeris model also uses no "orbit" model, but treats the GEO as a nominally fixed
point, which is subject to secular and periodic perturbations. The following equations are used
to determine the space crafts position.
Lon M ( t ) = LM0 + LM1 ⋅ (t − t 0 ) + LM2 ⋅ (t − t 0 )
Longitude, corrected for
secular perturbations
Eq. 4.4-26
Lon C ( t ) = (LonC + LonC1 ⋅ (t − t 0 )) ⋅ cos(θ)
Harmonic cosine
correction term of
longitude
Eq. 4.4-27
Lon S ( t ) = (LonS + LonS1 ⋅ (t − t 0 )) ⋅ sin(θ)
Harmonic sine correction
term of longitude
Eq. 4.4-28
Lat C ( t ) = (LatC + LatC1 ⋅ (t − t 0 )) ⋅ cos(θ)
Harmonic cosine
Eq. 4.4-29
correction term of latitude
Page 68
2
R. Wolf
Inter Satellite Links
Lat S ( t ) = (LatS + LatS1 ⋅ (t − t 0 )) ⋅ sin(θ)
with
Orbit Computation
Harmonic sine correction
term of latitude
Eq. 4.4-30
θ = ωE ⋅ UTC
being the hour angle. Both, latitude and longitude harmonic corrections, account for periodic
errors with increasing amplitude (see section 4.3-Force Model Errors).
The resulting longitude and latitude of the space craft is obtained by adding all correction of
secular and harmonic terms.
Lon = Lon M + Lon C + Lon S
Eq. 4.4-31
Lat = Lat C + Lat S
Unfortunately, this ephemeris format is not intended to account for radial perturbations
(However it could easily be modified to do so!). For communication purposes like television
broadcast, only elevation and azimuth of the satellite are necessary to align the dish antenna.
But for navigation, the radial component is the most important, due to its large impact on the
ranging error.
Driven by the requirement for accurate pointing instead of accurate ranging, the period of
validity is one week. Nevertheless, the transformation to Cartesian co-ordinates is given
below.
x = R GEO ⋅ cos Lon ⋅ cos Lat
Eq. 4.4-32
y = R GEO ⋅ sin Lon ⋅ cos Lat
z = R GEO ⋅ sin Lat
withRGEO = 42164537 m
R. Wolf
Page 69
Software Description
Inter Satellite Links
5 SOFTWARE DESCRIPTION
Based on the theory given in the preceding chapters, a software package has been
implemented. The intention was to allow the analysis of arbitrary satellite constellations,
ground networks, force models. The main features are given in Table 5-1.
Function / Module
Description
Orbit Simulation
Numerical force model integration
Force Model
Gravity Models
•
Earth's gravity as spherical harmonics expansion
•
Solar- Lunar- and major planets attraction
•
solid earth tides
•
air drag
•
solar radiation pressure
•
Vehicle Thrust (if commanded)
•
EGM-96 (360x360), WGS-84 (180x180)
•
JGM-1(70x70), JGM-2 (70x70), JGM-3(70x70)
GEM-T1 (36x36), GEM-T2 (50x43), GEM-T3 (50x50)
•
GRIM4-S4 (66x66)
Planetary Ephemeris
JPL DE200 files
Integration
•
4th order Runge-Kutta with automated step size control
•
8th order Adams-Bashford-Moulton using fixed step size
Number of Satellites
Not limited
Orbit types
Arbitrary
Main Output
Precise ephemeris represented by a time series of state vectors (position /
velocity)
Orbit Estimation
Measurements
Types
Link Types
Errors Simulation
Page 70
The orbit estimation from simulated measurements using differential
corrections applied to the predicted trajectory
Generated using geometry to "true trajectory", modified by introducing
measurement errors
•
Range
•
Range Rate
•
Ground links
•
Inter satellite links (ISL)
•
Free space attenuation
•
Ionospheric refraction
•
Tropospheric refraction
•
Random clock offset
R. Wolf
Inter Satellite Links
Function / Module
Estimator
Software Description
Description
•
Clock drift
•
Weighted least squares with a priori statistics
•
Real time Kalman filter
•
Batch mode Kalman filter
Predicted Trajectory
Force model integration, used to generate reference trajectory to allow
linearization
"True Trajectory"
Force model integration, but using slightly different force model, used to
derive measurements
Errors Simulation
•
Random walk on solar constant
•
Random walk on air density
•
Deviated harmonic coefficients
Number of Ground
stations
Not limited
Number of links
Not limited
Main Output
•
Covariance of radial / along track / cross track error
•
Instantaneous radial / along track / cross track error
Force Model Errors
Main Output
Broadcast Ephemeris
Main Output
Integrity Analysis
Main Output
Impact analysis of contributing forces by comparing orbits generated using
different force models
•
Root mean square of radial / along track / cross track error
•
Instantaneous radial / along track / cross track error
Least squares fit of a broadcast model over a time series of satellite positions
in earth-centred-earth-fixed co-ordinates
•
Root mean square of radial / along track / cross track error
•
Instantaneous radial / along track / cross track error
•
User Range Error (URE)
A RAIM algorithm is used to compute integrity of one selected satellite for a
given misdetection probability and false alarm rate
•
Minimum detectable bias / protection level
•
Instantaneous radial / along track / cross track error
•
Error detection flag
•
Error isolation flag
•
Type of error identified
Table 5-1 Main Software Features
R. Wolf
Page 71
Software Description
Inter Satellite Links
The following sections contain brief a description of the implementation and functionality of
the main software components. Additionally, equations for some "remaining" topics like
measurement errors and co-ordinate transformation are given.
5.1 Orbit Integration
The orbit integrator has to compute the forces acting on the satellites and conduct a numerical
integration. The forces are fixed in different co-ordinate frames vary with time in an other.
The main force, earth's gravity is fixed with respect to the terrestrial frame, whereas third
body attraction and solar radiation depend on the ephemeris of celestial body which can be
expressed easier in inertial co-ordinates.
The computations are therefore performed in the inertial frame ECI-J2000. The acceleration
of the rotating earth gravity field has therefore to be converted into inertial referenced
acceleration for each computation epoch. The transformation matrix from the terrestrial frame
to the inertial frame consists of four elements, sidereal angle (hour angle), precession,
nutation and polar motion. Only the first three can be computed, although with some
computational effort, directly. Polar motion , as well as the true length of day, has a random
component and is predicted by the IERS (Bulletin A) and updated from measurements.
Normally these earth rotation parameters are estimated within the orbit determination process.
The software however does not account for polar motion and true length of day up to now, but
implementation is planned for the near future.
The following figure shows the flow chart of an orbit propagator. Starting from a satellite
position and velocity at a given time, the contributing forces are computed sequentially and
integrated numerically to derive the state at the next epoch. This process is repeated, thus a
time series of satellite states is generated.
Page 72
R. Wolf
Inter Satellite Links
Software Description
Initial Values
Triggered Propagator
Reset
Transformation to ECI-J2000
Loop repeated n times
Solar, Lunar and Planetary
Ephemeris Database
Computation of SV-Sun
Vector (Interpolation)
Computation of SV-Moon
Vector (Interpolation)
Eclipse
Computation of Solar
Pressure
Computation of Solar
Attraction
Computation of Lunar
Attraction
Computation of Greenwich
Apparent Sidereal Time
Transformation of Position
Vector to ECEF Coordinates
Computation of Geopotential
Forces
Transformation to
ECI-J2000
Propulsion
Satellite Platform
Propulsive Forces
Numerical Integration
(nth Order Runge-Kutta)
Predicted Satellite State Vector
Output
Figure 5-1 Orbit Integration Process
R. Wolf
Page 73
Software Description
Inter Satellite Links
5.2 Real time State Estimation
The real time state estimator requires linearised equations for the state dynamics and the
observations. Orbit propagation is a highly non linear process, as well as slant ranges are non
linear observations. Thus, a non linear predictor is needed to derive approximate values for
the state and the predicted measurements. This task is performed by the orbit propagator
described above.
No
Orbit Propagator
∆XUpdate > max
Yes
Filter / Propagator Reset
XInitial = X0 + ∆XUpdate
∆X = 0
Predicted Satellite State
Vector X0
Computation of linearized
Transition Matrix Φ
Satellite Platform
Transition of Error State
Vector ∆XPredicted
Propulsion ?
Computation of linearized
Measurement Matrix H
Yes
Covariance Propagation
Covariance Matrix P
Computation of Predicted
Measurement z0
Predicted Residual
r =∆
∆x - H∆
∆z
Measurement Processor
Measurement z
Variance
Target ID
Additional Noise
Accounting for Propulsion
Uncertainties
Transformation to ECI-J2000
Coordinates (if necessary)
Satellite Ephemeris/
Station Co-ordinates
Database
Kalman Gain Matrix K
Measurement Update
Updated Error State
Vector
Updated Covariance
Matrix
PU
Output: Updated Satellite
State
X = X0 + ∆XUpdated
d
Figure 5-2 State Estimation Process
Page 74
R. Wolf
Inter Satellite Links
Software Description
5.3 Measurement Simulation
Measurements are computed from the geometric range or range rate using the true satellite
orbits and adding delays from the signal path, clock offsets and random errors. The computed
range is also used to derive the free distance attenuation of the signals. The following
measurement equation indicates the considered components of a pseudo range measurement.
(
)
PR 0 = ρ Geometric + c ⋅ δTSat − δTGround / Sat 2 + δ iono + δ Tropo + δ Multipath + ε noise
Eq. 5.3-1
The largest part is represented by the true geometric range. The delays, which are scaled with
the speed of light to obtain a distance, are
•
Satellite clock offset
•
Ground station clock offset or 2nd satellite clock offset
•
Ionospheric delay
•
Tropospheric delay
•
Multipath
The two clock offsets are generated by initialising the clock offset variable of each satellite
and ground station using a random number with
•
3 milliseconds standard deviation for the satellite clocks.
•
100 nanoseconds standard deviation for the ground station clocks
The errors introduced by the signal propagation path are considered by computing
tropospheric and ionospheric delays from models. The last error contributor is the thermal
noise, which has been computed using the range dependent free distance attenuation.
Under the assumption, that tropospheric and ionospheric delays can be removed to a certain
degree using models, only the residual errors of these contributor are considered in the
measurement noise, as indicated in the following equation.
(
2
σ 2Range = σ Thermal
+ 0.2 ⋅ δ Tropo
)2 + (0.5 ⋅ ∆ Iono )2 + δ 2Multipath
Eq. 5.3-2
The simulated range measurements is then obtained by
PR = PR 0 + RANDOM⋅ σ Range
Eq. 5.3-3
The error of a range rate measurement has been assumed to depend only on the thermal noise.
2
2
σ Range
Rate = σ Thermal
Eq. 5.3-4
The measurement errors had been obtained by
PRD = PRD 0 + RANDOM⋅ σ Range Rate
Eq. 5.3-5
where
R. Wolf
Page 75
Software Description
Inter Satellite Links
PR
Range measurement
PR0
Real range
PRD
Range rate measurement
PRD 0
Real range rate
and RANDOM is a function generating a normally distributed random number with zero
mean and variance 1.
5.3.1 Thermal Noise
An important number in a link budget calculation is the signal to noise ratio expressed by
(
C
) dB− Hz = PT + G T + A T + A D + G R + A R + A S − Tsys dB − k
N0
dB
Eq. 5.3-6
with
k Boltzmann's constant k=1.38 × 10⁻²³ [Ws / 0K]
TSYS
Equivalent noise temperature of the system
AD
Free space attenuation
GT
Transmit antenna gain in main direction; f(frequency, beamwidth)
GR
Receiver antenna gain in main direction; f(frequency, beamwidth)
AS
System losses (including cable losses, the A/D converter, signal processing
losses)
AT
Pointing loss of the transmit antenna
AR
Pointing loss of the receive antenna
PT Antenna transmitted power
The equation above, as well as the following equation concerning link budget can be found
for instance in the "Blue Books" [BLU-96] by Parkinson / Spilker. Most of the parameters in
the equation above are a function of the link technology used, e.g. power, antenna pattern,
frequency etc, and therefore not directly dependent of the link geometry, i.e. distance. The
only directly geometry dependent component is the free space attenuation given by
(A D ) dB = 20 ⋅ log 10 (
λ
)
4πd
Eq. 5.3-7
The carrier to noise ratio can therefore coarsely be regarded as a function of the inverse
square of the geometric distance.
C
1
≈ f 2
N0
d
Eq. 5.3-8
Code range, phase and doppler measurements are strongly dependent of the carrier to noise
ratio, as indicated in equation 5.3-9, 5.3-10 and 5.3-11.
Page 76
R. Wolf
Inter Satellite Links
Software Description
Code Range measurement precision performance of a DLL:
στ = ±D
Eq. 5.3-9
dBL
2
(1 +
)
2C / N 0
( C / N 0 )Ti
Phase measurement precision performance of a PLL:
σ τ = ±(
Eq. 5.3-10
BLp
λ
1
)
(1 +
)
2π C / N 0
2( C / N 0 )Ti
Doppler measurement precision performance:
θ Doppler =
ωL ωL
2 2ξ
Eq. 5.3-11
No
C
with
Ti Integration time
C/N0
Carrier noise density
D Chip length
BL BLP Noise bandwidth of tracking loop
λ
Wavelength of carrier
ωL Natural angle frequency of a PLL
ζ Attenuation factor of a loop filter
d Early-late spacing of DLL (d=0.01 ... 1)
From the equations above, generally a quadratic relationship between the distance and the
measurement noise can be derived for code and phase measurements. In the following it will
be shown that for realistic values the relationship is nearly linear.
Let us assume some typical values for a GPS like scenario:
R. Wolf
Chip length D
300 m
Carrier wave length λ
19 cm
Bandwidth of phase lock loop (PLL) BLp
20 Hz
Bandwidth of delay lock loop (DLL) BL
1 Hz
Early late spacing of DLL d
0.1
Integration time TI
20 ms
Page 77
Software Description
Inter Satellite Links
Assuming C /N0 to be - for a given link technique - approximately a function of the inverse
square of the geometric distance (equation 5.3-8), we obtain
Eq. 5.3-12
K C / N0
C
=
N0
d2
Where the parameter KC/N0 still has to be determined. By assuming a (rather pessimistic) C
/N0 of 30 dBHz for a GPS satellite close to the horizon (elevation ~ 0°) which would have a
range of approximately 25 000 km, we obtain the link budget dependent factor KC/N0 by
C
N0
dB,Hz
C
= 30dB Hz = 10 ⋅ log10
N0
Eq. 5.3-13
K C / N0
C
= 10 3 =
N0
(25000km)2
K C / N0 = 6.25 ⋅ 1017
5.3-9 and 5.3-10 have been evaluated using the parameter values indicated above, but with
three different integration time constants TI. The results has been plotted. Figure 5-3 and 5-4
show the results for the code range and carrier noise.
8
Ti = 2 ms
Ti = 20 ms
Ti = 200 ms
D = 30 m
Code Noise [m]
6
4
2
0
0
10000
20000
30000
40000
Distance [km]
Figure 5-3 Code Noise vs. Range
Page 78
R. Wolf
Inter Satellite Links
Software Description
The relationship between code noise and range is approximately, but not exactly linear, as can
be seen in the figure above. The integration time of 20 ms has been chose as a typical value
for a GPS user receiver. Using only ten times higher integration time for example would lead
to an even more linear relationship between code noise and distance. The integration time of a
DORIS receiver, for example is around 10 seconds. Presuming a sufficiently long integration
time Ti, the receiver noise of a code range measurement, a phase measurement or a Doppler
measurement is indirect proportional to the range. The same could be done by decreasing chip
length, which would also directly enhance measurement precision.
The next figure shows the dependence of carrier noise and range. This can be regarded as a
nearly linear function of the geometric distance.
0.010
Ti = 2 ms
Ti = 20 ms
Ti = 200 ms
Carrier Noise [m]
0.008
0.006
0.004
0.002
0.000
0
10000
20000
30000
40000
Distance [km]
Figure 5-4 Carrier Noise vs. Range
For system level studies, it is therefore accurate enough to model the range measurement
accuracy using linear relationship between distance and measurement precision due to
thermal noise given by
σR ≈ K R ⋅ d
Eq. 5.3-14
with
d
R. Wolf
Distance, Range
Page 79
Software Description
Inter Satellite Links
KR Link technology factor for ranging noise, can be obtained from
KR = D
k Boltz N
d
1
BL
2
A Rx A Tx A Sys G Rx G Tx PT 4πfc
Eq. 5.3-15
The exact quantification of the link technology factor KR is subject to link budget design, but
in the frame of an inter satellite study conducted for ESA, it has been shown that
KR ~ 1 x 10 –9 m/m
can easily be achieved and has been found to be a reasonable value for the simulations in this
thesis. This leads to a ranging precision of approximately 2.5 cm due to thermal noise for a
25000 km range. This can be regarded as a realistic value for a carrier smoothed code range.
To derive the precision of a range rate measurement, we start with the formulation of the
Doppler shift and difference the range rate with respect to the Doppler shift.
R
f Rx = f Tx ⋅ 1 +
c
∆f = (f Rx − f Tx ) = f Tx ⋅
Eq. 5.3-16
R
=θ
c
c
R = θ ⋅
f Tx
∂R
c
=
∂θ f Tx
We can therefore rewrite 5.3-11 to
σ RR =
c ωL ωL
∂R
⋅ θ Doppler =
f Tx 2 2ξ
∂θ
No
C
Eq. 5.3-17
The precision of a Doppler measurement is strongly related to the phase measurement. Thus
we assume also a linear relationship between distance and range rate accuracy.
σ RR ≈ K RR ⋅ d
Eq. 5.3-18
From the DORIS system specification we obtain a value of 0.3 mm/s for low earth orbits.
Thus we can find a scale factor of approximately
KRR = 2 x 10⁻¹⁰ m/s
to be a representative. Figure 5-5 shows the range rate precision up to a distance of 42 000
km.
Page 80
R. Wolf
Inter Satellite Links
Software Description
0.010
Range Rate Noise [m/s]
0.008
0.006
0.004
0.002
0.000
0
10000
20000
30000
40000
Distance [km]
Figure 5-5 Range Rate Noise vs. Distance
5.3.2 Ionospheric Model
Radio signal travelling through the ionosphere are subject to refraction. The degree of
refraction depends on the frequency, and due to a non uniform distribution of the electron
density, also on the signal path. Ionospheric delay is obtained by integrating the Total
Electron Content (TEC) along the signal path. A good approximation of the nominal TEC
distribution is the Chapman profile shown below.
R. Wolf
Page 81
Software Description
Inter Satellite Links
Electron Density Distribution
1.00E+13
1.00E+12
-3
ne [m ]
1.00E+11
1.00E+10
1.00E+09
1.00E+08
38450
36850
35250
33650
32050
30450
28850
27250
25650
24050
22450
20850
19250
17650
16050
14450
12850
9650
11250
8050
6450
4850
3250
50
1650
1.00E+07
Altitude [km]
Figure 5-6 Chapman Profile of the Ionosphere
It shows that the ionospheric density has a large maximum at approximately 350 – 400 km.
Additional to this nominal shape, the ionosphere is subject to the local time (i.e. the sun
angle), disturbances, ionospheric storms and the solar cycle. For the simulations in this thesis,
a simple model for the ionosphere had to be sufficient. To account for the nominal shape of
the ionosphere, the Chapman profile has been approximated by three ionospheric "layers",
with linear electron density distribution.
TECi = a i ⋅ r + b i
Eq. 5.3-19
with
i=0
from 50 - 380 km altitude
i=1
for altitudes between 380 and 1000 km
i=2
for altitudes between 1000 and 30000 km
This linear approximation has the advantage that the electron content can be integrated
piecewise analytically, only as a function of the known starting and end points of the signal
path, thus increasing computation speed compared to a numerical integration of the curved
profile.
The ionospheric delay is then obtained from
Page 82
R. Wolf
Inter Satellite Links
∆ IO =
40.3
f
2
Software Description
⋅ TEC
Eq. 5.3-20
whith
TEC
f
Total Electron Content along the signal path
Frequency
The error of the model has been assumed to be 50%. This value is added to the observation
variance.
5.3.3 Tropospheric Model
A radio signal is also subject to tropospheric refraction, causing a delay in the signal reception
time, similar to the ionospheric delay, but much less in magnitude. There are several
tropospheric models in use. The one utilised in the simulations is the Saastamionen
tropospheric model [HWL-94].
∆ Tr =
0.002277
1255
π
⋅ (p + (
+ 0.05) ⋅ e - tan( - δ))
π
T
2
cos( - δ)
2
Eq. 5.3-21
with
p
atmospheric pressure
T
Temperature
e
Partial pressure of water vapour
δ
Elevation
It can be assumed as sufficient to take average values for p and T and e. The residual error has
been assumed as 20 % of the result from above equation.
5.3.4 Multipath Simulation
Multipath is not easy to model, but can be assumed as being a more or less slowly varying
bias. It was simulated using the function
y = e A⋅sin ωt
Eq. 5.3-22
which resembles a multipath figure with a slowly varying geometry. All delays and errors
have been added to the measurements as biases.
R. Wolf
Page 83
Software Description
Inter Satellite Links
5.4 Co-ordinate Transformation
In an orbit simulation / orbit determination process a lot of information will be needed in
different reference frames. For example, the satellites equations of motion are described in an
inertial frame, while the coordinates of a tracking station or user will be given in an earthcentred-earth-fixed frame. Therefore it will be necessary to transform force, velocity and
position vectors from one frame to another.
This is done using rotation matrices. To perform a complete transformation from inertial (ECI
J-2000) to earth-centred-earth-fixed (ECEF), one has to account for four different effects.
•
Precession
•
Nutation
•
Polar Motion
•
Sidereal Time
Eq. 5.4-1
R ECEF
ECI = R PM ⋅ R S ⋅ R N ⋅ R Pr
Note that a matrix multiplication is non commutative, but orthogonal rotation matrices have
the following property
ECEF
R −1 = R T ⇒ R ECI
ECEF = R ECI
Eq. 5.4-2
T
i.e. transformation matrix for the backward transformation is simply obtained from the
transponed. The following equations are found in [HWL-94] or in the Astronomical Almanac.
5.4.1 Precession
The transformation matrix accounting for precession is given by
cos z cos ϑ cos ζ
− sin z sin ζ
R P = sin z cos ϑ cos ζ
+ cos z sin ζ
sin ϑ cos ζ
− cos z cos ϑ sin ζ − cos z sin ϑ
− sin z cos ζ
− sin z cos ϑ sin ζ − sin z sin ϑ
+ cos z cos ζ
cos ϑ
− sin ϑ sin ζ
Eq. 5.4-3
where the necessary Euler angles are derived from
ζ = 2306".2181 ⋅ T + 0".30188 ⋅ T 2 + 0".017998 ⋅ T 3
2
z = 2306".2181 ⋅ T + 1".09468 ⋅ T + 0".018203 ⋅ T
Eq. 5.4-4
3
ϑ = 2004".3109 ⋅ T − 0".42665 ⋅ T 2 − 0".041833 ⋅ T 3
T is the time interval between the observation date and the J2000.0 standard epoch, expressed
in Julian centuries. One Julian century has 36525 days. Note that the transformation angles
ζ,ϑ,z are given in arc seconds. They have to be scaled radians prior to further use in equation
5.4-3.
Page 84
R. Wolf
Inter Satellite Links
Software Description
5.4.2 Nutation
The nutation matrix is given by
RN
− ∆ψ cos ε − ∆ψ sin ε
1
= ∆ψ cos ε
1
− ∆ε
∆ψ sin ε
∆ε
1
Eq. 5.4-5
with the mean obliquity of the rotation axis given by
ε = 23°26'21".448 − 46".8150 ⋅ T − 0".00059 ⋅ T 2 + 0".001813 ⋅ T 3
Eq. 5.4-6
where
T
Time interval between the observation epoch and the J2000.0 standard epoch
∆ψ Nutation parameter in longitude
∆ε Nutation parameter in obliquity
The nutation parameters ∆ψ and ∆ε can be obtained from a series expansion, which can be
found in [ITN-96]. A drawback the series expansion method is that a lot of trigonometric
functions have to be evaluated, causing a high computation load. Fortunately, the nutation
parameters are available as pre-computed values in the JPL DE200 ephemeris files.
5.4.3 Polar Motion
The transformation matrix accounting for polar motion can be expressed by
RN
1 0 xP
= 0 1 − y P
− x P y P 1
Eq. 5.4-7
The values for co-ordinates of the earth pole are available from the IERS (International Earth
Rotation Service), either as predicted values in the Bulletin A, or as post processed values in
the Bulletin B. In precise orbit determination, these parameters are estimated, using IERS
Bulletin A as predicted values.
5.4.4 Earth Rotation (Hour Angle)
While the time derived from earth's revolution is defined from one midday to the next and
indicated as Universal Time (UT), earth's rotation with respect to an inertial frame is obtained
from the sidereal time. The so called hour angle is related to UT1, that is UT corrected for
polar motion, by
Θ 0 = 1.0027379093 ⋅ UT1 + ϑ 0 + ∆ψ cos ε
R. Wolf
Eq. 5.4-8
Page 85
Software Description
Inter Satellite Links
The first term accounts for the scale factor between synodal and sidereal rotation period. The
second term represents the actual sidereal time at the Greenwich meridian and is computed
using the following formulation
ϑ 0 = 24110.54841 + 8640184.812866 ⋅ T0 + 0.093104 ⋅ T02 − 6.2 ⋅ 10 −6 ⋅ T03
Eq. 5.4-9
where ϑ0 is in seconds. T0 is the interval between the standard epoch of J2000 and date of
observation at 0h UT.
The third term accounts for nutation. While UT1 is a continuos time scale, coupled with
earth's rotation, Universal Time Coordinated (UTC) is a realisation of UT1 using atomic
clocks. The relationship between UT1 and UTC is expressed by
UT1 = UTC + dUT1
Eq. 5.4-10
The quantity dUT1 has an absolute value of less than 1 second and is determined by the IERS.
If dUT1 gets larger than 0.9 seconds, a leap second is added to UTC.
Page 86
R. Wolf
Inter Satellite Links
Software Description
5.5 Broadcast Ephemeris
The broadcast ephemeris of a satellite is not obtained directly from the observations, but
adjusted to the position vectors within a specified interval, i.e. the period of validity. The
position vectors have been derived by propagating the satellites state from a known state
forward. This "known state" can be a deterministic initial state, if it is derived from
simulation, or the best estimate at a certain time, derived from measurements. The latter
would be the case in an operational satellite navigation system.
5.5.1 Adjustment of the Broadcast Message
The broadcast message has to be adjusted to the precise ephemeris, determined and predicted
by the orbit estimation process. The "observations" used to feed the adjustment process, are a
time series of precise ephemeris position vectors. Figure 5-7 shows the basic adjustment
process.
Precise Propagator
=>Positions
BCE Propagator
=> Positions
+
-
Least Squares
Adjustment
Compute Derivatives
New State for
BCE-Propagator
Position
Error
No
Yes
BCE Message valid
for fit interval
Figure 5-7 Broadcast Message Adjustment
R. Wolf
Page 87
Software Description
Inter Satellite Links
5.5.2 Ephemeris Contribution to URE
In a satellite navigation application, an important quantity is the range error, which the user
will experience. While the user range error (URE) is composed of many contributors, here
only the ephemeris contribution will be addressed. The contribution of the (broadcast)
ephemeris it self can be divided into three sub-contributors:
•
orbit determination error
•
orbit propagation error
•
broadcast model fit error
The RMS error of the broadcast ephemeris is component-wise computed using the following
equations.
σ radial =
σ along =
σ cross =
∑ ((x
Broadcast
− x True ) ⋅ e radial )
2
Eq. 5.5-1
n
∑ ((x
n
− x True ) ⋅ e along )
2
Broadcast
n
n
∑ ((x
Broadcast
− x True ) ⋅ e cross )
2
n
n
with
eradial
Unit vector in radial direction
ealong
Unit vector in along track direction
ecross
Unit vector in cross track direction
Using these error components, the URE can be computed under the (justified) assumption that
the worst URE is obtained from a satellite at nearly zero elevation.
(
)
2
2
URE = σ 2radial ⋅ cos α + σ along
+ σ cross
⋅ sin α
Eq. 5.5-2
where
α Angle between the satellites radius vector and the local horizontal plane of an observer,
which is not the elevation.
Page 88
R. Wolf
Inter Satellite Links
Software Description
5.6 Autonomous Integrity Monitoring
Another feature of the software package is the simulation of an onboard processor, using
onboard measurements from ground links and inter satellite links to evaluate the integrity of
its ephemeris and clock states. One investigated approach utilises a RAIM (Receiver
Autonomous Integrity Monitoring) algorithm. RAIM algorithms are well known in the GPS
user (receiver) domain. They basically work on the sample variance of the observation
residuals, as well as on the observation matrix, containing the unit vectors of the line-of-sights
and measurement variances. The following figure shows the flow chart of the integrity
monitoring.
Ground Link
Propagator
=> Own Position
LOS Unit Vectors,
Predicted
Measurements
ISL
Data Base
=> Station Position
Propagator
=> Target Satellite
RAIM Algorithm
No
Available ?
Yes
No
Non Integrity Case
Fault
Integrity OK
Yes
No
Fault
Clock / Ephemeris
Yes
Single Ground Link / ISL
Figure 5-8 Integrity Processing Check
Most RAIM algorithms check the sample variance against a protection level, computed from
the observation matrix. If the protection level is exceeded, one measurement after the other is
removed, and the check is repeated with n-1 observations. Therefore a faulty measurement
can be isolated, if there is enough redundancy in the measurements.
The mathematical formulation of the fault detection (FD) / and isolation (FDI) problem for
satellite based integrity monitoring is generally given as follows. If it is assumed that no more
R. Wolf
Page 89
Software Description
Inter Satellite Links
than one error has occurred and if at a given point of time m (m > 4 for FD and m > 5 for FDI)
range type measurements are available, then linearization yields the linear model
y = Gx + ε
Eq. 5.6-1
But what, if no measurement is faulty but the ephemeris or clock state? To allow the isolation
of the satellites own faulty clock or ephemeris, these parameters are introduced as pseudo
observations and the above equation replaced by
y* = G * ⋅x + ε ∗
Eq. 5.6-2
with
e TR
0
T
0
e AT
y* = 0 , G* = e TCT
T
0
0
yM
G
0
0
0
1
g
and
εR
ε
AT
ε ∗ = ε CT
εC
εM
Eq. 5.6-3
and
e TR , e TAT , e TCT
unit vector in radial, along track and cross track direction
The residuals are given as zero, i.e. "no ephemeris fault" and "no clock fault". The RAIM
algorithm is now capable of removing the bad assumption of "no radial error" for example, if
the removal of this row in the system of observation equations minimises the sample variance
of residuals.
A major draw back of that kind of snapshot algorithm based on the sample variance is the
need for a sophisticated pre-processing of the raw data. The sample variance taken from the
raw measurements is still too noisy, thus leading to lots of false alarms.
Another possible way of monitoring the integrity of a satellites position and clock is by
separating satellite dynamics / errors / and observation noise by their dynamic behaviour.
This can be achieved using the Kalman filter with the following state vector
∆x
∆y
∆z
∆T
x=
∆x
∆y
∆z
∆T
Eq. 5.6-4
which is kept very adaptive by adding high process noise. The Kalman filter is then inert with
respect to noise, but reacts immediately on real errors. The dynamic model which has been
Page 90
R. Wolf
Inter Satellite Links
Software Description
implemented and used successfully assumes the errors in x-y-z direction (ECEF reference
frame) as well as the satellite clock to be composed of a step and a ramp, expressed by to the
following transition matrix:
1
0
0
0
Φ=
0
0
0
0
0 0 0 1 0 0 0
1 0 0 0 1 0 0
0 1 0 0 0 1 0
0 0 1 0 0 0 1
0 0 0 1 0 0 0
0 0 0 0 1 0 0
0 0 0 0 0 1 0
0 0 0 0 0 0 1
The observation matrix is given by
1
0
H=
0
0
0 0 0 0 0 0 0
1 0 0 0 0 0 0
0 1 0 0 0 0 0
0 0 1 0 0 0 0
Note that this dynamic system is very close to the one used to estimate the orbit corrections,
but much less smoothing character. Moreover, the same filter tuning cannot be used for
integrity monitoring and orbit estimation. This approach is more suited for onboard
processing and therefore elaborated in more detail in chapter 7.
R. Wolf
Page 91
Simulations and Results
Inter Satellite Links
6 SIMULATION AND RESULTS
Several simulations have been performed to assess the achievable orbit determination
accuracy, varying in
•
Types of orbits and constellation
•
Ground network
•
Observation types, i.e. ground based only or ground and intersatellite links.
This chapter gives an overview of the analysed scenarios, as well as the results.
6.1
Constellations, Ground Networks and Simulation Scenarios
6.1.1 Constellations
Most of the constellation are so called Walker constellations, characterised by three numbers
T/P/F
where
T
Total number of satellites
P
Number of orbit planes
F
Factor of pattern unit (PU = 360°/T), to obtain phase difference between
satellites on adjacent orbit planes
The following equations hold two obtain the orbital parameters for each satellite.
Satellite spacing:
360°
⋅P
T
Orbit plane spacing:
360°
P
Phase difference between adjacent planes:
360°
⋅F
T
The phase difference has to be interpreted the following way: Assuming a phase difference of
30 ° and a satellite on one orbit plane is passing his ascending node (i.e. mean anomaly = 0°),
the next satellite on the right hand adjacent plane is already ahead in mean anomaly by 30°.
Theses Walker constellations are a good starting point for constellation analysis, because they
provide reasonable earth coverage with direct computable satellite orbit parameters. Note that
these constellations are reasonable, but not optimal for satellite navigation systems. Walker
constellation have one inherent draw back, due to their symmetry. An optimised constellation,
like the today's GPS constellation has more or less evolved from a 24/6/1 Walker
constellation, but the satellites and orbit planes are not evenly spaced anymore.
Page 92
R. Wolf
Inter Satellite Links
6.1.1.1
Simulations and Results
Optimized GPS Constellation
The GPS constellation as been analysed to obtain a reference for possible GNSS 2
constellations. The following picture shows the ground tracks, as well as the locations of the
5 monitoring stations of the OCS.
Figure 6-1 Ground Tracks of Optimized GPS constellation
The next picture shows the minimum visibility, i.e. number of simultaneous satellites over a
period of 24 hours. It can be seen, that the minimum required number of 4 satellites is assured
world wide. The following table shows the orbital parameters of the space vehicles. These
have been take from [MOPS-98]. The satellite slots and the orbital planes are not evenly
spaced, as would be in Walker constellation.
R. Wolf
Page 93
Simulations and Results
Inter Satellite Links
Figure 6-2 Visibility of Optimized GPS Constellation over 24 h
S/V
1
2
3
4
5
6
7
8
9
10
11
12
13
14
15
16
17
18
19
20
21
22
23
24
Treference
1. July 1993 00:00:00
1. July 1993 00:00:00
1. July 1993 00:00:00
1. July 1993 00:00:00
1. July 1993 00:00:00
1. July 1993 00:00:00
1. July 1993 00:00:00
1. July 1993 00:00:00
1. July 1993 00:00:00
1. July 1993 00:00:00
1. July 1993 00:00:00
1. July 1993 00:00:00
1. July 1993 00:00:00
1. July 1993 00:00:00
1. July 1993 00:00:00
1. July 1993 00:00:00
1. July 1993 00:00:00
1. July 1993 00:00:00
1. July 1993 00:00:00
1. July 1993 00:00:00
1. July 1993 00:00:00
1. July 1993 00:00:00
1. July 1993 00:00:00
1. July 1993 00:00:00
a
26560 km
26560 km
26560 km
26560 km
26560 km
26560 km
26560 km
26560 km
26560 km
26560 km
26560 km
26560 km
26560 km
26560 km
26560 km
26560 km
26560 km
26560 km
26560 km
26560 km
26560 km
26560 km
26560 km
26560 km
ε
0
0
0
0
0
0
0
0
0
0
0
0
0
0
0
0
0
0
0
0
0
0
0
0
i
55
55
55
55
55
55
55
55
55
55
55
55
55
55
55
55
55
55
55
55
55
55
55
55
Ω
272.85
272.85
272.85
272.85
332.85
332.85
332.85
332.85
32.85
32.85
32.85
32.85
92.85
92.85
92.85
92.85
152.85
152.85
152.85
152.85
212.85
212.85
212.85
212.85
ω
0
0
0
0
0
0
0
0
0
0
0
0
0
0
0
0
0
0
0
0
0
0
0
0
ϕ
268.13
161.79
11.68
41.81
80.96
173.34
309.98
204.38
111.88
11.80
339.67
241.56
135.23
265.45
35.16
167.36
197.05
302.60
333.69
66.07
238.89
345.23
105.21
135.35
Table 6-1 Optimized GPS Constellation
Page 94
R. Wolf
Inter Satellite Links
6.1.1.2
Simulations and Results
IGSO Walker Constellation
The next analysed constellation is a 18 / 6 / 2 Walker constellation with 55 ° inclination. This
means
•
18 satellites total in the constellation
•
6 orbital planes, with the ascending nodes spaced by 60°
•
3 satellites per plane, spaced in mean anomaly by 120°
•
The phase difference adjacent planes is 40°
The orbit altitude is fixed by selecting the orbit class IGSO, which means Inclined GeoSynchronous Orbit. Due to their orbital period of 23 hours 56 minutes (sidereal day), they are
synchronised with earth's rotation rate. At their ascending node, they cross the equator at the
same point every time, leading to the characteristic "8 shape" of the ground track.
A special case of this orbit class is the Geo Stationary Orbit (GEO) which remains as a fixed
point with respect to an earth fixed reference frame. The following picture shows the ground
tracks, as well as the ground station locations of a " custom global network" used in this
scenario.
Figure 6-3 Ground Tracks of IGSO Walker Constellation
The following picture shows the minimum visibility of this constellation over a period of 24
hours. Although only 18 satellites are present in this constellation, it provides a good
coverage. There are always more than 4 satellites visible.
R. Wolf
Page 95
Simulations and Results
Inter Satellite Links
Figure 6-4 Visibility of IGSO Walker Constellation
Page 96
R. Wolf
Inter Satellite Links
6.1.1.3
Simulations and Results
IGSO on three Loops
Another constellation which ahs been favoured by the ESA as a possible constellation for
GNSS 2 is the following one: 18 satellites are placed on orbital planes that way, that the
longitude of their ascending nodes (not right ascension) are located at 10°E / 110°W / 130°E
over the equator. IGSO's share the same ground tracks, is the spacing of their orbit planes is
equal to their spacing in mean anomaly.
6 space crafts orbit on 3 loops over Japan, Europe / Africa and North America / South
Pacific. The inclination is 70°. The following picture shows the satellites on their common
ground tracks. The ground track locations shown are that of the custom global network.
Figure 6-5 Ground Tracks of IGSO Constellation "on three Loops"
This constellation also provides a reasonable coverage, as can be seen in the following
picture. A visibility of five or more S/C is ensured globally.
R. Wolf
Page 97
Simulations and Results
Inter Satellite Links
Figure 6-6 Visibility of IGSO Constellation "on three Loops"
6.1.1.4
GEO / IGSO
The next constellation is a mixed one. It consists of
•
9 / 3 / 1 Walker Constellation of IGSO's with Longitude of ascending nodes at 10° E /
130° E / 110°W
• 9 GEO's, longitude of ascending nodes evenly separated by 40° beginning at 30° E.
The following two picture show the ground tracks and the minimum visibility over a period of
24 hours.
Page 98
R. Wolf
Inter Satellite Links
Simulations and Results
Figure 6-7 Ground Tracks of GEO - IGSO Constellation
Figure 6-8 Visibility of GEO – IGSO Constellation
The GEO's are not visible ate very high latitude, therefore the coverage at the poles is
insufficient for navigation purposes. Besides that fact of latitude restriction, the coverage over
the equator and mid latitudes is reasonable.
R. Wolf
Page 99
Simulations and Results
6.1.1.5
Inter Satellite Links
Pure LEO Constellation
The next constellation is a pure 1250 km LEO constellation, with a total of 81 S/V at 9 orbit
planes with 1 pattern unit phase difference between adjacent planes. All orbit planes have a
55° inclination. The following picture shows the ground tracks of the satellites, as well as the
locations of the DORIS network.
Figure 6-9 Ground Tracks of LEO Constellation
The next picture shows the earth coverage of such a constellation. Due to the low orbit
altitude navigation service can be provided only up to ~ 65 ° North / South.
Page 100
R. Wolf
Inter Satellite Links
Simulations and Results
Figure 6-10 Visibility of LEO Constellation
It is clear that building a navigation constellation using satellites at low Earth orbits would
require a large number of space crafts. This constellation here with 81 space vehicles can be
regarded as the minimum.
6.1.1.6
GEO / LEO
To overcome the bad global coverage of a pure LEO constellation, the next constellation
introduces some high altitude satellites in addition to the LEOs. The LEO part is a 72 / 8 / 2
Walker constellation with an orbit altitude of 1250 km and 55° inclination. In addition, there
are 9 GEOs, evenly spaced by 40 °, starting at 10°E. The following picture shows ground
tracks and S/V positions, as well as the station locations of the DORIS network.
R. Wolf
Page 101
Simulations and Results
Inter Satellite Links
Figure 6-11 Ground Tracks of LEO Constellation
The coverage of such a constellation is much better than that of the pure LEO constellation,
due to widely visible GEOs. Nevertheless, the pole regions are also uncovered, because the
GEO have a 0° inclination.
Figure 6-12 Visibility of LEO – GEO Constellation
Page 102
R. Wolf
Inter Satellite Links
6.1.1.7
Simulations and Results
Galileo 1 (Pure MEO)
The future GNSS 2, as planned by ESA, is named Galileo. As far as the orbits are concerned,
two options have been chosen, both medium altitude earth orbits (MEO) with a orbit period
around 12 hours. This is very similar to both existing satellite navigation systems, GPS and
GLONASS.
The first option is a pure MEO 33 / 3 / 1 Walker constellation with an inclination of 50.2° and
an orbit altitude of 23983 km. The orbital period is approximately 14 hours. The following
picture shows the ground track and S/V positions, as well as the station locations of the
proposed ground network.
Figure 6-13 Ground Tracks of Galileo Option 1 Constellation
The next picture shows the earth coverage of that constellation, which is very good. Very
often more 10S/V or more are visible at the same time. This no surprise, taking into account
the relative large number of satellites at high orbit altitude.
R. Wolf
Page 103
Simulations and Results
Inter Satellite Links
Figure 6-14 Visibility of Galileo Option 1 Constellation
6.1.1.8
Galileo 2 (GEO/MEO)
The second option for Galileo is a mixed constellation, consisting of a MEO 27/3/1 Walker
constellation and three GEO. The MEOs have an inclination of 56° and an orbit altitude of
19424 km, the GEOs are located at 10°W, 10°E and 30°E. The following picture shows the
ground tracks and S/V positions, as well as the station locations of the proposed ground
network.
Page 104
R. Wolf
Inter Satellite Links
Simulations and Results
Figure 6-15 Ground Tracks of Galileo Option 2 Constellation
The next picture shows the earth coverage of that constellation. Average coverage is very
good with 8 or more S/V visible simultaneously. Especially over Europe and Africa visibility
is even enhanced because this area lies within the intersection of the geographical broadcast
areas of the three GEO satellites.
Figure 6-16 Visibility of Galileo Option 2 Constellation
R. Wolf
Page 105
Simulations and Results
Inter Satellite Links
6.1.2 Networks
6.1.2.1
GPS OCS
The following table shows the locations of the five monitoring stations used for orbit
determination of the GPS satellites. Their location on a world map is depicted in the chapter
"Optimized GPS constellation"
Station
Latitude
Longitude
Ascension Island
7.95° S
14.41° W
Diego Garcia
7.27° S
72.37° E
Kwajalein Atoll
8.72° N
167.73° E
Colorado Springs
38.5° N
104.5° W
Hawaii
21.19° N
157.52° W
6.1.2.2
DORIS Network
The DORIS network is optimised for LEO tracking, and therefore consists of a large number
of stations, listed in the following table. The locations are depicted on a world map in the
chapters of both LEO constellations.
Station
Latitude
Longitude
Dumont d' Urville
65.33° S
140.0° E
Syowa
69.0° S
39.58° E
Rothera
66.43° S
67.88° W
Rio Grande
52.21° S
66.25° W
Orroral
34.37° S
148.93° E
Yarragadee
28.95° S
115.35° E
Cachoeira Paulista
21.32° S
45.00° W
Ottawa
45.4° N
74.30° W
Yellowknife
62.48° N
113.52° W
Easter Island
26.85° S
108.62° W
Satiago
32.85° S
69.33° W
Purple Mountain
32.06° N
118.82° E
Djibouti
11.53° N
42.85° E
Galpagos
0.9° N
88.38° W
Page 106
R. Wolf
Inter Satellite Links
Simulations and Results
Station
Latitude
Longitude
Metsahovi
60.25° N
24.38° E
Toulouse
43.55° N
1.48° E
Amsterdam
36.20° S
77.57° E
Kourou
5.08° N
51.37° W
Kerguelen
48.65° S
70.27° E
La Reunion
20.78° S
55.57° E
Noumea
21.73° S
166.4° E
Papeete
16.42° S
148.38° W
Rapa
26.38° S
143.67° W
Wallis
12.73° S
176.18° W
Libreville
0.35° N
9.67° E
Dionysos
38.08° N
23.93° E
Reykjavik
64.15° N
20.02° W
Cibinong
5.52° S
106.85° E
Socorro
18.72° N
109.05° W
Everest
27.95° N
86.82° E
Arlit
18.78° N
7.37° E
NY Alesund
78.92° N
11.93° E
Port Moresby
8.57° S
147.18° E
Arequipa
15.53° S
70.50° W
Manila
14.53° N
121.03° E
Santa Maria
36.98° N
24.83° W
Badary
51.77° N
102.23° E
Krsnoyarsk
56.00° N
92.80° E
Yuzhno-Sakhalinsk
47.02° N
142.72° E
Dakar
14.72° N
16.57° W
Hartebeesthoek
24.12° S
27.70° E
Marion Island
45.12° S
37.85° E
Colombo
6.90° N
79.87° E
Goldstone
35.25° N
115.20° W
R. Wolf
Page 107
Simulations and Results
Inter Satellite Links
Station
Latitude
Longitude
Richmond
25.62° N
79.62° W
Fairbanks
64.97° N
146.48° W
Kauai
22.12° N
158.33° W
Guam
13.57° N
144.92° E
Saint Helena
14.05° S
4.33° W
Tristan da Cunha
36.95° S
11.68° W
Kitab
39.13° N
66.87° E
6.1.2.3
Proposed Galileo Network
The following table shows the locations of the proposed ground network for Galileo. Their
locations are depicted in the constellation chapters of both Galileo options.
Station
Latitude
Longitude
Pitcairn
25.0° S
130.0° E
Falkland
52.0° S
60.0° W
Point a Pitre
16.2° N
61.3° W
St. Pierre et M.
48.0° N
52.0° W
Reykjavik
64.1° N
21.6° W
Las Palmas
28.1° N
15.3° W
Ascension
7.9° S
14.4° W
Helsinki
62.0° N
30.0° E
Ankara
39.9° N
32.8° E
Indian Ocean British Territory
7.2° N
72.3° E
Amsterdam Island
37.5° S
77.3° E
Singapour
1.2° N
104.0° E
Tokyo
35.6° N
138.8° E
Noumea
22.2° S
166.2° E
Vancouver
49.2° N
123.1° W
Page 108
R. Wolf
Inter Satellite Links
6.1.2.4
Simulations and Results
Custom Global Network
For a global tracking of high altitude satellites, the following network has been chosen. The
location are depicted in the chapter "IGSO Walker constellation" and others.
Station
Latitude
Longitude
Orroral
34.37° S
148.93° E
Easter Island
26.85° S
108.62° W
Toulouse
43.55° N
1.48° E
Kourou
5.08° N
51.37° W
Wallis
12.73° S
176.18° W
Yuzhno-Sakhalinsk
47.02° N
142.72° E
Hartebeesthoek
24.12° S
27.70° E
Colombo
6.90° N
79.87° E
Goldstone
35.25° N
115.20° W
6.1.2.5
Custom Regional Network
For a regional tracking of geosynchroneous satellites, i.e. GEO and IGSO, the following
network has been chosen. It provides a reasonable tracking geometry for high altitude S/V
visible from Europe. The location are not depicted separately but are a sub set of the
preceding "global custom network".
R. Wolf
Station
Latitude
Longitude
Toulouse
43.55° N
1.48° E
Kourou
5.08° N
51.37° W
Hartebeesthoek
24.12° S
27.70° E
Colombo
6.90° N
79.87° E
Page 109
Simulations and Results
Inter Satellite Links
6.1.3 Simulation Scenarios
The following scenarios have been evaluated by simulation. Not all possible combination
have been investigate, but the chosen ones can be regarded as representative. The following
table shows the investigated combinations.
Scenario
24 Opt. GPS
Ground Only
Full Net
Red. Net
Galileo
OCS
With ISL
Full Net
Red Net
IGSO Walker 18/6/2 C. Global
C. Global
18 IGSO on 3 Loops
C. Global
C. Global
9 IGSO 9 GEO
C. Custom
C. Global
LEO 81 / 9 / 1
DORIS
Galileo
Galileo
LEO 72 / 9 / 1 + 9 DORIS
GEO
Galileo
Galileo
Galileo 33
Galileo
Galileo
Galileo 27 / 3
Galileo
Galileo
Regional
Net
C. Regional
C. Regional
In the case of GPS and Galileo, "Reduced Net" mean the OCS (Operational Control System
of GPS), whereas "Full Net" means the proposed Galileo network.
For IGSO and GEO constellations simulation have been made using the custom regional and
the custom global network.
For LEO constellations, the DORIS network has been used as a "full coverage " network and
the Galileo network as a reduced coverage network.
The investigated constellation / network combinations have been processed with and without
using inter satellite links.
Page 110
R. Wolf
Inter Satellite Links
Simulations and Results
6.2 Orbit Determination Accuracy
The following chapter deals with the accuracy of orbit determination. The results have been
derived using a numerical simulation of the satellite orbits, tracking geometry and observation
errors. The estimator used for orbit determination has been the real time Kalman filter
described in detail preceding chapters. The state vector for each satellite has been:
Position errors in X, Y and Z direction (inertial J2000 frame)
Velocity errors in X, Y and Z direction (inertial J2000 frame)
Clock offset.
The unmodelled residual acceleration has been assumed to be
a residual < 10 − 7
m
s2
and the stability of the satellite clock has been assumed to be
10 −13
s
s
which correspond to a medium stability rubidium clock. These values have been added as
process noise in the Kalman filter process.
The simulation step width has been 30 seconds, for the orbit propagation, i.e. the position has
been computed for every 30 seconds. Measurements have been take every 5 minutes.
The figures in this chapter show the real orbit errors on the left, and the standard deviations
on the right. The real orbit errors in radial, along track and cross track direction have been
derived from the position difference in x, y and z direction by
(ε r,a ,c )T = (X Estimated − X True )T ⋅ [e radial
e along e cross
]
where e <direction > denotes the unit vectors in radial, along track and cross track direction.
The standard deviations in radial, along track and cross track directions have been derived
from the position error sub matrix of the covariance matrix P, which contains the variances of
the position errors in inertial x, y and z direction. The following equation yields the variance
in radial direction. It can easily be modified for the other two directions.
σ 2radial = e radial T
σ 2xx σ 2xy σ 2xz
⋅ σ 2yx σ 2yy σ 2yz ⋅ e radial
σ 2 σ 2 σ 2
zx zy zz
The standard deviation is now obtained by simply computing the square root of the above
value.
R. Wolf
Page 111
Simulations and Results
Inter Satellite Links
6.2.1 Optimized GPS Constellation
6.2.1.1
Ground Tracking (OCS)
The orbit determination accuracy for a GPS satellite using the OCS shows large variations in
the standard deviations. The space vehicle is tracked by 3 station most of the time. For the
periods where it is tracked by only two stations, the covariances increase, although the real
orbit errors do not necessarily increase. The real time tracking accuracy is better than 1.2
meter in the radial direction, but up to 3 meters in the along track direction.
Radial Error [cm]
1993 07 02 19:08 - 1993 07 10 19:08
54.0
Radial Std. Dev. [cm]
1993 07 02 19:08 - 1993 07 10 19:08
120.0
27.0
80.0
0
40.0
-27.0
-54.0
[h]
46
Along Track Error [cm]
92
138
184
1993 07 02 19:08 - 1993 07 10 19:08
174.0
0
[h]
45
Along Track Std. Dev. [cm]
90
135
180
1993 07 02 19:08 - 1993 07 10 19:08
291.0
87.0
194.0
0
97.0
-87.0
-174.0
[h]
46
Cross Track Error [cm]
92
138
184
1993 07 02 19:08 - 1993 07 10 19:08
36.0
0
[h]
45
Cross Track Std. Dev. [cm]
90
135
180
1993 07 02 19:08 - 1993 07 10 19:08
96.0
18.0
64.0
0
32.0
-18.0
-36.0
[h]
46
92
138
184
0
[h]
45
90
135
180
Figure 6-17 Tracking Accuracy with GPS OCS
Page 112
R. Wolf
Inter Satellite Links
6.2.1.2
Simulations and Results
Ground Tracking with Augmented Network
For high precision applications, 1 meter tracking accuracy is not sufficient. One has to keep in
mind that the orbit has to be predicted and a high initial position error increases the prediction
error. To get a better tracking accuracy, a lager ground network has been chosen. Using the
Galileo network, a satellite is tracked by 5 or more ground stations all the time. This leads to a
much better tracking geometry reflected in the standard deviations of the orbit errors.
Radial Error [cm]
1993 07 01 21:35 - 1993 07 10 21:35
38.0
Radial Std. Dev. [cm]
1993 07 01 21:35 - 1993 07 10 21:35
57.0
19.0
38.0
0
19.0
-19.0
-38.0
[h]
51
Along Track Error [cm]
102
153
204
1993 07 01 21:35 - 1993 07 10 21:35
64.0
0
[h]
50
Along Track Std. Dev. [cm]
100
150
200
1993 07 01 21:35 - 1993 07 10 21:35
177.0
32.0
118.0
0
59.0
-32.0
-64.0
[h]
51
Cross Track Error [cm]
102
153
204
1993 07 01 21:35 - 1993 07 10 21:35
20.0
0
[h]
50
Cross Track Std. Dev. [cm]
100
150
200
1993 07 01 21:35 - 1993 07 10 21:35
90.0
10.0
60.0
0
30.0
-10.0
-20.0
[h]
51
102
153
204
0
[h]
50
100
150
200
Figure 6-18 Tracking Accuracy with proposed Galileo Ground Network
R. Wolf
Page 113
Simulations and Results
Inter Satellite Links
6.2.2 IGSO Walker Constellation
6.2.2.1
Ground Tracking
The IGSO Walker constellation is reasonably good tracked by custom global network
providing 3 – 4 simultaneous ground links. The standard deviation in radial direction is
around 35 cm.
Radial Error [cm]
1998 07 02 10:09 - 1998 07 09 22:09
Radial Std. Dev. [cm]
1998 07 02 10:09 - 1998 07 09 22:09
118.0
59.0
32.0
0
16.0
-59.0
-118.0
[h]
39
Along T rack Error [cm]
78
117
156
1998 07 02 10:09 - 1998 07 09 22:09
0
[h]
39
Along Track Std. Dev. [cm]
78
117
156
1998 07 02 10:09 - 1998 07 09 22:09
126.0
63.0
98.0
0
49.0
-63.0
-126.0
[h]
39
Cross Track Error [cm]
78
117
156
1998 07 02 10:09 - 1998 07 09 22:09
0
[h]
39
Cross Track Std. Dev. [cm]
78
117
156
1998 07 02 10:09 - 1998 07 09 22:09
134.0
67.0
120.0
0
60.0
-67.0
-134.0
[h]
39
78
117
156
0
[h]
39
78
117
156
Figure 6-19 Tracking Accuracy with Custom Global Net
Page 114
R. Wolf
Inter Satellite Links
6.2.2.2
Simulations and Results
Ground and Inter Satellite Tracking
The tracking accuracy can be remarkably improved by adding intersatellite links. The radial
accuracy increases down to 8 cm and the tangential orbit errors (along track and cross track
error) are also decreased down to 20 – 25 cm.
Radial Error [cm]
1998 07 01 23:59 - 1998 07 06 23:59
Radial Std. Dev. [cm]
1998 07 01 23:59 - 1998 07 06 23:59
12.0
6.0
8.0
0
4.0
-6.0
-12.0
[h]
26
Along Track Error [cm]
52
78
104
1998 07 01 23:59 - 1998 07 06 23:59
0
[h]
26
Along Track Std. Dev. [cm]
52
78
104
1998 07 01 23:59 - 1998 07 06 23:59
18.0
9.0
20.0
0
10.0
-9.0
-18.0
[h]
26
Cross Track Error [cm]
52
78
104
1998 07 01 23:59 - 1998 07 06 23:59
0
[h]
26
Cross Track Std. Dev. [cm]
52
78
104
1998 07 01 23:59 - 1998 07 06 23:59
16.0
8.0
22.0
0
11.0
-8.0
-16.0
[h]
26
52
78
104
0
[h]
26
52
78
104
Figure 6-20 Tracking Accuracy with Custom Global Net using additional ISL's
6.2.2.3
Ground and Inter Satellite Tracking with Reduced Network
In the introduction it has already be said that intersatellite links can be used to replace ground
likes. This scenario uses the IGSO Walker constellation together with a regional network. The
following figure shows the tracking accuracy for a S/C not visible to ground network at all!
R. Wolf
Page 115
Simulations and Results
Radial Error [cm]
Inter Satellite Links
1998 07 01 20:59 - 1998 07 05 14:59
14.0
Radial Std. Dev. [cm]
1998 07 01 20:59 - 1998 07 05 14:59
12.0
0
6.0
-14.0
[h]
21
Along Track Error [cm]
42
63
84
1998 07 01 20:59 - 1998 07 05 14:59
8.0
0
[h]
22
Along Track Std. Dev. [cm]
44
66
88
1998 07 01 20:59 - 1998 07 05 14:59
40.0
0
20.0
-8.0
[h]
21
Cross Track Error [cm]
42
63
84
1998 07 01 20:59 - 1998 07 05 14:59
17.0
0
[h]
22
Cross Track Std. Dev. [cm]
44
66
88
1998 07 01 20:59 - 1998 07 05 14:59
36.0
0
18.0
-17.0
[h]
21
42
63
84
0
[h]
22
44
66
88
Figure 6-21 Tracking Accuracy of S/C using ISL's, but not visible to Ground Network
(Custom Regional Network)
It can be seen that the standard deviations are only twice as high as for the S/C tracked by the
ground network. The "non-visible" satellites are only positioned relative to the "visible"
satellites. This is an interesting option even for non geosynchroneous orbits, because despite
of a regional network, the tracking accuracy is "transferred" to the non-visible satellites via
the inter satellite links.
Page 116
R. Wolf
Inter Satellite Links
Simulations and Results
6.2.3 IGSO on three Loops
6.2.3.1
Ground Tracking
This scenario provides nearly as good tracking accuracy as the Walker constellation. The
differences result from the higher inclination of the orbits.
Radial Error [cm]
1998 07 02 05:59 - 1998 07 09 17:59
Radial Std. Dev. [cm]
1998 07 02 05:59 - 1998 07 09 17:59
40.0
20.0
40.0
0
20.0
-20.0
-40.0
[h]
43
Along Track Error [cm]
86
129
172
1998 07 02 05:59 - 1998 07 09 17:59
0
[h]
42
Along Track Std. Dev. [cm]
84
126
168
1998 07 02 05:59 - 1998 07 09 17:59
52.0
26.0
118.0
0
59.0
-26.0
-52.0
[h]
43
Cross Track Error [cm]
86
129
172
1998 07 02 05:59 - 1998 07 09 17:59
0
[h]
42
Cross Track Std. Dev. [cm]
84
126
168
1998 07 02 05:59 - 1998 07 09 17:59
38.0
19.0
100.0
0
50.0
-19.0
-38.0
[h]
43
86
129
172
0
[h]
42
84
126
168
Figure 6-22 Tracking Accuracy of IGSO on a Loop with Custom Global Network
R. Wolf
Page 117
Simulations and Results
6.2.3.2
Inter Satellite Links
Ground and Intersatellite Tracking
In this scenario, intersatellite links provide also an enhancement in accuracy similar to the
IGSO Walker constellation.
Radial Error [cm]
1998 07 02 08:59 - 1998 07 11 02:59
Radial Std. Dev. [cm]
1998 07 02 08:59 - 1998 07 11 02:59
30.0
15.0
10.0
0
5.0
-15.0
-30.0
[h]
50
Along Track Error [cm]
100
150
200
1998 07 02 08:59 - 1998 07 11 02:59
0
[h]
49
Along Track Std. Dev. [cm]
98
147
196
1998 07 02 08:59 - 1998 07 11 02:59
34.0
17.0
22.0
0
11.0
-17.0
-34.0
[h]
50
Cross Track Error [cm]
100
150
200
1998 07 02 08:59 - 1998 07 11 02:59
0
[h]
49
Cross Track Std. Dev. [cm]
98
147
196
1998 07 02 08:59 - 1998 07 11 02:59
28.0
14.0
24.0
0
12.0
-14.0
-28.0
[h]
50
100
150
200
0
[h]
49
98
147
196
Figure 6-23 Tracking Accuracy of IGSO on a Loop with Custom Global Network using
additional ISL's
Page 118
R. Wolf
Inter Satellite Links
Simulations and Results
6.2.4 GEO / IGSO
6.2.4.1
Ground Tracking
In this mixed constellation, the tracking accuracy of IGSO satellites are similar the previous
constellations. Only the GEOs have a slightly different tracking geometry. The standard
deviations are very stable, and not subject to geometry variations, as can be seen in the figure
below.
Radial Error [cm]
1998 07 03 03:23 - 1998 07 09 09:23
Radial Std. Dev. [cm]
1998 07 03 03:23 - 1998 07 09 09:23
48.0
32.0
24.0
0
16.0
-24.0
-48.0
35
[h]
Along Track Error [cm]
70
105
140
1998 07 03 03:23 - 1998 07 09 09:23
0
[h]
34
Along Track Std. Dev. [cm]
68
102
136
1998 07 03 03:23 - 1998 07 09 09:23
60.0
84.0
30.0
0
42.0
-30.0
-60.0
[h]
35
Cross Track Error [cm]
70
105
140
1998 07 03 03:23 - 1998 07 09 09:23
0
[h]
34
Cross Track Std. Dev. [cm]
68
102
136
1998 07 03 03:23 - 1998 07 09 09:23
20.0
100.0
10.0
0
50.0
-10.0
-20.0
[h]
35
70
105
140
0
[h]
34
68
102
136
Figure 6-24 Tracking Accuracy of GEO using Ground Links only
R. Wolf
Page 119
Simulations and Results
Radial Error [cm]
Inter Satellite Links
1998 07 03 03:23 - 1998 07 09 09:23
Radial Std. Dev. [cm]
1998 07 03 03:23 - 1998 07 09 09:23
54.0
36.0
27.0
0
18.0
-27.0
-54.0
35
[h]
Along Track Error [cm]
70
105
140
1998 07 03 03:23 - 1998 07 09 09:23
0
[h]
34
Along Track Std. Dev. [cm]
68
102
136
1998 07 03 03:23 - 1998 07 09 09:23
98.0
128.0
49.0
0
64.0
-49.0
-98.0
[h]
35
Cross Track Error [cm]
70
105
140
1998 07 03 03:23 - 1998 07 09 09:23
0
[h]
34
Cross Track Std. Dev. [cm]
68
102
136
1998 07 03 03:23 - 1998 07 09 09:23
30.0
112.0
15.0
0
56.0
-15.0
-30.0
[h]
35
70
105
140
0
[h]
34
68
102
136
Figure 6-25 Tracking Accuracy of IGSO using Ground Links only
Page 120
R. Wolf
Inter Satellite Links
6.2.4.2
Simulations and Results
Ground and Intersatellite Tracking
This constellation can also be augmented with inter satellite links, leading to a remarkable
improvement.
Radial Error [cm]
1998 07 02 12:36 - 1998 07 12 18:36
Radial Std. Dev. [cm]
1998 07 02 12:36 - 1998 07 12 18:36
8.0
6.0
0
4.0
-6.0
[h]
51
Along Track Error [cm]
102
153
204
1998 07 02 12:36 - 1998 07 12 18:36
0
[h]
50
Along Track Std. Dev. [cm]
100
150
200
1998 07 02 12:36 - 1998 07 12 18:36
24.0
7.0
0
12.0
-7.0
[h]
51
Cross Track Error [cm]
102
153
204
1998 07 02 12:36 - 1998 07 12 18:36
0
[h]
50
Cross Track Std. Dev. [cm]
100
150
200
1998 07 02 12:36 - 1998 07 12 18:36
22.0
8.0
0
11.0
-8.0
[h]
51
102
153
204
0
[h]
50
100
150
200
Figure 6-26 Tracking Accuracy of IGSO with ISL's
R. Wolf
Page 121
Simulations and Results
Radial Error [cm]
Inter Satellite Links
1998 07 02 12:36 - 1998 07 12 18:36
Radial Std. Dev. [cm]
1998 07 02 12:36 - 1998 07 12 18:36
10.0
8.0
0
5.0
-8.0
[h]
57
Along Track Error [cm]
114
171
228
1998 07 02 12:36 - 1998 07 12 18:36
0
[h]
56
Along Track Std. Dev. [cm]
112
168
224
1998 07 02 12:36 - 1998 07 12 18:36
20.0
9.0
0
10.0
-9.0
[h]
57
Cross Track Error [cm]
114
171
228
1998 07 02 12:36 - 1998 07 12 18:36
0
[h]
56
Cross Track Std. Dev. [cm]
112
168
224
1998 07 02 12:36 - 1998 07 12 18:36
24.0
6.0
0
12.0
-6.0
[h]
57
114
171
228
0
[h]
56
112
168
224
Figure 6-27 Tracking Accuracy of GEO with ISL's
Page 122
R. Wolf
Inter Satellite Links
6.2.4.3
Simulations and Results
Ground and Intersatellite Tracking (Regional Network)
The pure regional tracking is an interesting option (not only) for geosynchroneous satellite
constellations. The figures below shows the tracking accuracy for an IGSO with rare ground
contact, as well as for a GEO with no ground contact.
Radial Error [cm]
1998 07 02 13:11 - 1998 07 13 01:11
Radial Std. Dev. [cm]
1998 07 02 13:11 - 1998 07 13 01:11
28.0
18.0
14.0
0
9.0
-14.0
-28.0
[h]
60
Along Track Error [cm]
120
180
240
1998 07 02 13:11 - 1998 07 13 01:11
0
[h]
58
Along Track Std. Dev. [cm]
116
174
232
1998 07 02 13:11 - 1998 07 13 01:11
22.0
32.0
11.0
0
16.0
-11.0
-22.0
[h]
60
Cross Track Error [cm]
120
180
240
1998 07 02 13:11 - 1998 07 13 01:11
0
[h]
58
Cross Track Std. Dev. [cm]
116
174
232
1998 07 02 13:11 - 1998 07 13 01:11
22.0
34.0
11.0
0
17.0
-11.0
-22.0
[h]
60
120
180
240
0
[h]
58
116
174
232
Figure 6-28 Tracking Accuracy of IGSO with rare Ground Contact using ISL's
R. Wolf
Page 123
Simulations and Results
Radial Error [cm]
Inter Satellite Links
1998 07 02 13:11 - 1998 07 13 01:11
Radial Std. Dev. [cm]
1998 07 02 13:11 - 1998 07 13 01:11
26.0
14.0
13.0
0
7.0
-13.0
-26.0
[h]
60
Along Track Error [cm]
120
180
240
1998 07 02 13:11 - 1998 07 13 01:11
0
[h]
58
Along Track Std. Dev. [cm]
116
174
232
1998 07 02 13:11 - 1998 07 13 01:11
20.0
30.0
10.0
0
15.0
-10.0
-20.0
[h]
60
Cross Track Error [cm]
120
180
240
1998 07 02 13:11 - 1998 07 13 01:11
0
[h]
58
Cross Track Std. Dev. [cm]
116
174
232
1998 07 02 13:11 - 1998 07 13 01:11
16.0
38.0
8.0
0
19.0
-8.0
-16.0
[h]
60
120
180
240
0
[h]
58
116
174
232
Figure 6-29 Tracking Accuracy of GEO without Ground Contact, only via ISL's
Page 124
R. Wolf
Inter Satellite Links
Simulations and Results
6.2.5 Pure LEO Constellation
6.2.5.1
Ground Tracking with Full Network
In this scenario, orbit determination for the LEO constellation has been done using ground
measurements only, but with a large scale network of ground stations. Using the DORIS
network provides a good tracking accuracy for LEO satellites. This is due to the large number
of tracking stations, distributed over the world. A radial accuracy of better than 30 cm can be
reached most of the time. Although LEO satellites have a higher along track error due to the
uncertainty in the high altitude air density, a LEO satellite tracked by a large ground network
can be seen from more than 5 stations the whole time. Due to the low altitude, the tracking
geometry is also good.
Radial Error [cm]
1998 07 02 05:24 - 1998 07 09 11:24
Radial Std. Dev. [cm]
1998 07 02 05:24 - 1998 07 09 11:24
50.0
32.0
25.0
0
16.0
-25.0
-50.0
41
[h]
Along T rack Error [cm]
82
123
164
1998 07 02 05:24 - 1998 07 09 11:24
0
[h]
40
Along Track Std. Dev. [cm]
80
120
160
1998 07 02 05:24 - 1998 07 09 11:24
98.0
44.0
49.0
0
22.0
-49.0
-98.0
41
[h]
Cross T rack Error [cm]
82
123
164
1998 07 02 05:24 - 1998 07 09 11:24
0
[h]
40
Cross Track Std. Dev. [cm]
80
120
160
1998 07 02 05:24 - 1998 07 09 11:24
34.0
16.0
17.0
0
8.0
-17.0
-34.0
[h]
41
82
123
164
0
[h]
40
80
120
160
Figure 6-30 Tracking Accuracy of LEO using DORIS Network only
R. Wolf
Page 125
Simulations and Results
6.2.5.2
Inter Satellite Links
Ground Tracking with Reduced Network
If the network is reduced (Galileo network), the accuracy gets degraded. as can be seen from
the following figure.
Radial Error [cm]
1998 07 02 07:48 - 1998 07 10 13:48
Radial Std. Dev. [cm]
1998 07 02 07:48 - 1998 07 10 13:48
80.0
64.0
40.0
0
32.0
-40.0
-80.0
[h]
47
Along Track Error [cm]
94
141
188
1998 07 02 07:48 - 1998 07 10 13:48
0
[h]
46
Along Track Std. Dev. [cm]
92
138
184
1998 07 02 07:48 - 1998 07 10 13:48
228.0
240.0
114.0
0
120.0
-114.0
-228.0
[h]
47
Cross Track Error [cm]
94
141
188
1998 07 02 07:48 - 1998 07 10 13:48
0
[h]
46
Cross Track Std. Dev. [cm]
92
138
184
1998 07 02 07:48 - 1998 07 10 13:48
56.0
26.0
28.0
0
13.0
-28.0
-56.0
[h]
47
94
141
188
0
[h]
46
92
138
184
Figure 6-31 Tracking Accuracy of a LEO using Galileo Network
Page 126
R. Wolf
Inter Satellite Links
6.2.5.3
Simulations and Results
Ground and Intersatellite Tracking (Reduced Network)
An accuracy even better as with a large scale ground network can be achieved by introducing
inter satellite links. Accuracy is improved by a factor of two in all direction, with respect to
the ground tracking.
Radial Error [cm]
1998 07 01 14:59 - 1998 07 02 20:59
Radial Std. Dev. [cm]
1998 07 01 14:59 - 1998 07 02 20:59
28.0
14.0
12.0
0
6.0
-14.0
-28.0
[h]
7
Along Track Error [cm]
14
21
28
1998 07 01 14:59 - 1998 07 02 20:59
0
[h]
7
Along Track Std. Dev. [cm]
14
21
28
1998 07 01 14:59 - 1998 07 02 20:59
24.0
12.0
8.0
0
4.0
-12.0
-24.0
[h]
7
Cross Track Error [cm]
14
21
28
1998 07 01 14:59 - 1998 07 02 20:59
0
[h]
7
Cross Track Std. Dev. [cm]
14
21
28
1998 07 01 14:59 - 1998 07 02 20:59
10.0
5.0
4.0
0
2.0
-5.0
-10.0
[h]
7
14
21
28
0
[h]
7
14
21
28
Figure 6-32 Tracking Accuracy of LEO using Ground and Intersatellite Tracking
R. Wolf
Page 127
Simulations and Results
Inter Satellite Links
6.2.6 GEO / LEO
6.2.6.1
Ground Tracking (Full Network)
Ground tracking accuracy for LEO satellites is identically to Pure LEO constellation. The
orbit determination accuracy for the GEO is similar to the figures provided with the
GEO/IGSO constellation.
6.2.6.2
Ground Tracking (Reduced Network)
Ground tracking accuracy for LEO satellites is identically to Pure LEO constellation. The
orbit determination accuracy for the GEO is similar to the figures provided with the
GEO/IGSO constellation.
6.2.6.3
Ground and Intersatellite Tracking (Reduced Network)
In this scenario, the following tracking schemes have been applied, as a difference to the inter
satellite link scenario of the pure LEO constellation. LEO and GEO satellites have been
tracked by the ground stations but not all possible inter satellite links have been used. The
following observation have been processed:
Ground – GEO
Ground – LEO
GEO – GEO
LEO – GEO
The results are shown in the following accuracy figure.
Page 128
R. Wolf
Inter Satellite Links
Radial Error [cm]
Simulations and Results
1998 07 01 15:36 - 1998 07 03 03:36
Radial Std. Dev. [cm]
1998 07 01 15:36 - 1998 07 03 03:36
30.0
14.0
15.0
0
7.0
-15.0
-30.0
[h]
9
Along Track Error [cm]
18
27
36
1998 07 01 15:36 - 1998 07 03 03:36
0
[h]
8
Along Track Std. Dev. [cm]
16
24
32
1998 07 01 15:36 - 1998 07 03 03:36
20.0
8.0
10.0
0
4.0
-10.0
-20.0
[h]
9
Cross Track Error [cm]
18
27
36
1998 07 01 15:36 - 1998 07 03 03:36
0
[h]
8
Cross Track Std. Dev. [cm]
16
24
32
1998 07 01 15:36 - 1998 07 03 03:36
10.0
4.0
5.0
0
2.0
-5.0
-10.0
[h]
9
18
27
36
0
[h]
8
16
24
32
Figure 6-33 Tracking Accuracy of LEO using Ground and LEO-GEO-ISL's
This measuring scheme has the advantage of reducing the number of possible links, but
provided a nearly as good performance as if all links would have been established.
R. Wolf
Page 129
Simulations and Results
Inter Satellite Links
6.2.7 Galileo 1 (Pure MEO)
6.2.7.1
Ground Tracking
In this scenario only ground links are processed for orbit determination. The constellation is
tracked by the full proposed ground network. The achieved accuracy can be seen in the figure
shown below.
Radial Error [cm]
1998 07 02 12:36 - 1998 07 12 18:36
Radial Std. Dev. [cm]
1998 07 02 12:36 - 1998 07 12 18:36
50.0
34.0
25.0
0
17.0
-25.0
-50.0
[h]
59
Along Track Error [cm]
118
177
236
1998 07 02 12:36 - 1998 07 12 18:36
0
[h]
57
Along Track Std. Dev. [cm]
114
171
228
1998 07 02 12:36 - 1998 07 12 18:36
92.0
110.0
46.0
0
55.0
-46.0
-92.0
[h]
59
Cross Track Error [cm]
118
177
236
1998 07 02 12:36 - 1998 07 12 18:36
0
[h]
57
Cross Track Std. Dev. [cm]
114
171
228
1998 07 02 12:36 - 1998 07 12 18:36
24.0
88.0
12.0
0
44.0
-12.0
-24.0
[h]
59
118
177
236
0
[h]
57
114
171
228
Figure 6-34 Tracking Accuracy of MEO using Galileo Network
Page 130
R. Wolf
Inter Satellite Links
6.2.7.2
Simulations and Results
Ground and Intersatellite Tracking
By adding inter satellite links, tracking accuracy can be improved enormously. Radial
accuracy comes down to 2.5 cm, while along track and cross track accuracy are around 10 cm.
This is a degree of accuracy which can normally only be reached by post processing. The real
time accuracy is that good, further smoothing before prediction becomes (nearly) obsolete.
Radial Error [cm]
1998 07 01 22:47 - 1998 07 06 10:47
Radial Std. Dev. [cm]
1998 07 01 22:47 - 1998 07 06 10:47
12.0
6.0
2.0
0
1.0
-6.0
-12.0
[h]
25
Along Track Error [cm]
50
75
0
100
1998 07 01 22:47 - 1998 07 06 10:47
[h]
25
Along Track Std. Dev. [cm]
50
75
100
1998 07 01 22:47 - 1998 07 06 10:47
18.0
9.0
8.0
0
4.0
-9.0
-18.0
[h]
25
Cross Track Error [cm]
50
75
0
100
1998 07 01 22:47 - 1998 07 06 10:47
[h]
25
Cross Track Std. Dev. [cm]
50
75
100
1998 07 01 22:47 - 1998 07 06 10:47
20.0
10.0
10.0
0
5.0
-10.0
-20.0
[h]
25
50
75
100
0
[h]
25
50
75
100
Figure 6-35 Tracking Accuracy of MEO all available ISL's
R. Wolf
Page 131
Simulations and Results
Inter Satellite Links
6.2.8 Galileo 2 (GEO/MEO)
6.2.8.1
Ground Tracking
The second option for Galileo shows a slightly higher real time orbit determination accuracy,
although using the same network. This is due to the higher inclination of the orbit planes
providing a slightly better observation geometry. Standard deviations and real orbit errors for
the MEO satellites can be taken from the following figure.
Radial Error [cm]
1998 07 02 13:11 - 1998 07 13 01:11
Radial Std. Dev. [cm]
1998 07 02 13:11 - 1998 07 13 01:11
48.0
34.0
24.0
0
17.0
-24.0
-48.0
[h]
60
Along Track Error [cm]
120
180
240
1998 07 02 13:11 - 1998 07 13 01:11
0
[h]
59
Along Track Std. Dev. [cm]
118
177
236
1998 07 02 13:11 - 1998 07 13 01:11
76.0
96.0
38.0
0
48.0
-38.0
-76.0
[h]
60
Cross Track Error [cm]
120
180
240
1998 07 02 13:11 - 1998 07 13 01:11
0
[h]
59
Cross Track Std. Dev. [cm]
118
177
236
1998 07 02 13:11 - 1998 07 13 01:11
12.0
70.0
6.0
0
35.0
-6.0
-12.0
[h]
60
120
180
240
0
[h]
59
118
177
236
Figure 6-36 Tracking Accuracy of MEO using Galileo Network
The orbit determination accuracy for the GEO is not as good due to a worse observation
geometry, but still in a reasonable range. Further post processing of the orbit is definitely
necessary.
Page 132
R. Wolf
Inter Satellite Links
Radial Error [cm]
Simulations and Results
1998 07 02 13:11 - 1998 07 13 01:11
Radial Std. Dev. [cm]
1998 07 02 13:11 - 1998 07 13 01:11
60.0
32.0
30.0
0
16.0
-30.0
-60.0
[h]
60
Along Track Error [cm]
120
180
240
1998 07 02 13:11 - 1998 07 13 01:11
0
[h]
59
Along Track Std. Dev. [cm]
118
177
236
1998 07 02 13:11 - 1998 07 13 01:11
70.0
92.0
35.0
0
46.0
-35.0
-70.0
[h]
60
Cross Track Error [cm]
120
180
240
1998 07 02 13:11 - 1998 07 13 01:11
0
[h]
59
Cross Track Std. Dev. [cm]
118
177
236
1998 07 02 13:11 - 1998 07 13 01:11
16.0
84.0
8.0
0
42.0
-8.0
-16.0
[h]
60
120
180
240
0
[h]
59
118
177
236
Figure 6-37 Tracking Accuracy of GEO using Galileo Network
R. Wolf
Page 133
Simulations and Results
6.2.8.2
Inter Satellite Links
Ground and Intersatellite Tracking (Full Network)
The following scenario has been processed using all available types of inter satellite links, but
limiting the number of simultaneous ISL's to 6. It can be seen that orbit deteremination
accuracy is improved well below 10 cm in radial direction for both types of satellites. The
following picture show the accuracy figure for the MEO satellites.
Radial Error [cm]
1998 07 02 01:12 - 1998 07 07 13:12
7.0
Radial Std. Dev. [cm]
1998 07 02 01:12 - 1998 07 07 13:12
6.0
0
3.0
-7.0
[h]
32
Along Track Error [cm]
64
96
0
128
1998 07 02 01:12 - 1998 07 07 13:12
8.0
[h]
31
Along Track Std. Dev. [cm]
62
93
124
1998 07 02 01:12 - 1998 07 07 13:12
8.0
0
4.0
-8.0
[h]
32
Cross Track Error [cm]
64
96
0
128
1998 07 02 01:12 - 1998 07 07 13:12
7.0
[h]
31
Cross Track Std. Dev. [cm]
62
93
124
1998 07 02 01:12 - 1998 07 07 13:12
16.0
0
8.0
-7.0
[h]
32
64
96
128
0
[h]
31
62
93
124
Figure 6-38 Tracking Accuracy of MEO using ISL's
The next picture shows the accuracy figure for the GEO satellites. Radial accuracy is nearly
as good as for the MEO, only the tangential accuracy is slightly worse.
Page 134
R. Wolf
Inter Satellite Links
Radial Error [cm]
Simulations and Results
1998 07 02 01:12 - 1998 07 07 13:12
10.0
Radial Std. Dev. [cm]
1998 07 02 01:12 - 1998 07 07 13:12
6.0
0
3.0
-10.0
[h]
32
Along Track Error [cm]
64
96
0
128
1998 07 02 01:12 - 1998 07 07 13:12
17.0
[h]
31
Along Track Std. Dev. [cm]
62
93
124
1998 07 02 01:12 - 1998 07 07 13:12
24.0
0
12.0
-17.0
[h]
32
Cross Track Error [cm]
64
96
0
128
1998 07 02 01:12 - 1998 07 07 13:12
13.0
[h]
31
Cross Track Std. Dev. [cm]
62
93
124
1998 07 02 01:12 - 1998 07 07 13:12
18.0
0
9.0
-13.0
[h]
32
64
96
128
0
[h]
31
62
93
124
Figure 6-39 Tracking Accuracy of GEO using ISL's
R. Wolf
Page 135
Simulations and Results
Inter Satellite Links
6.3 Accuracy of Broadcast Ephemeris (User Ephemeris)
The ephemeris of a navigation satellite, which is broadcast to the user is derived in several
steps:
t0 – t1
Observation and Processing:
From observation, the error with respect to a reference trajectory is
determined. This is done either by real time estimation (Kalman filtering) or
in batch process. The result is a time series of satellite positions, as well as
some estimated physical model parameters.
t1 - t2
Propagation and Adjustment:
The satellite trajectory is propagated ahead in time, from t1 up to t2 using the
best estimate of the satellites state vector as well as the best available force
model. Due to limitations in the accuracy of determining the state vector, as
well as the model parameters, the position of the satellite will diverge from
the true position with time.
A simple orbit propagation model will be adjusted to this propagated
trajectory. These are the broadcast or user ephemeris.
Therefore, quality of the broadcast ephemeris is driven by multiple factors:
•
Model fitting error: even is the model is fitted on the (in reality unknown) true trajectory,
it will have an error due to its simplicity.
•
Orbit determination error: even if the satellite trajectory is propagated using a perfect
force model, the initial position and velocity will not be perfect, due to limitations in the
orbit determination process.
•
Orbit propagation error: even if the initial state (position / velocity) of the satellite would
have been known perfectly, the imperfection of the force model will cause the propagated
trajectory to diverge slowly from the true one.
6.3.1 Model Fitting Error
In the following simulations, several candidates for broadcast ephemeris have been evaluated
by fitting them over a specified orbit arc. The orbit class has been varied from about 1250 km
orbit altitude (LEO) up to 36000 km (GEO). The error has been derived by comparing the
position derived from the broadcast model with that derived from a high order force model
integration.
Four different broadcast ephemeris models have been evaluated. All four models are
described in chapter 4.
•
The GLONASS model using 9 degrees of freedom
•
GLONASS type force model integration model using 12 degrees of freedom
Page 136
R. Wolf
Inter Satellite Links
Simulations and Results
•
GLONASS type force model integration model using 15 degrees of freedom.
•
GPS broadcast ephemeris model using 15 degrees of freedom
To obtain the fitting error only, the models have been adjusted to the true trajectory. The
fitting interval has been varied to obtain the sensitivity of the model to this parameter. The
error has been given in terms of URE (see chapter 5). The following table indicates the
results.
Orbit Class / Fitting
Interval
LEO (1250 km) 1h
GLONASS "GLONASS" "GLONAS
9 DOF
12 DOF
S"
15 DOF
150 – 250 m 40 – 110 m
GPS
15 DOF
25 - 40 m
23 – 29 m
LEO (1250 km) 30 15 - 40 m
min
5 – 15 m
1.5 – 5 m
2.5 – 6 m
LEO (1250 km) 15 1.5 – 8 m
min
0.5 – 2 m
7 – 25 cm
0.2 – 0.8 m
MEO (26000 km) 30 1 – 4 cm
min
3 – 5 mm
~0
-
MEO (26000 km) 1 h 5 - 25 cm
5 – 35 mm
3 – 5 mm
5 – 8 cm
MEO (26000 km) 2 h 0.9 – 1.2 m
0.3 – 0.5 m
4 – 6 cm
8 – 10 cm
MEO (26000 km) 1 166 m
Orbit
55 m
~ 32 m
~ 10 m
GEO / IGSO 1 h
1 – 8 cm
5 mm
~ 0 mm
(2 – 5 cm)
GEO / IGSO 2 h
10 – 50 cm
1 – 5 cm
5 mm
1 – 5 cm
GEO / ISGO 4 h
2–4m
0.2 – 0.5 m
1 – 8 cm
2 – 10 cm
Table 6-2 Fitting error
If we look at the table we see that the fitting error is expressed as a range of URE, not as one
constant value. This is due to the broadcast ephemeris model has a different fitting error over
different portions of the orbit. Looking at the three GLONASS type models, it can be seen
that with growing complexity, or degrees of freedom, the error decreases. The same holds for
a decrease in fitting interval. Now if we compare the 15 DOF GLONASS type model with the
GPS model which has also 15 degrees of freedom, it can be seen that for short fit intervals the
force model integration yields nearly arbitrary small fitting errors. In fact, this model could be
fitted to an orbit arc of a few seconds, as long as the arc is represented by more than five
position vectors. The GPS model, although offering also 15 degrees of freedom, can for
example not be fitted over a MEO orbit arc shorter than one hour. Due to the involved
estimation of Kepler elements, the estimation process does not converge for such a short orbit.
The representation of an orbit based on keplerian parameters is more suited for longer orbit
R. Wolf
Page 137
Simulations and Results
Inter Satellite Links
arcs. For example, if the broadcast model is fit over a complete MEO orbit, the GPS model
yields an errors smaller than the 15 DOF force model integration.
The estimation of Keplerian elements bears some additional problems: if orbits with
excentricity of inclination near zero have to be repesented, additional contrains have to be
introduced to make the least squares estimation process converge.
6.3.2 Orbit Determination and Propagation Error
To obtain useful broadcast ephemeris, the fit interval has to reside in the future. Therefore, the
determined orbit has to be propagated from the last known position using a sophisticated force
model. The orbit determination process yields a position, which is accurate only to certain
degree. If propagated, it will slowly diverge from the true orbit. In the following example the
orbit of a satellite from the Galileo Option 1 constellation has been determined using ground
links only. The satellite position and velocity estimated by the real time Kalman filter yields a
relatively noisy estimate of the satellite state vector with a 1 σ accuracy of around
•
35 cm in the radial component
•
1 meter in the along track component
•
80 cm in the cross track component
Note, that the real error needs not to be as high as that. The accuracy is taken from the
covariance matrix of the filter and represents the internal confidence of the estimation. If this
raw estimate is propagated without further smoothing, the orbit errors increase with time
relatively fast, as depicted in the following figure.
Page 138
R. Wolf
Inter Satellite Links
Simulations and Results
Radial Error [cm]
1998 07 02 14:35 - 1998 07 04 02:35
72.0
36.0
0
-36.0
-72.0
[h]
5
10
15
20
Along Track Error [cm]
25
30
35
1998 07 02 14:35 - 1998 07 04 02:35
634.0
317.0
0
-317.0
-634.0
[h]
5
10
15
20
Cross T rack Error [cm]
25
30
35
1998 07 02 14:35 - 1998 07 04 02:35
8.0
4.0
0
-4.0
-8.0
[h]
5
10
15
20
25
30
35
Figure 6-40 Propagation Error MEO raw estimate ground only 12 states 1 hour
The radial and cross track component of the orbit show periodic variations, but the along track
error has also a linear error superposed, growing with time. If for example GLONASS type 12
DOF broadcast model is fit over such an orbit, the result is an URE also increasing with time,
as can be seen in the following figure.
R. Wolf
Page 139
Simulations and Results
Inter Satellite Links
1.4
1.2
URE [m]
1.0
0.8
0.6
0.4
0.2
0.0
2450997.2
2450997.4
2450997.6
2450997.8
2450998.0
Julian Date [Days]
Figure 6-41 Ageing of Ephemeris MEO, raw estimate ground only 12 states 1 hour
Each bar represent the URE of one set of parameters valid for one hour. The satellite
ephemeris are degrading fast with time and exceed the 1 meter level after approximately 15
hours.
In the next example, the same determined satellite orbit is used, but now the last 6 hours of
position estimates are used to derived a smoothed initial position for the propagation process.
This is achieved by feeding a least squares estimator with the positions an estimating the
"true" position at the initial epoch. The follwong figure shows the orbit error evolution, if this
smoothed position is now propagated.
Page 140
R. Wolf
Inter Satellite Links
Simulations and Results
Radial Error [cm]
1998 07 02 14:35 - 1998 07 04 02:35
10.0
0
-10.0
[h]
5
10
15
20
Along Track Error [cm]
25
30
35
1998 07 02 14:35 - 1998 07 04 02:35
79.0
0
-79.0
[h]
5
10
15
20
Cross Track Error [cm]
25
30
35
1998 07 02 14:35 - 1998 07 04 02:35
5.0
0
-5.0
[h]
5
10
15
20
25
30
35
Figure 6-42 MEO propagation error with 6 hour smoothing
The along track error also shows a secular error tendency, but much smaller than that of the
propagated raw estimate. If the same broadcast model is fit over this propagated orbit, the
URE remain below 30 cm even nearly up to 24 hours, as can be seen in the following picture.
R. Wolf
Page 141
Simulations and Results
Inter Satellite Links
URE [m]
0.3
0.2
0.1
0.0
2450997.2
2450997.4
2450997.6
2450997.8
2450998.0
Julian Date [Days]
Figure 6-43 Ageing of MEO Ephemeris with 6 hours smoothing
Now let us increase the smoothing interval. The following two figures show the propagation
error and the degradation or ageing of the broadcast ephemeris, if the raw estimate of the orbit
is smoothed over 12 hours, corresponding to nearly one complete orbit.
Page 142
R. Wolf
Inter Satellite Links
Simulations and Results
Radial Error [cm]
1998 07 02 14:35 - 1998 07 03 16:58
6.0
3.0
0
-3.0
-6.0
3
[h]
6
9
12
15
18
Along Track Error [cm]
21
24
1998 07 02 14:35 - 1998 07 03 16:58
38.0
19.0
0
-19.0
-38.0
3
[h]
6
9
12
15
18
Cross Track Error [cm]
21
24
1998 07 02 14:35 - 1998 07 03 16:58
2.0
1.0
0
-1.0
-2.0
[h]
3
6
9
12
15
18
21
24
Figure 6-44 MEO Propagation Error with 12 hours of smoothing
R. Wolf
Page 143
Simulations and Results
Inter Satellite Links
0.08
URE [m]
0.06
0.04
0.02
0.00
2450997.2
2450997.4
2450997.6
2450997.8
2450998.0
Julian Date [Days]
Figure 6-45 URE with 12 hours smoothing
Orbit errors, as well as URE remain below 10 cm up to 24 hours.
In the last example the raw estimate is used again for propagation, but this time it has been
derived using inter satellite links. From chapter 6.2.7 it can be seen that the standard
deviations, as well as the real orbit errors are much lower compared to ground based only
orbit determination.
•
around 2.5 cm radial error (1 σ)
•
9 cm along track error (1 σ)
•
11 cm cross track error (1 σ)
The following figure show the orbit propagation error, as well as the URE of the broadcast
ephemeris for this tracking scenario.
Page 144
R. Wolf
Inter Satellite Links
Simulations and Results
Radial Error [cm]
1998 07 03 12:00 - 1998 07 04 14:23
10.0
5.0
0
-5.0
-10.0
[h]
4
8
12
16
Along Track Error [cm]
20
24
1998 07 03 12:00 - 1998 07 04 14:23
50.0
25.0
0
-25.0
-50.0
[h]
4
8
12
16
Cross Track Error [cm]
20
24
1998 07 03 12:00 - 1998 07 04 14:20
1.5
0.8
0
-0.8
-1.5
[h]
4
8
12
16
20
24
Figure 6-46 MEO Propagation Error without smoothing derived from Raw Estimate using
ISL's
R. Wolf
Page 145
Simulations and Results
Inter Satellite Links
0.14
0.12
URE [m]
0.10
0.08
0.06
0.04
0.02
0.00
2450998.0
2450998.2
2450998.4
2450998.6
2450998.8
Julian Date [Days]
Figure 6-47 URE without smoothing using ISL's
Although the raw estimate has not been smoothed, the orbit prediction error is relativly small
if compared to the propagation of the raw estimate derived from ground based only tracking.
A better prediction accuracy can only be achieved if the determined orbit is smoothed over a
sufficient long period (approximately one orbit revolution).
This fact bears an interesting option if fast generation of broadcast ephemeris together with a
reduced computation load is desired, which is especially interesting for board autonomous
ephemeris generation.
Of course, if highest precision is desired, the ISL aided orbit determination can be smoothed
to. The last two figures show propagation error and broadcast ephemris degradation if the raw
estimate is smoothed over 12 hours prior to propagation.
Note that although the values seems to be slightly better than in the example for the ground
based only derived orbit with 12 hour smoothing, there is in fact no relevant difference in the
orbit accuracy. If the orbit is smoothed a sufficient time prior to propagation, it makes no
difference if the raw estimate has been of high or medium accuracy.
Page 146
R. Wolf
Inter Satellite Links
Simulations and Results
Radial Error [cm]
1998 07 02 12:00 - 1998 07 03 14:23
4.0
2.0
0
-2.0
-4.0
[h]
4
8
12
16
Along Track Error [cm]
20
24
1998 07 02 12:00 - 1998 07 03 14:23
28.0
14.0
0
-14.0
-28.0
[h]
4
8
12
16
Cross Track Error [cm]
20
24
1998 07 02 12:00 - 1998 07 03 14:23
4.0
2.0
0
-2.0
-4.0
[h]
4
8
12
16
20
24
Figure 6-48 MEO Propagation Error with 12 hours smoothing using ISL's
R. Wolf
Page 147
Simulations and Results
Inter Satellite Links
0,06
URE [m]
0,05
0,04
0,03
0,02
0,01
0,00
2450997,0
2450997,2
2450997,4
2450997,6
2450997,8
Julian Date [Days]
Figure 6-49 URE with 12 hours smoothing using ISL's
6.3.3 Ephemeris Accuracy of Scenarios
In the following section, the achievable accuracy of broadcast ephemeris has been
investigated for the different scenarios. To get comparable results, the 15 degree of freedom
GLONASS type ephemeris model has been used for all constellations. However, the fit
interval has been adopted to the different orbit types to obtain a “useful” accuracy in terms of
URE. The following table indicates the fit intervals chosen for the different orbit classes:
Orbit Class
Fit Interval
LEO 1250 km
15 Minutes
MEO
2 hours
GEO / IGSO
4 hours
Input to the simulations had been the reference orbits and estimated orbits from section 6.2.
One has to keep in mind that the propagation of the raw estimate bears some danger: the
position error will not be the same for all “starting position”, because the real error is not
constant but shows a noise / random walk behaviour within the 3 sigma margin (see section
6.2). Therefore some of the raw estimates had to be replaced by an artificial introduced small
offset to obtain the results. However, the numbers derived are representative.
Page 148
R. Wolf
Inter Satellite Links
6.3.3.1
Simulations and Results
Optimized GPS
Tracking Scenario
Mean URE over 24 Hours
Worst URE within 24 Hours
Raw Estimate Reduced Net
56 cm
82 cm
Raw Estimate Full Net
30 cm
42 cm
Smoothed Over 12 Hours
3 cm
5 cm
6.3.3.2
IGSO Walker Constellation
Tracking Scenario
Mean URE over 24 Hours
Worst URE within 24 Hours
Raw Estimate Full Net
103 cm
161 cm
Raw Estimate Full Net with
ISL
26 cm
37 cm
Raw Estimate Reduced Net
with ISL
26
44
Smoothed Over 12 Hours
16 cm
25 cm
Tracking Scenario
Mean URE over 24 Hours
Worst URE within 24 Hours
Raw Estimate Full Net
41 cm
52 cm
Raw Estimate Full Net with
ISL
20 cm
26 cm
Smoothed Over 12 Hours
18 cm
22 cm
6.3.3.3
6.3.3.4
IGSO on Three Loops
GEO / IGSO Constellation
Tracking Scenario
Mean URE over 24 Hours
Worst URE within 24 Hours
Raw Estimate Full Net
52 cm
65 cm
Raw Estimate Full Net with
ISL
14 cm
20 cm
Raw Estimate Regional Net
with ISL
20 cm
27 cm
Smoothed Over 12 Hours
13 cm
17 cm
R. Wolf
Page 149
Simulations and Results
6.3.3.5
Inter Satellite Links
Pure LEO Walker Constellation
Tracking Scenario
Mean URE over 24 Hours
Worst URE within 24 Hours
Raw Estimate Full Net
175 cm
330 cm
Raw Estimate Reduced Net
192 cm
327 cm
Raw Estimate Reduced Net
with ISL
79 cm
173 cm
Smoothed Over 12 Hours
32 cm
61 cm
Tracking Scenario
Mean URE over 24 Hours
Worst URE within 24 Hours
Raw Estimate Full Net
52 cm
65 cm
Raw Estimate Reduced Net
with ISL
20 cm
27 cm
Smoothed Over 12 Hours
13 cm
17 cm
Tracking Scenario
Mean URE over 6 Hours
Worst URE within 6 Hours
Raw Estimate Full Net
175 cm
330 cm
Raw Estimate Reduced Net
with ISL
27 cm
35 cm
Smoothed Over 12 Hours
29 cm
52 cm
6.3.3.6
GEO / LEO Constellation
GEO
LEO
6.3.3.7
Galileo Option 1 (Pure MEO)
Tracking Scenario
Mean URE over 24 Hours
Worst URE within 24 Hours
Raw Estimate Full Net
32 cm
55 cm
Raw Estimate Full Net with
ISL
19 cm
27 cm
Smoothed Over 12 Hours
3 cm
5 cm
Page 150
R. Wolf
Inter Satellite Links
6.3.3.8
Simulations and Results
Galileo Option 2 (GEO / MEO)
GEO
Tracking Scenario
Mean URE over 24 Hours
Worst URE within 24 Hours
Raw Estimate Full Net
52 cm
65 cm
Raw Estimate Full Net with
ISL
23 cm
31 cm
Smoothed Over 12 Hours
22 cm
29 cm
Tracking Scenario
Mean URE over 24 Hours
Worst URE within 24 Hours
Raw Estimate Full Net
32 cm
55 cm
Raw Estimate Full Net with
ISL
21 cm
35 cm
Smoothed Over 12 Hours
3 cm
5 cm
MEO
R. Wolf
Page 151
Autonomous Onboard Processing
Inter Satellite Links
7 AUTONOMOUS ONBOARD PROCESSING
7.1 Why Onboard Processing?
In a typical conventional orbit estimation process, ranging signals are transmitted by the
satellite whereas measurements are taken by the ground stations. There are two exceptions,
the DORIS and the PRARE system: both systems are performing measurements onboard.
•
PRARE uses two way the range and range rate measurements in the X-band with
phase coherent ground transponders. It has four channels; therefore it is limited to four
simultaneous measurements. Moreover, due to the fact that the transponders are phase
coherent and X band frequencies require directive antennae, the ground transponders
can serve only one satellite at a time. Although PRARE is used for orbit heights
between 500 and 2000 km, it is principally not limited to a special orbit class. During
the AUNAP project (1996) PRARE has been evaluated as an option for an
autonomous navigation processor onboard an IGSO satellite.
•
DORIS receives codeless carrier signals on two frequencies (S-band and UHF) from
so called ground beacons and performs Doppler1 measurements. Because range rate
measurements are independent of the clock offset, one “Master Beacon” transmits a
kind of ranging code, which is needed to perform at least coarse synchronisation of the
onboard clocks. Doppler measurements allow precise orbit estimation if the satellite
dynamics are high, therefore it is more or less restricted to LEO orbits.
Nevertheless, even in those systems the measurements are downloaded and transmitted via
data link to a central facility for further processing. In navigation applications like GPS and
GLONASS, the central processing facility performs then orbit determination, orbit prediction
and broadcast ephemeris adjustment.
But given the fact that measurements are available, onboard processing has some advantages.
The data latency can be reduced to a minimum. Therefore it is best suited for applications
were fast reaction is desired. In navigation applications, the following four parameters are a
measure for the performance of a system:
•
Accuracy
•
Availability
•
Continuity of Service
•
Integrity
The first two parameters are driven by the system’s design. Accuracy is mainly driven by two
factors, the radio frequency link (signal-in-space) and the broadcast ephemeris, and can be
enhanced e.g. by
1
Although DORIS performs no ranging but Doppler measurements, the two frequencies are needed to correct
for ionospheric effects, which are in fact an issue due to 10 seconds integration time. Because of this long
integration time, it would be more appropriate to speak of phase rate instead of Doppler measurements.
Page 152
R. Wolf
Inter Satellite Links
Autonomous Onboard Processing
•
providing two frequencies to allow ionospheric corrections
•
increasing chipping rate on the ranging signal
•
increasing update rates of broadcast ephemeris
•
using accurate broadcast models / short fit intervals
•
using accurate clocks
Availability, especially with respect to visibility of enough S/V to perform navigation, is
driven by constellation design, and can be enhanced by
•
putting enough S/V into service (actives, as well as spares and replenishment)
•
choosing benign orbits with respect to visibility
The last two parameters are a bit more critical. They are mainly driven by reliability of the
space vehicles and environmental influences degrading the signal-in-space like RF
interference, atmospheric effects or jamming. Keeping these parameters high is of utmost
interest for civil aviation.
System inherent continuity and integrity of the two existing navigation systems GPS and
GLONASS does not meet the requirements of civil aviation and can therefore be not used as a
sole means of navigation. To overcome system limitations with respect to integrity,
augmentation systems like WAAS, EGNOS and MSAS are under development. Their main
output are corrections for
•
ionospheric effects
•
satellite clock
•
satellite ephemeris
emitted by geostationary Inmarsat space crafts. A central processing facility has to
recomputed satellite orbits to provide orbit and clock corrections at a high update rate. This
has to be done for up to 51 satellites. Fast corrections which are applied directly to the range
measurement are provided at an update interval smaller than 6 seconds to meet time-to-alarm
requirements for CAT I. So called “long term” corrections provide vector corrections for
position and velocity which are updated approximately every 6 minutes. Both, fast and long
term corrections have to be applied additionally to the broadcast ephemeris transmitted by the
GPS and GLONASS space crafts.
Summarising the measures taken to enhance integrity we find
1. ephemeris correction
2. at a high update rate
3. with minimum data latency
4. and corrections to the ionospheric effects
Future satellite navigation systems like Galileo will provide at least dual or maybe even triple
frequency links. Even the existing GPS system is going to be enhanced and the next
generation of replenishment satellites (starting with Block II F) will provide a civil available
ranging code on two frequencies. What’s left, is the integrity of Satellite orbit and clock.
R. Wolf
Page 153
Autonomous Onboard Processing
Inter Satellite Links
Now, what this all to do with autonomous onboard processing? The measures 1. / 2. and 3. for
one satellite could easily be provided by each satellites onboard processor! Imagine the
following: presumed, measurements are taken onboard the satellite. The onboard processor
uses these observations to update the error estimates of position, velocity and clock. These
errors can directly be used as correction to the ephemeris derived satellite position and
therefore be immediately transmitted to the user. Data latency: negligible, especially if
compared to a conventional ground based system! This seems should be in fact a sufficient
motivation to take the effort with respect to space craft complexity and cost of implementing a
onboard processing “facility”.
7.2 Implementation Aspects of Onboard Processing
The software for an autonomous onboard processor has to satisfy some requirement
depending on the tasks to be performed. The complete chain from the raw measurements to
integer ephemeris information for the navigation user requires the software to provide
following functionalities:
•
conversion of raw measurements to ranges and range rate observables
•
detection and isolation of outlying measurements
•
orbit propagation using a precise force model
•
estimation of orbit and clock errors from measurements
•
a possibility to reset the state estimator if desired or necessary
•
coordinate conversion from a terrestrial reference frame to ECI-J2000
•
accept upload of celestial body ephemeris, earth rotation parameters ...
•
adjusting the broadcast message to a period of predicted position vectors.
•
detection and computation of required orbit manoeuvres to maintain desired orbit
properties.
•
orbit propagation using the broadcast message
•
detection and isolation of abnormal clock drift or orbit degradation
•
integrity check on the ephemeris and clock parameter message delivered to the user
•
accept new upload from ground for reference trajectory data
•
consistency check of own computed data
Not all tasks have the same performance requirements. The used CPU should be fast enough
to allow at least one duty cycle per second for the integrity processing. Orbit prediction for
example can be performed with slower update rates. Integrity checks of ephemeris and clock
parameters have to be performed once per second.
The measurements can be ground links, as well as inter satellite links. These are especially
valuable to check integrity of the satellite ephemeris.
Page 154
R. Wolf
Inter Satellite Links
Autonomous Onboard Processing
7.2.1 Complexity of Orbit Prediction and Estimation Algorithms
According to estimations made during the AUNAP project, the computational load for the
model using a 4 x 4 earth model requires about 5 – 10 percent of today available space
qualified CPU's if performing one duty cycle per second. Also, in the DIODE experiment, a
15 x 15 gravity model has successfully been used in an onboard processor. The following
figure shows a block diagram of the precise orbit estimation process.
Figure 7-1 Block Diagram of Orbit Determination
The orbit integrator is needed twice, as non linear state predictor in the state estimation
process and after determination of an accurate satellite state vector, for orbit propagation. An
additional orbit propagator based on the broadcast ephemeris model is also needed.
The following table contains an estimation of the algorithmic complexity of an orbit
estimation process (precise estimation). These numbers have been investigated during the
German AUNAP project.
All Routines,
Add /
Mul / Div
math. Func. Loops
/ Assignments
one Duty
Subtract
Cond.
Cycle
Instructions
11 States
15409
19015
826
6216
12614
8 Obs.
GP 4 x 4
11 States
33537
27611
10022
7888
25814
8 Obs.
GP 15 x 15
11 States
554653
1058323
235878
45288
316874
8 Obs.
GP 70 x 70
Table 7-1 Estimated Algorithmic Complexity of Orbit Estimation Process
(AUNAP 1996)
R. Wolf
Page 155
Autonomous Onboard Processing
Inter Satellite Links
From experiences made during this project regarding execution times of different software
modules, and under the assumption that the CPU is approximately 20 times slower than a 350
MHz Pentium II, a very rough estimate can be derived for the required computational power
onboard a satellite:
~ 100 ms for orbit determination (including non-linear state prediction) per measurement
epoch (realtime)
~ 30 ms for orbit propagation per epoch, i.e. 1 s to generate 50 trajectory points ahead,
separated 144 s. (offline)
~ 10 s for fitting a 2-hour-valid broadcast ephemeris over approximately 50 trajectory points.
(offline)
~ 2 ms for orbit propagation per epoch using broadcast ephemeris force model (for other
satellites in constellation); for 20 ISL’s requiring 40 ms. (realtime)
~ 50 ms to perform a RAIM-like algorithm using 20 ISL’s (realtime)
This results in approximately 200 ms for the tasks which have to be performed in realtime, i.e.
once per second, in order to achieve integrity requirements. The remaining 800 ms per onesecond-duty-cycle can be used to perform sequentially the (slightly more than) 10 s offline
task. The 2-hour-valid broadcast ephemeris could updated, say every 30 minutes and would
require less than 6 ms of computing time per one-second-duty-cycle, i.e. 0.6% of the available
computing power.
Note that this is a very rough preliminary estimate, but it seems to be feasible to perform all
these tasks, required for full autonomous onboard processing with 20% – 25% of the available
computing power.
7.2.2 Onboard Processing using ISLs
Inter satellite links are per definition measurements which are taken onboard and therefore
seem to perfectly match the requirements for an onboard processor. But ISL’s bear some
problems for a constellation consisting of autonomous processing satellites.
The optimal approach to process ISL's would be, to process all measurements and all satellites
states in one large filter. This is hard to achieve, if each satellite has its own state estimator
onboard. The following example shall highlight how satellite state estimates get correlated by
the inter satellite links.
Let us assume 3 satellites , represented by their state X1,2,3 . The measurements are processed
together in on Kalman filter some other least squares estimator. The state transition of all
three satellites can be written as
x1
Φ 1
x = 0
2
x 3 k 0
Page 156
0
Φ2
0
0
0
Φ 3 k
x1
⋅ x 2
x 3 k −1
Eq. 7.2-1
R. Wolf
Inter Satellite Links
Autonomous Onboard Processing
Up to that point, the covariances of the satellites are assumed to be uncorrelated.
p11
P = 0
0
0
p 22
0
Eq. 7.2-2
0
0
p 33
Now, satellite number one is transmitting an inter satellite ranging signal which is received by
satellites number two and tree. Therefore, the measurement equation system is written as
z13
h 11
z = h
12 k 21
0
h 22
x1
h 13
⋅ x
0 k 2
x 3 k −1
,
r
R = 13
0
0
r12
Eq. 7.2-3
with R being the covariance matrix of the (uncorrelated) measurements. The indices for the
measurements z and variances r represent the link direction, i.e. z13 means "link from satellite
one to satellite three". Let us now only look at the equation concerning the Kalman gain
matrix,
(
K = PH T HPH T + R
)
Eq. 7.2-4
−1
which is a 3 x 2 matrix. The element Kjk contains the effect of the kth measurement on the jth
state. Performing the equation using our presumptions above leads to a lengthy expression.
Here, we only concentrate on a few elements. K32 contains the effect of the measurement
between sat1 and sat2 (measured by sat2) on the state of sat3. The expression is none-zero and
requires all partial matrices to be evaluated.
K32 = −(h11h13h 21p11p33 ) ⋅ det(Inv)
Eq. 7.2-5
with
det(Inv) =
1
2 2
2 2
2 2
2
2
h11
h 22p11p22 + h13
h 21p11p33 + h13
h 22p22p33 + h11
p11r12 + h13
p33r12 + h 221p11r13 + h 222p22r13 + r12r13
Eq. 7.2-6
The problem is that the measurement sat1-sat2 is not available at sat3. The Kalman gain on
the state of sat2 evaluates to
(
)
2
2
K 22 = h 222 p 22 h 11
p11 + h 13
p 33 + r13 ⋅ det(Inv)
Eq. 7.2-7
if all three satellites are processed in one filter.
Let us assume now that we split the filter and process the measurement sat1-sat2 and sat1-sat3
independently in two separate filters.
R. Wolf
Page 157
Autonomous Onboard Processing
z 13 = [h 11
z 12 = [h 21
x
h 13 ] ⋅ 1
x 3
x
h 22 ] ⋅ 1
x 2
Inter Satellite Links
0
p
Pfilter1 = 11
0 p 33
0
p
, Pfilter2 = 11
0 p 22
,
Eq. 7.2-8
Both filters contain the state of sat1, because sat1 is involved in both measurements . The
Kalman gain for the sat2 state is now obtained by
K 22 =
h 13 p 33
2
2
h 11
p11 + h 13
p 33 + r13
Eq. 7.2-9
It can also be shown that both filters yield Kalman gain factors also for sat1, which will not be
equal.
All measurements, covariances and satellite states should be available at the same time in the
same place to perform an optimal estimation. The easiest way to achieve this would be to
download the measurements and process inter satellite links on ground and in post processing.
Unfortunately this removes one of the greatest benefits of the inter satellite links with respect
to autonomy.
The second approach, to process two satellites pair-wise leads to sub-optimal but maybe also
satisfactory results.
A third approach consists in the processing of inter satellite links without estimating the
sending satellites state. This would require the smallest amount of communication between
the satellites. The partner satellites simply transmit their state vector (or corrections to the
state vector) which are frequently updated. In fact, this seems to be the only feasible way.
7.3 Application Example: Availability during Orbit Manoeuvres
Perturbations acting on the satellites orbit make it necessary to correct the space craft
trajectory from time to time in order to maintain the desired orbit. These orbit corrections,
achieved by activating the spaces craft's propulsion system, lead to a discontinuity in the
acceleration acting on the satellite. Although it is no problem to account for thrust forces in
the numerical integration during a propulsive flight phase, the accuracy of the broadcast
message, which has to be fit over a certain period of validity, will be degraded if engine start
or cut off falls within that time span. The amount of degradation depends strongly on the
thrust level.
Unintentional thrusters firing on the other hand issues an integrity problem, because the
broadcast ephemeris do not apply anymore. This means, the user computes his position
relative to a satellite based a wrong S/V position information. However, this topic shall be
addressed in the next section.
The conventional approach (GPS for example) is to set the space craft status to unhealthy,
short before an orbit manoeuvre and up to the time when the orbit determination provides
Page 158
R. Wolf
Inter Satellite Links
Autonomous Onboard Processing
nominal accuracy again. A drawback of this strategy is a service interruption during orbit
manoeuvres and for a small period afterwards. It leads to an orbit maintenance strategy
consisting of infrequent, large orbit corrections. For a highly available system it is desired to
keep this service interruption as short as possible.
The amount of fuel which can be store aboard a space craft is, besides battery and solar panel
life time, one of the main life time drivers. A satellite consumes propellant to maintain its
orbital position. If the complete fuel is burnt, the space craft goes out of services. One of the
possibilities to prolong satellite life time is to use high impulsive propulsion, like ion engines.
Especially for station keeping of GEO satellites, this is an extreme interesting option. New
commercial satellite platforms like the Hughes HS 601 and HS 702 series already offer ion
propulsion as an option.
Due to the low mass exhaust and therefore low thrust levels of ion engines, powered flight
phases are much longer and have to be performed more frequent, compared to conventional
chemical propulsion. Because it would not be acceptable to have that frequent service
interruptions, the use of ion propulsion implies the integration of the powered flight phase into
normal service, i.e. the broadcast ephemeris have to be adjusted to thrust phases as well as to
free flight phases. An ion engine would require too much time for a large (and infrequent)
orbit correction manoeuvre, as will be demonstrated by the following example.
HS 601 HP Thrusters
HS 702 Thrusters
Diameter
13 cm
25 cm
Specific Impulse
2568 s
3800 s
Thrust
18 mN
165 mN
Power Consumption
0.5 kW
4.5 kW
Table 7-2 Characteristics of Hughes XIPS Ion Drives
A space craft with a mass of 550 kg (typical End-Of-Life mass) has to be accelerated by 50
m/s using the HS 601 HP ion drive described above. From combining the following equations
m
m
∆videal = ceffective ⋅ ln Start = ISP ⋅ g 0 ⋅ ln Start
m Cutoff
m Cutoff
⋅ t Burn
m Cutoff = mStart − m
⋅ ceffective = m
⋅ ISP ⋅ g 0
T=m
Eq. 7.3-1
with
ceffective
Effective exhaust velocity
T
Thrust (2 thrusters are used)
m
mass
R. Wolf
Page 159
Autonomous Onboard Processing
Inter Satellite Links
ISP
Specific Impulse
g0
nominal gravity force (9.81 m/s²)
we can estimate the required burn time by
m Start − t Burn ⋅ ISPT⋅g 0
m Start
t Burn
t Burn
=e
∆v
−
I ⋅g
SP 0
Eq. 7.3-2
∆v
−
I ⋅g
SP 0
⋅ 1− e
5
≈ 7.63 ⋅ 10 s ≈ 212 h
I ⋅ g ⋅ m Start
= SP 0
T
For station keeping of a GEO satellite, Hughes therefore recommends two 5 hour propulsive
phases per day. To provide nominal availability of GNSS 2, the satellites will have to be
available during these propulsive phases. Although there are further developments like the HS
702 thruster providing 165 mN thrust, there are still 2 x 30 minutes thrust phases per day
required for station keeping. Thus, the broadcast message has to be adapted to account for the
frequent or nearly permanent presence of propulsive forces. There are several possibilities to
do that.
7.3.1 Continued Service during Manoeuvres
If a broadcast message format similar to the GLONASS navigation message is used, where
the satellite position is derived from numerically integrating a simple force model, and
presumed the thrust phase is sufficiently short, a special navigation message extender could
be send. Such a message could look like the following
ENGINE_START_TIME
ENGINE_CUT_OFF_TIME
AVARAGE_THRUST_X
AVARAGE_THRUST_Y
AVARAGE_THRUST _Z
Table 7-3 Thrust Phase Navigation Message Extension
The user receiver would than simply add the thrust forces during the time span covered by the
navigation message extender. A geometric ephemeris format based on Keplerian elements,
Page 160
R. Wolf
Inter Satellite Links
Autonomous Onboard Processing
like the one used by GPS, is much less suited for augmentation. The propulsive forces would
have to be modelled as generic “orbit perturbations” which is likely to require more model
parameters than in the example above. Although limited to short thrust periods, this method is
suited for nearly arbitrary (high) thrust levels.
If thrust levels are low (low thrust chemical or ion propulsion), the thrust can be considered as
an additional force in the orbit prediction process. The normal broadcast message is then fit
over an interval containing a thrust phase, as would be over a normal free flight phase.
The error introduced by this depends strongly on the acceleration by the propulsion system. If
the error introduced remains small, this solution would be favourable, because there is no
additional navigation message. In the following, results concerning this method will be
shown.
To evaluate the errors introduced by orbit manoeuvres, three different orbit types have been
considered: GEO, IGSO and LEO. Thrust and velocity increment have been altered to
simulate typical manoeuvres. The following table shows the parameters used in the
simulation.
Chemical Propulsion
Ion Propulsion
Specific Impulse
315 s
2568 s
Thrust
4 x 10 N
2 x 18 mN
Burn Time for a 50 m/s
Manoeuvre
11.36 min
Not Considered
(212 h ~ 9 days)
Burn Time for a 1 m/s
Manoeuvre
13.7 s
4.2 h
Table 7-4 Simulation Parameters
The chemical propulsion case is represented by 4 x 10 Newton thrusters using storable
propellant like MMH / NO4 . The ion propulsion consist of two Hughes XIPS thrusters from
the HS 601 HP.
Two manoeuvres have been performed for all three satellite types, covering the following
cases:
•
The 50 m/s manoeuvre represents the case, where orbit manoeuvres are conducted
infrequently, with a high velocity increment. This only makes sense using high thrust
propulsion, thus the ion propulsion has not been considered for this case.
•
The 1 m/s manoeuvre represents the case, where orbit manoeuvres are conducted
frequently, but with a low velocity increment. In this case, the ion propulsion has been
considered, although the thrust phase is not impulsive, but more like a permanent acting
force.
R. Wolf
Page 161
Autonomous Onboard Processing
Inter Satellite Links
The case where the orbit manoeuvre is performed using the apogee kick motor, has not been
considered, because these high thrust engines (> 400 N) are not accurate enough to perform
small orbit corrections. Frequently, the apogee-kick is performed using a solid rocket motor,
which can't be re-ignited anyway.
The following simulation have been performed considering the orbit manoeuvre in the
prediction of the precise ephemeris. The broadcast message, although not intended for
propulsive flight phases, has been fit over an interval which contains at least the beginning of
the manoeuvre. This is the worst case, because the acceleration changes not smooth, but with
a step. The following table represents the simulation results for the three types of orbit
manoeuvres.
Manoeuvre
50 m/s
Chemical
Propulsion
1 m/s
Chemical
Propulsion
1 m/s
Ion Propulsion
1 m/s
Ion Propulsion
15 Minutes
Update Rate
Component
GEO
IGSO
LEO
Radial
1.3 m
72 m
0.4 m
Along Track
1.4 km
1.2 km
1.5 m
Cross Track
97 m
891 m
49 m
URE
221 m
243 m
41 m
Radial
0
1.4 m
0.2 m
Along Track
51 m
41 m
0.8 m
Cross Track
11 m
29 m
14.5 m
URE
8m
8m
12.2 m
Radial
0m
0.05 m
0.08 m
Along Track
0.35 m
0.42 m
0.29 m
Cross Track
0.35 m
0.31 m
0.17 m
URE
0.07 m
0.1 m
0.29 m
Radial
0.03 m
0.06 m
0.08 m
Along Track
0.10 m
0.14 m
0.29 m
Cross Track
0.13 m
0.26 m
0.17 m
URE
0.05 m
0.07 m
0.29 m
Table 7-5 Ephemeris Error during an Orbit Manoeuvre
The fit error over an interval containing a 50 m/s manoeuvre is intolerable high. In case of a
planned orbit correction which requires a high velocity increment, the satellite has to be
switched to unhealthy.
A short, but frequently performed orbit correction using chemical propulsion produces also
intolerable high fit errors. Due to the fact, that the manoeuvre last only about 14 seconds, the
Page 162
R. Wolf
Inter Satellite Links
Autonomous Onboard Processing
satellite should be switch to unhealthy. The error introduced by ion propulsion is very low.
This is due to the fact that the ephemeris message can easier be fit to a slowly varying force
than to a fast changing. The resulting URE is acceptable, when the period of validity is
decreased to 15 minutes.
7.3.2 Frequently Updated Ephemeris Corrections
The simulation performed in the preceding section are independent whether the orbit
determination is performed onboard or not. Besides the fitting error of the broadcast model,
there is another error contributing to the prediction of a power trajectory: the uncertainty
introduced by the engine with respect to
•
thrust level
•
thrust direction
•
exact time when nominal thrust level is reached
•
engine cut off behaviour.
The significance of these error sources increase with thrust level. During orbit prediction of a
powered flight, the Kalman filter process is adapted by increasing process noise.
A major advantage of onboard processing is now that - presumed that measurements are
available – orbit corrections can be computed at a high update rate.
7.4 Application Example: Autonomous Onboard Integrity Monitoring
In the following example, an autonomous onboard processing scenario is demonstrated using
the Galileo Option 1, consisting of 33 MEO satellites. It is assumed, that the broadcast
ephemeris for the next 24 hours have already been determined (onboard or on ground) in post
processing, and uploaded. The broadcast ephemeris model used is the 15 parameter extended
GLONASS type.
Each satellite has an onboard processor, processing ground and intersatellite links. The
onboard processor uses a Kalman filter with the following state vector.
∆x
∆y
∆z
∆T
x =
∆x
∆y
∆z
∆T
Eq. 7.4-1
And the following simplified transition matrix
R. Wolf
Page 163
Autonomous Onboard Processing
1
0
0
0
Φ=
0
0
0
0
0
1
0
0
0
0
0
0
0
0
1
0
0
0
0
0
0 ∆t 0 0 0
0 0 ∆t 0 0
0 0 0 ∆t 0
1 0 0 0 ∆t
0 1 0 0 0
0 0 1 0 0
0 0 0 1 0
0 0 0 0 1
Inter Satellite Links
Eq. 7.4-2
At each epoch, the error state is propagated by
~
x K = Φ ⋅ xˆ k −1
Eq. 7.4-3
And the covariance matrix by
~
PK = Φ ⋅ Pˆk −1 ⋅ Φ T + Q
Eq. 7.4-4
The noise matrix Q is a diagonal matrix, adding a small amount of noise on the each state.
To obtain the observations, the nominal ranges to the ground stations and satellites have to be
computed.
rLOS = rSV − rGS
Eq. 7.4-5
rLOS,ISL = rSV − rSV ,ISL
Eq. 7.4-6
The positions of the satellites are derived from the broadcast ephemeris and are therefore
referenced in the earth-centred-earth-fixed frame. The range is derived from the magnitude of
the line of sight vector
R SV
GS = rLOS
Eq. 7.4-7
The measurement vector z is derived from
z1
z
SV
z = 2 R SV
SV , ISL , measured − R SV , ISL
z
n
Eq. 7.4-8
where the ith row consists of the measured range minus the computed range for one
intersatellite link
SV
z i = R SV
SVi , ISL, measured − R SVi , ISL ,Computed
Page 164
Eq. 7.4-9
R. Wolf
Inter Satellite Links
Autonomous Onboard Processing
or the same value for one ground link
Eq. 7.4-10
SV
z j = R SV
GS j , measured − R GS j ,Computed
The observation matrix H is
Eq. 7.4-11
h1
h
H= 2
...
h
n
with each row containing the partial derivative for the measurement with respect to the
Kalman filter states
x ij,LOS
hi =
Rj
i
y ij,LOS
z ij,LOS
R ij
R ij
1 0 0 0 0
Eq. 7.4-12
Before the Kalman filter routines are executed, the covariance matrix of the a priori residuals
E = eT ⋅ e
Eq. 7.4-13
~
e = z −H⋅x
Eq. 7.4-14
with
is tested to exclude faulty measurements. The ith measurement, and therefore the ith row of the
observation matrix H would be excluded if the following relationship holds
Ti ,i > 9 ⇒ Measurement i excluded
Eq. 7.4-15
with
Ti,i
diagonal element of matrix T
(
~
T = E ⋅ H ⋅ P ⋅ HT + R
)
−1
Eq. 7.4-16
which is the covariance matrix of the a-priori residuals times the inverse of the state
covariance matrix P mapped into the residual domain inflated by observation noise. This
formulation is close to the equation for the Kalman gain and is therefore proportional to the
weight this particular measurement will have. The test is formulated in way that a
measurement must not exceed 3 σ, which translates to a 99 % probability if a Gaussian
distribution is assumed.
After testing all residuals, it has to be decided if only the measurements where faulty or if the
measurements have been excluded due to a satellites own integrity problem. If the more than
50 % of the valid observation had to be removed, the onboard integrity monitor flags the
satellite unhealthy.
R. Wolf
Page 165
Autonomous Onboard Processing
N removed,meas
N valid,meas
Inter Satellite Links
> 0.5 ⇒ SV Health Flag = “unhealthy”
Eq. 7.4-17
After removal of suspicious observations, the Kalman routines are executed. Note that the
Kalman gain matrix has to be recomputed using the reduced Observation matrix Hred, if
measurements have been removed.
(
~
~
K = P ⋅ H Tred H red ⋅ P ⋅ H Tred + R
)
−1
Eq. 7.4-18
The updated estimates of covariance and state are then computed by
~
P = (I − K ⋅ H red ) ⋅ P
Eq. 7.4-19
and
(
~
~
xˆ = x + K z red − H red ⋅ x
)
Eq. 7.4-20
After the measurement update of the Kalman filter, a Chi-Square test is performed
s2
> ε ⇒ SV Health Flag = “unhealthy”
n ⋅ σ2
Eq. 7.4-21
with n being the number of valid observations and
s 2 = ∑ eˆ i2
Eq. 7.4-22
i
is the sample variance of the a-posteriori residuals.
eˆ = z − H red ⋅ xˆ
Eq. 7.4-23
The model variance is derived from the a-posteriori covariance matrix
σ 2 = Trace(H ⋅ Pˆ ⋅ H T )
Eq. 7.4-24
The sample variance is assumed to be Chi Square distributed, thus ε is derived from a Chi
Square distribution with n-1 degrees of freedom.
The estimated state is used as further criterion to estimate the orbit and clock error. It must not
exceed a predefined threshold, otherwise the satellite is flagged unhealthy.
x i > e i ⇒ SV Health Flag = “unhealthy”
Eq. 7.4-25
Because the position as well as the velocity error is estimated, the condition above can be
evaluated also to detect a ramp error, i.e. a slow drift in the position and clock error states. In
the simulations performed however, a ramp did not result immediately in an unhealthy status.
The following figure summarises the process flow.
Page 166
R. Wolf
Inter Satellite Links
Autonomous Onboard Processing
Next Measurement
Check
Measurements
Check SV
Health
Unhealthy
Healthy
Compute Range
Apply Corrections
Compute H Matrix
ei ⋅ ei
>9
Ti ,i
No
Exclude
Measurement
Yes
No
All
MEasurements
Tested?
Yes
Excl. > 50 % ?
Yes
Check Own Integrity
Status
No
Kalman filter
update with
remaining Obs
s2
>ε
n ⋅ σ2
Yes
No
3σ > δ
Set SV to
Unhealthy
Yes
Set SV to Healthy
No
x i > εi
Yes
No
Figure 7-2 Process Flow of the Onboard Integrity Monitor
R. Wolf
Page 167
Autonomous Onboard Processing
Inter Satellite Links
7.4.1 User Position Error due to Normal Orbit and Clock Degradation
To evaluate the effect of orbit and clock degradation, a user at position
Latitude:
48 °
Longitude: 11 °
(Munich) has been assumed, which computes his position using all satellites in view
(approximately 12 SV). The satellites positions are computed using the derived broadcast
parameters. The broadcast clock parameters have not been computed, but are assumed to be
applied as well. Thus only the residual degradation effect has been modelled by random walk
on the frequency and the resulting error has been added to the range.
In the following simulation, no integrity monitoring takes place. The predicted and uploaded
broadcast ephemeris, as well as the clock are subject to degradation. The following three
figures show examples of the true orbit and clock error due to ageing.
Radial Error [cm]
1998 07 01 12:17 - 1998 07 02 11:59
56.0
28.0
0
-28.0
-56.0
[h]
4
8
12
Along Track Error [cm]
16
20
1998 07 01 12:17 - 1998 07 02 11:59
42.0
21.0
0
-21.0
-42.0
[h]
4
8
12
Cross Track Error [cm]
16
20
1998 07 01 12:17 - 1998 07 02 11:59
66.0
33.0
0
-33.0
-66.0
[h]
4
8
12
Clock Error [cm]
16
20
1998 07 01 12:17 - 1998 07 02 11:59
496.0
248.0
0
-248.0
-496.0
[h]
4
8
12
16
20
Figure 7-3 Orbit and Clock Degradation of SV 26
Page 168
R. Wolf
Inter Satellite Links
Autonomous Onboard Processing
Radial Error [cm]
1998 07 01 13:10 - 1998 07 02 11:59
76.0
0
-76.0
[h]
4
8
12
Along Track Error [cm]
16
20
1998 07 01 13:10 - 1998 07 02 11:59
105.0
0
-105.0
[h]
4
8
12
Cross Track Error [cm]
16
20
1998 07 01 13:10 - 1998 07 02 11:59
64.0
0
-64.0
[h]
4
8
12
Clock Error [cm]
16
20
1998 07 01 13:10 - 1998 07 02 11:59
368.0
0
-368.0
[h]
4
8
12
16
20
Figure 7-4 Orbit and Clock Degradation of SV 15
R. Wolf
Page 169
Autonomous Onboard Processing
Inter Satellite Links
Radial Error [cm]
1998 07 01 12:47 - 1998 07 02 11:59
75.0
0
-75.0
[h]
4
8
12
Along Track Error [cm]
16
20
1998 07 01 12:47 - 1998 07 02 11:59
138.0
0
-138.0
[h]
4
8
12
Cross Track Error [cm]
16
20
1998 07 01 12:47 - 1998 07 02 11:59
146.0
0
-146.0
[h]
4
8
12
Clock Error [cm]
16
20
1998 07 01 12:47 - 1998 07 02 11:59
58.0
0
-58.0
[h]
4
8
12
16
20
Figure 7-5 Orbit and Clock Degradation of SV 10
If a user computes the satellite positions using the broadcast parameters, his positioning
performance will degrade due to the degraded orbit and clock parameters. Remember, the
broadcast ephemeris have been derived from a predicted trajectory. In the same way, the
clock parameters would have also been derived from prediction. The following figures show
the users positioning error over time, and in the horizontal plane.
Page 170
R. Wolf
Inter Satellite Links
Autonomous Onboard Processing
North
East
Up
16
14
12
10
8
6
4
Error [m]
2
0
-2
-4
-6
-8
-10
-12
-14
-16
18:40:30.000
01:20:30.000
08:00:30.000
Time[hour:min:sec]
Figure 7-6 User Position Error over Time
4
3
North Error [m]
2
1
0
-1
-2
-3
-4
-6
-4
-2
0
2
4
East Error [m]
Figure 7-7 User Horizontal Position Error
After nearly 24 hours, the user position error can be up to 15 meters, mostly due to the SV
clock error. However, to overcome the problem in normal system operation, the orbit and
R. Wolf
Page 171
Autonomous Onboard Processing
Inter Satellite Links
clock parameters would be updated at a higher rate than 24 hours, say every 6 hours, to
prevent excessive positioning service degradation. This would keep the position error below 2
meters.
7.4.2 User Position Degradation due to Unforeseen Orbit Manoeuvre
But not only the normal orbit degradation impacts the user position. If something happened
with the satellite clock, say an excessive increase in frequency (clock drift), this could not be
overcome by frequent parameter updates. Especially if the integrity requirement an the
satellite position and clock is high, as would be the case in airborne navigation, the user can
not rely on predicted orbits only. In the following simulation, one 2 Newton thruster of the
orbit control system of SV 26 is fired, resulting in a small 0.1 m/s velocity increment. At the
time the event takes place, the satellite is in view of the user position.
Radial Error [m]
1998 07 01 12:01 - 1998 07 01 12:29
50.0
25.0
0
-25.0
-50.0
[min]
5
10
Along Track Error [m]
15
20
25
1998 07 01 12:01 - 1998 07 01 12:29
10.0
5.0
0
-5.0
-10.0
[min]
5
10
Cross Track Error [m]
15
20
25
1998 07 01 12:01 - 1998 07 01 12:29
52.0
26.0
0
-26.0
-52.0
[min]
5
10
Clock Error [m]
15
20
25
1998 07 01 12:01 - 1998 07 01 12:28
0.0
0.0
0
-0.0
-0.0
[min]
5
10
15
20
25
Figure 7-8 SV 26 Orbit Error due to 2N Thrust / 0.1 m/s Delta V
Page 172
R. Wolf
Inter Satellite Links
Autonomous Onboard Processing
The user computes the satellites position now with orbit information, which is not applicable
any more. If the user does not monitor the integrity of his position computation using RAIM,
an increasing position error will be the result.
1,5
North Error [m]
1,0
0,5
0,0
-0,5
0,0
0,5
1,0
East Error [m]
-0,5
Error [m]
Figure 7-9 User Position Error in Horizontal Plane
North
East
Up
1,4
1,2
1,0
0,8
0,6
0,4
0,2
0,0
-0,2
-0,4
-0,6
-0,8
-1,0
-1,2
-1,4
-1,6
-1,8
-2,0
-2,2
12:04:19.000
12:07:39.000
12:10:59.000
12:14:19.000
12:17:39.000
12:20:59.000
12:24:19.000
12:27:39.000
Time[hour:min:sec]
Figure 7-10 User Position Error over Time
R. Wolf
Page 173
Autonomous Onboard Processing
Inter Satellite Links
7.4.3 User Position Error with Onboard Integrity Monitoring
The next four simulations have been conducted using the onboard integrity monitor described
above. This means, there are 33 Kalman filters running in parallel an processing only
measurements and information available at the satellite, and at a time when they become
available. It is assumed that the satellites broadcasts its integrity status via inter satellite link
to the other satellites, which then becomes available at the other satellites in the next epoch, as
well as to the user. If a user receives an "Unhealthy" flag from a satellite, this SV is excluded
from the position solution. The same applies to the satellites monitoring their own status using
ISL's. A received unhealthy flag leads to exclusion of this particular link.
In the simulation, a non integrity case is assumed, if the position error or the clock error
exceeds 1 meter in each direction. The trigger values for the state vector alarm are therefore:
State
Trigger Value
Result
X, Y and Z Estimated
Position Error
1 Meter
NO GO (Unheathy flag is
raised)
Clock Offset
1 Meter
NO GO
VX,VY,VZ Estimated
Velocity Error
2 cm/s
Warning Only
Clock Drift
2 cm/s
Warning Only
Figure 7-11 Trigger Values for Fault Detector
7.4.3.1
Strong Orbit Manoeuvre
The first simulated non-integrity case is an orbit manoeuvre with 50 Newtons thrust,
producing a velocity increment of 0.5 m/s in the along track direction. The affected satellite is
again SV 26, which is visible to the user at a medium elevation. The resulting orbit error over
time is depicted in the figure below.
Page 174
R. Wolf
Inter Satellite Links
Autonomous Onboard Processing
6
5
X
Y
Z
T
4
3
Error [m]
2
1
0
-1
-2
-3
-4
-5
-6
12:01:39.000
12:02:19.000
12:02:59.000
Time [hour:min:sec]
Figure 7-12 Absolute Orbit Error of SV 26
In the Kalman filter, the orbit error is estimated. The following figure shows the relative orbit
error of satellite, i.e. estimated versus true error.
dX
dY
dZ
dT
1,4
1,2
1,0
0,8
0,6
Error [m]
0,4
0,2
0,0
-0,2
-0,4
-0,6
-0,8
-1,0
12:01:39.000
12:02:19.000
12:02:59.000
Time [hour:min:sec]
Figure 7-13 Estimated vs. True Error for SV 26
R. Wolf
Page 175
Autonomous Onboard Processing
Inter Satellite Links
As can be seen from the figure above, the state is not estimated very well, due to the high
process noise required to keep the filter adaptable to fast changes. The error estimate of such a
Kalman filter is far too noisy to be used as a correction value, but it is sufficient to detect orbit
errors. To evaluate the reaction of the onboard processor to the injected fault, the error log of
all satellites is shown below. It has the following format
<Year> <Month> < Day> <hour:minute:second> SV <ID> <Error Message>
1998 07 01 12:02:59.000 SV 26 Ramp Detected [Position]
1998 07 01 12:03:00.000 SV 26 Ramp Detected [Position]
1998 07 01 12:03:00.000 SV 26 Non Detected Position Error =
1998 07 01 12:03:01.000 SV 26 Ramp Detected [Position]
1998 07 01 12:03:01.000 SV 26 Non Detected Position Error =
1998 07 01 12:03:02.000 SV 26 Ramp Detected [Position]
1998 07 01 12:03:02.000 SV 26 Non Detected Position Error =
1998 07 01 12:03:03.000 SV 26 Ramp Detected [Position]
1998 07 01 12:03:03.000 SV 26 Limit Exceeded [Position]
1998 07 01 12:03:03.000 SV 26 Check Result: NO GO
1998 07 01 12:03:03.000 SV 27 Removed Unhealthy SV ID 26
1998 07 01 12:03:03.000 SV 28 Removed Unhealthy SV ID 26
1998 07 01 12:03:03.000 SV 29 Removed Unhealthy SV ID 26
1998 07 01 12:03:03.000 SV 30 Removed Unhealthy SV ID 26
1998 07 01 12:03:04.000 SV 00 Removed Unhealthy SV ID 26
0.351 m
0.652 m
0.827 m
1998 07 01 12:03:04.000 SV 01 Removed Unhealthy SV ID 26
1998 07 01 12:03:04.000 SV 02 Removed Unhealthy SV ID 26
1998 07 01 12:03:04.000 SV 03 Removed Unhealthy SV ID 26
1998 07 01 12:03:04.000 SV 04 Removed Unhealthy SV ID 26
1998 07 01 12:03:04.000 SV 05 Removed Unhealthy SV ID 26
1998 07 01 12:03:04.000 SV 06 Removed Unhealthy SV ID 26
1998 07 01 12:03:04.000 SV 08 Removed Unhealthy SV ID 26
1998 07 01 12:03:04.000 SV 09 Removed Unhealthy SV ID 26
1998 07 01 12:03:04.000 SV 10 Removed Unhealthy SV ID 26
1998 07 01 12:03:04.000 SV 11 Removed Unhealthy SV ID 26
1998 07 01 12:03:04.000 SV 12 Removed Unhealthy SV ID 26
1998 07 01 12:03:04.000 SV 13 Removed Unhealthy SV ID 26
1998 07 01 12:03:04.000 SV 14 Removed Unhealthy SV ID 26
1998 07 01 12:03:04.000 SV 15 Removed Unhealthy SV ID 26
1998 07 01 12:03:04.000 SV 16 Removed Unhealthy SV ID 26
1998 07 01 12:03:04.000 SV 17 Removed Unhealthy SV ID 26
1998 07 01 12:03:04.000 SV 18 Removed Unhealthy SV ID 26
1998 07 01 12:03:04.000 SV 19 Removed Unhealthy SV ID 26
1998 07 01 12:03:04.000 SV 20 Removed Unhealthy SV ID 26
1998 07 01 12:03:04.000 SV 21 Removed Unhealthy SV ID 26
1998 07 01 12:03:04.000 SV 22 Removed Unhealthy SV ID 26
1998 07 01 12:03:04.000 SV 23 Removed Unhealthy SV ID 26
1998 07 01 12:03:04.000 SV 24 Removed Unhealthy SV ID 26
1998 07 01 12:03:04.000 SV 25 Removed Unhealthy SV ID 26
1998 07 01 12:03:04.000 SV 26 Chi Square Test Failed
1998 07 01 12:03:04.000 SV 26 Ramp Detected [Position]
1998 07 01 12:03:04.000 SV 26 Limit Exceeded [Position]
1998 07 01 12:03:04.000 SV 26 Check Result: NO GO
1998 07 01 12:03:05.000 SV 26 Chi Square Test Failed
1998 07 01 12:03:05.000 SV 26 Ramp Detected [Position]
Page 176
R. Wolf
Inter Satellite Links
Autonomous Onboard Processing
1998 07 01 12:03:05.000 SV 26 Limit Exceeded [Position]
1998 07 01 12:03:05.000 SV 26 Check Result: NO GO
1998 07 01 12:03:06.000 SV 26 Chi Square Test Failed
1998 07 01 12:03:06.000 SV 26 Ramp Detected [Position]
1998 07 01 12:03:06.000 SV 26 Limit Exceeded [Position]
1998 07 01 12:03:06.000 SV 26 Check Result: NO GO
1998 07 01 12:03:07.000 SV 26 Chi Square Test Failed
1998 07 01 12:03:07.000 SV 26 Ramp Detected [Position]
1998 07 01 12:03:07.000 SV 26 Limit Exceeded [Position]
1998 07 01 12:03:07.000 SV 26 Check Result: NO GO
1998 07 01 12:03:08.000 SV 26 Chi Square Test Failed
1998 07 01 12:03:08.000 SV 26 Ramp Detected [Position]
1998 07 01 12:03:08.000 SV 26 Limit Exceeded [Position]
1998 07 01 12:03:08.000 SV 26 Check Result: NO GO
1998 07 01 12:03:09.000 SV 26 Chi Square Test Failed
1998 07 01 12:03:09.000 SV 26 Ramp Detected [Position]
1998 07 01 12:03:09.000 SV 26 Limit Exceeded [Position]
1998 07 01 12:03:09.000 SV 26 Check Result: NO GO
1998 07 01 12:03:10.000 SV 26 Chi Square Test Failed
1998 07 01 12:03:10.000 SV 26 Ramp Detected [Position]
1998 07 01 12:03:10.000 SV 26 Limit Exceeded [Position]
1998 07 01 12:03:10.000 SV 26 Check Result: NO GO
1998 07 01 12:03:11.000 SV 26 Chi Square Test Failed
1998 07 01 12:03:11.000 SV 26 Ramp Detected [Position]
1998 07 01 12:03:11.000 SV 26 Limit Exceeded [Position]
1998 07 01 12:03:11.000 SV 26 Check Result: NO GO
1998 07 01 12:03:12.000 SV 26 Chi Square Test Failed
1998 07 01 12:03:12.000 SV 26 Ramp Detected [Position]
1998 07 01 12:03:12.000 SV 26 Limit Exceeded [Position]
1998 07 01 12:03:12.000 SV 26 Check Result: NO GO
1998 07 01 12:03:13.000 SV 26 Chi Square Test Failed
1998 07 01 12:03:13.000 SV 26 Ramp Detected [Position]
1998 07 01 12:03:13.000 SV 26 Limit Exceeded [Position]
1998 07 01 12:03:13.000 SV 26 Check Result: NO GO
1998 07 01 12:03:13.000 SV 26 Switched Off
The event takes place at 12:02:55. Four seconds later, a position drift is detected (the ramp
detector has a threshold of 2 cm/s). At this time, the satellites position is still within the 1x1x1
meter cube and therefore still considered to be integer. Another second later, the integrity
limit of one meter is exceeded by 0.3 meters, but the estimated error is still within the limit.
This is the first time a real non-integrity case exists, because the user has a hazardous
misleading information. He still used SV 26 although the orbit parameters are not correct
anymore. The position error remains undetected for another two seconds and grows to nearly
1 meter, before the estimated position error is large enough to trigger a NO GO. From now
on, the user is alarmed and will discontinue to use SV 26.
In the next epoch, all other satellites will exclude SV 26 from their integrity processing. One
second after the state limit check has detected the error, the Chi Square test also raises an
alarm.
As a result of the simulation, the user has been alarmed 3 seconds after occurrence of the nonintegrity situation, which is an acceptable time to alarm event for a CAT I landing (6 seconds
R. Wolf
Page 177
Autonomous Onboard Processing
Inter Satellite Links
limit). The maximum range error has been 1.8 meter (0.8 meter above the limit), but the error
in the user position has been negligible (see figure below).
North
East
Up
0,4
Error [m]
0,2
0,0
-0,2
-0,4
-0,6
12:01:49.000
12:02:39.000
12:03:29.000
Time[hour:min:sec]
Figure 7-14 User Error during Manoeuvre
7.4.3.2
Weak Orbit Manoeuvre
In the next simulation, a weak thrust of 2N results in a velocity increment of 0.1 m/s in the
cross track direction. Affected satellite is again SV 26. The next two figure show again true
and estimated versus true error of the satellites onboard processor.
Page 178
R. Wolf
Inter Satellite Links
Autonomous Onboard Processing
0,5
X
Y
Z
T
0,0
Error [m]
-0,5
-1,0
-1,5
-2,0
-2,5
12:02:19.000
12:03:39.000
12:04:59.000
Time [hour:min:sec]
Figure 7-15 Absolute Error SV 26
dX
dY
dZ
dT
0,6
0,4
Error [m]
0,2
0,0
-0,2
-0,4
12:02:19.000
12:03:39.000
12:04:59.000
Time [hour:min:sec]
Figure 7-16 Estimated vs True Error SV 26
The error log below indicates the sequence of events and messages.
1998 07 01 12:03:42.000 SV 26 Ramp Detected [Position]
1998 07 01 12:03:43.000 SV 26 Ramp Detected [Position]
R. Wolf
Page 179
Autonomous Onboard Processing
1998 07 01 12:03:44.000 SV 26 Ramp Detected [Position]
1998 07 01 12:03:45.000 SV 26 Ramp Detected [Position]
1998 07 01 12:03:46.000 SV 26 Ramp Detected [Position]
1998 07 01 12:03:47.000 SV 26 Ramp Detected [Position]
1998 07 01 12:03:48.000 SV 26 Ramp Detected [Position]
1998 07 01 12:03:49.000 SV 26 Ramp Detected [Position]
1998 07 01 12:03:50.000 SV 26 Ramp Detected [Position]
1998 07 01 12:03:51.000 SV 26 Ramp Detected [Position]
1998 07 01 12:03:52.000 SV 26 Ramp Detected [Position]
1998 07 01 12:03:53.000 SV 26 Ramp Detected [Position]
1998 07 01 12:03:53.000 SV 26 Non Detected Position Error =
1998 07 01 12:03:54.000 SV 26 Ramp Detected [Position]
1998 07 01 12:03:54.000 SV 26 Non Detected Position Error =
1998 07 01 12:03:55.000 SV 26 Ramp Detected [Position]
1998 07 01 12:03:55.000 SV 26 Limit Exceeded [Position]
1998 07 01 12:03:55.000 SV 26 Check Result: NO GO
1998 07 01 12:03:55.000 SV 27 Removed Unhealthy SV ID 26
1998 07 01 12:03:55.000 SV 28 Removed Unhealthy SV ID 26
1998 07 01 12:03:55.000 SV 29 Removed Unhealthy SV ID 26
1998 07 01 12:03:55.000 SV 30 Removed Unhealthy SV ID 26
Inter Satellite Links
0.068 m
0.175 m
1998 07 01 12:03:56.000 SV 00 Removed Unhealthy SV ID 26
1998 07 01 12:03:56.000 SV 01 Removed Unhealthy SV ID 26
1998 07 01 12:03:56.000 SV 02 Removed Unhealthy SV ID 26
1998 07 01 12:03:56.000 SV 03 Removed Unhealthy SV ID 26
1998 07 01 12:03:56.000 SV 04 Removed Unhealthy SV ID 26
1998 07 01 12:03:56.000 SV 05 Removed Unhealthy SV ID 26
1998 07 01 12:03:56.000 SV 06 Removed Unhealthy SV ID 26
1998 07 01 12:03:56.000 SV 08 Removed Unhealthy SV ID 26
1998 07 01 12:03:56.000 SV 09 Removed Unhealthy SV ID 26
1998 07 01 12:03:56.000 SV 10 Removed Unhealthy SV ID 26
1998 07 01 12:03:56.000 SV 11 Removed Unhealthy SV ID 26
1998 07 01 12:03:56.000 SV 12 Removed Unhealthy SV ID 26
1998 07 01 12:03:56.000 SV 13 Removed Unhealthy SV ID 26
1998 07 01 12:03:56.000 SV 14 Removed Unhealthy SV ID 26
1998 07 01 12:03:56.000 SV 15 Removed Unhealthy SV ID 26
1998 07 01 12:03:56.000 SV 16 Removed Unhealthy SV ID 26
1998 07 01 12:03:56.000 SV 17 Removed Unhealthy SV ID 26
1998 07 01 12:03:56.000 SV 18 Removed Unhealthy SV ID 26
1998 07 01 12:03:56.000 SV 19 Removed Unhealthy SV ID 26
1998 07 01 12:03:56.000 SV 20 Removed Unhealthy SV ID 26
1998 07 01 12:03:56.000 SV 21 Removed Unhealthy SV ID 26
1998 07 01 12:03:56.000 SV 22 Removed Unhealthy SV ID 26
1998 07 01 12:03:56.000 SV 23 Removed Unhealthy SV ID 26
1998 07 01 12:03:56.000 SV 24 Removed Unhealthy SV ID 26
1998 07 01 12:03:56.000 SV 25 Removed Unhealthy SV ID 26
1998 07 01 12:03:56.000 SV 26 Ramp Detected [Position]
1998 07 01 12:03:56.000 SV 26 Limit Exceeded [Position]
1998 07 01 12:03:56.000 SV 26 Check Result: NO GO
1998 07 01 12:03:57.000 SV 26 Ramp Detected [Position]
1998 07 01 12:03:57.000 SV 26 Limit Exceeded [Position]
1998 07 01 12:03:57.000 SV 26 Check Result: NO GO
1998 07 01 12:03:58.000 SV 26 Ramp Detected [Position]
1998 07 01 12:03:58.000 SV 26 Limit Exceeded [Position]
1998 07 01 12:03:58.000 SV 26 Check Result: NO GO
1998 07 01 12:03:59.000 SV 26 Ramp Detected [Position]
Page 180
R. Wolf
Inter Satellite Links
Autonomous Onboard Processing
1998 07 01 12:03:59.000 SV 26 Limit Exceeded [Position]
1998 07 01 12:03:59.000 SV 26 Check Result: NO GO
1998 07 01 12:04:00.000 SV 26 Ramp Detected [Position]
1998 07 01 12:04:00.000 SV 26 Limit Exceeded [Position]
1998 07 01 12:04:00.000 SV 26 Check Result: NO GO
1998 07 01 12:04:01.000 SV 26 Ramp Detected [Position]
1998 07 01 12:04:01.000 SV 26 Limit Exceeded [Position]
1998 07 01 12:04:01.000 SV 26 Check Result: NO GO
1998 07 01 12:04:02.000 SV 26 Ramp Detected [Position]
1998 07 01 12:04:02.000 SV 26 Limit Exceeded [Position]
1998 07 01 12:04:02.000 SV 26 Check Result: NO GO
1998 07 01 12:04:03.000 SV 26 Ramp Detected [Position]
1998 07 01 12:04:03.000 SV 26 Limit Exceeded [Position]
1998 07 01 12:04:03.000 SV 26 Check Result: NO GO
1998 07 01 12:04:04.000 SV 26 Ramp Detected [Position]
1998 07 01 12:04:04.000 SV 26 Limit Exceeded [Position]
1998 07 01 12:04:04.000 SV 26 Check Result: NO GO
1998 07 01 12:04:05.000 SV 26 Ramp Detected [Position]
1998 07 01 12:04:05.000 SV 26 Limit Exceeded [Position]
1998 07 01 12:04:05.000 SV 26 Check Result: NO GO
1998 07 01 12:04:05.000 SV 26 Switched Off
The event starts at 12:03:22. Twenty seconds later, the ramp detector is triggered the first
time. First occurrence of a non-integrity event is at 12:03:53, the NO GO Flag due to position
limit excess is raised at 12:03:55, yielding 2 seconds time to alarm. Impact on the user is
negligible, as can be seen in the figure below.
North
East
Up
0,4
Error [m]
0,2
0,0
-0,2
-0,4
-0,6
12:02:19.000
12:03:39.000
12:04:59.000
Time[hour:min:sec]
Figure 7-17 User Position Error during Manoeuvre
R. Wolf
Page 181
Autonomous Onboard Processing
7.4.3.3
Inter Satellite Links
Clock Drift
The third case simulates a sudden excessive drift of 10-10 sec/sec in the clock of SV 04, which
is visible to the user at a high elevation. The figures below indicate true and estimation error
of the onboard processor.
1,4
1,2
X
Y
Z
T
1,0
Error [m]
0,8
0,6
0,4
0,2
0,0
-0,2
12:01:24.000
12:01:49.000
12:02:14.000
Time [hour:min:sec]
Figure 7-18 Absolute Clock Error SV 04
dX
dY
dZ
dT
0,05
0,00
Error [m]
-0,05
-0,10
-0,15
-0,20
12:01:24.000
12:01:49.000
12:02:14.000
Time [hour:min:sec]
Figure 7-19 Estimated vs True Error SV 04
Page 182
R. Wolf
Inter Satellite Links
Autonomous Onboard Processing
The error log summarises the sequence of events:
1998 07 01 12:01:51.000 SV 04 Chi Square Test Failed
1998 07 01 12:01:51.000 SV 04 Check Result: NO GO [False Alarm]
1998 07 01 12:01:51.000 SV 05 Removed Unhealthy SV ID 04
1998 07 01 12:01:51.000 SV 06 Removed Unhealthy SV ID 04
1998 07 01 12:01:51.000 SV 07 Removed Unhealthy SV ID 04
1998 07 01 12:01:51.000 SV 08 Removed Unhealthy SV ID 04
1998 07 01 12:01:51.000 SV 11 Removed Unhealthy SV ID 04
1998 07 01 12:01:51.000 SV 12 Removed Unhealthy SV ID 04
1998 07 01 12:01:51.000 SV 13 Removed Unhealthy SV ID 04
1998 07 01 12:01:51.000 SV 14 Removed Unhealthy SV ID 04
1998 07 01 12:01:51.000 SV 15 Removed Unhealthy SV ID 04
1998 07 01 12:01:51.000 SV 16 Removed Unhealthy SV ID 04
1998 07 01 12:01:51.000 SV 19 Removed Unhealthy SV ID 04
1998 07 01 12:01:51.000 SV 20 Removed Unhealthy SV ID 04
1998 07 01 12:01:51.000 SV 21 Removed Unhealthy SV ID 04
1998 07 01 12:01:51.000 SV 22 Removed Unhealthy SV ID 04
1998 07 01 12:01:51.000 SV 23 Removed Unhealthy SV ID 04
1998 07 01 12:01:51.000 SV 24 Removed Unhealthy SV ID 04
1998 07 01 12:01:51.000 SV 25 Removed Unhealthy SV ID 04
1998 07 01 12:01:51.000 SV 26 Removed Unhealthy SV ID 04
1998 07 01 12:01:51.000 SV 27 Removed Unhealthy SV ID 04
1998 07 01 12:01:51.000 SV 28 Removed Unhealthy SV ID 04
1998 07 01 12:01:51.000 SV 29 Removed Unhealthy SV ID 04
1998 07 01 12:01:51.000 SV 30 Removed Unhealthy SV ID 04
1998 07 01 12:01:51.000 SV 31 Removed Unhealthy SV ID 04
1998 07 01 12:01:51.000 SV 32 Removed Unhealthy SV ID 04
1998 07 01 12:01:52.000 SV 00 Removed Unhealthy SV ID 04
1998 07 01 12:01:52.000 SV 01 Removed Unhealthy SV ID 04
1998 07 01 12:01:52.000 SV 02 Removed Unhealthy SV ID 04
1998 07 01 12:01:52.000 SV 03 Removed Unhealthy SV ID 04
1998 07 01 12:01:52.000 SV 04 Chi Square Test Failed
1998 07 01 12:01:52.000 SV 04 Check Result: NO GO [False Alarm]
1998 07 01 12:01:53.000 SV 04 Chi Square Test Failed
1998 07 01 12:01:53.000 SV 04 Check Result: NO GO [False Alarm]
1998 07 01 12:01:54.000 SV 04 Chi Square Test Failed
1998 07 01 12:01:54.000 SV 04 Check Result: NO GO [False Alarm]
1998 07 01 12:01:55.000 SV 04 Chi Square Test Failed
1998 07 01 12:01:55.000 SV 04 Check Result: NO GO [False Alarm]
1998 07 01 12:01:56.000 SV 04 Chi Square Test Failed
1998 07 01 12:01:56.000 SV 04 Check Result: NO GO [False Alarm]
1998 07 01 12:01:57.000 SV 04 Chi Square Test Failed
1998 07 01 12:01:57.000 SV 04 Check Result: NO GO [False Alarm]
1998 07 01 12:01:58.000 SV 04 Chi Square Test Failed
1998 07 01 12:01:58.000 SV 04 Check Result: NO GO [False Alarm]
1998 07 01 12:01:59.000 SV 04 Chi Square Test Failed
1998 07 01 12:01:59.000 SV 04 Check Result: NO GO [False Alarm]
1998 07 01 12:02:00.000 SV 04 Chi Square Test Failed
1998 07 01 12:02:00.000 SV 04 Check Result: NO GO [False Alarm]
1998 07 01 12:02:01.000 SV 04 Chi Square Test Failed
1998 07 01 12:02:01.000 SV 04 Check Result: NO GO [False Alarm]
1998 07 01 12:02:01.000 SV 04 Switched Off
R. Wolf
Page 183
Autonomous Onboard Processing
Inter Satellite Links
The event takes place at 12:01:47. Four seconds later, the Chi Square test raises a NO GO,
although the true error has not exceeded it's limit yet. The other satellites (as well as the user)
immediately exclude the observations to the faulty satellite. In this case, the alarm has to be
evaluated not as false alarm, but as a so called early detection. Although the limit has not been
exceeded yet at the time the alarm has been raised, this will however be the case only 15
seconds later. Due to the very early alarm, no error in the user position is caused.
North
East
Up
0,4
Error [m]
0,2
0,0
-0,2
-0,4
-0,6
12:02:39.000 12:04:19.000 12:05:59.000
Time[hour:min:sec]
User Error
Page 184
R. Wolf
Inter Satellite Links
7.4.3.4
Autonomous Onboard Processing
Clock Jump
The last non-integrity case simulated a 1e-8 s clock offset jump on SV 04.
3,0
X
Y
Z
T
2,5
Error [m]
2,0
1,5
1,0
0,5
0,0
12:01:24.000 12:01:49.000 12:02:14.000 12:02:39.000
Time [hour:min:sec]
Figure 7-20 Absolute Error SV 04
3,0
2,5
Error [m]
2,0
dX
dY
dZ
dT
1,5
1,0
0,5
0,0
-0,5
12:01:24.000 12:01:49.000 12:02:14.000 12:02:39.000
Time [hour:min:sec]
Figure 7-21 Estimated minus True Error
R. Wolf
Page 185
Autonomous Onboard Processing
Inter Satellite Links
The error log below summarises the sequence of events:
1998 07 01 12:02:29.000 SV 11 Removed Suspicious ISL: SV 04
1998 07 01 12:02:29.000 SV 12 Removed Suspicious ISL: SV 04
1998 07 01 12:02:29.000 SV 13 Removed Suspicious ISL: SV 04
1998 07 01 12:02:29.000 SV 14 Removed Suspicious ISL: SV 04
1998 07 01 12:02:29.000 SV 15 Removed Suspicious ISL: SV 04
1998 07 01 12:02:29.000 SV 16 Removed Suspicious ISL: SV 04
1998 07 01 12:02:29.000 SV 19 Removed Suspicious ISL: SV 04
1998 07 01 12:02:29.000 SV 20 Removed Suspicious ISL: SV 04
1998 07 01 12:02:29.000 SV 21 Removed Suspicious ISL: SV 04
1998 07 01 12:02:29.000 SV 22 Removed Suspicious ISL: SV 04
1998 07 01 12:02:29.000 SV 23 Removed Suspicious ISL: SV 04
1998 07 01 12:02:29.000 SV 24 Removed Suspicious ISL: SV 04
1998 07 01 12:02:29.000 SV 25 Removed Suspicious ISL: SV 04
1998 07 01 12:02:29.000 SV 26 Removed Suspicious ISL: SV 04
1998 07 01 12:02:29.000 SV 27 Removed Suspicious ISL: SV 04
1998 07 01 12:02:29.000 SV 28 Removed Suspicious ISL: SV 04
1998 07 01 12:02:29.000 SV 29 Removed Suspicious ISL: SV 04
1998 07 01 12:02:29.000 SV 30 Removed Suspicious ISL: SV 04
1998 07 01 12:02:29.000 SV 31 Removed Suspicious ISL: SV 04
1998 07 01 12:02:29.000 SV 32 Removed Suspicious ISL: SV 04
1998 07 01 12:02:30.000 SV 00 Removed Suspicious ISL: SV 04
1998 07 01 12:02:30.000 SV 01 Removed Suspicious ISL: SV 04
1998 07 01 12:02:30.000 SV 02 Removed Suspicious ISL: SV 04
1998 07 01 12:02:30.000 SV 03 Removed Suspicious ISL: SV 04
1998 07 01 12:02:30.000 SV 04 Removed Suspicious ISL: SV 32
1998 07 01 12:02:30.000 SV 04 Removed Suspicious ISL: SV 31
1998 07 01 12:02:30.000 SV 04 Removed Suspicious ISL: SV 30
1998 07 01 12:02:30.000 SV 04 Removed Suspicious ISL: SV 29
1998 07 01 12:02:30.000 SV 04 Removed Suspicious ISL: SV 28
1998 07 01 12:02:30.000 SV 04 Removed Suspicious ISL: SV 27
1998 07 01 12:02:30.000 SV 04 Removed Suspicious ISL: SV 26
1998 07 01 12:02:30.000 SV 04 Removed Suspicious ISL: SV 25
1998 07 01 12:02:30.000 SV 04 Removed Suspicious ISL: SV 24
1998 07 01 12:02:30.000 SV 04 Removed Suspicious ISL: SV 23
1998 07 01 12:02:30.000 SV 04 Removed Suspicious ISL: SV 22
1998 07 01 12:02:30.000 SV 04 Removed Suspicious ISL: SV 21
1998 07 01 12:02:30.000 SV 04 Removed Suspicious ISL: SV 20
1998 07 01 12:02:30.000 SV 04 Removed Suspicious ISL: SV 19
1998 07 01 12:02:30.000 SV 04 Removed Suspicious ISL: SV 16
1998 07 01 12:02:30.000 SV 04 Removed Suspicious ISL: SV 15
1998 07 01 12:02:30.000 SV 04 Removed Suspicious ISL: SV 14
1998 07 01 12:02:30.000 SV 04 Removed Suspicious ISL: SV 13
1998 07 01 12:02:30.000 SV 04 Removed Suspicious ISL: SV 12
1998 07 01 12:02:30.000 SV 04 Removed Suspicious ISL: SV 11
1998 07 01 12:02:30.000 SV 04 Removed Suspicious ISL: SV 08
1998 07 01 12:02:30.000 SV 04 Removed Suspicious ISL: SV 07
1998 07 01 12:02:30.000 SV 04 Removed Suspicious ISL: SV 06
1998 07 01 12:02:30.000 SV 04 Removed Suspicious ISL: SV 05
1998 07 01 12:02:30.000 SV 04 Removed Suspicious ISL: SV 03
1998 07 01 12:02:30.000 SV 04 Removed Suspicious ISL: SV 02
1998 07 01 12:02:30.000 SV 04 Removed Suspicious ISL: SV 01
1998 07 01 12:02:30.000 SV 04 Removed Suspicious ISL: SV 00
1998 07 01 12:02:30.000 SV 04 Removed Suspicious GL: GS 11
1998 07 01 12:02:30.000 SV 04 Removed Suspicious GL: GS 09
Page 186
R. Wolf
Inter Satellite Links
Autonomous Onboard Processing
1998 07 01 12:02:30.000 SV 04 Removed Suspicious GL: GS 08
1998 07 01 12:02:30.000 SV 04 Removed Suspicious GL: GS 07
1998 07 01 12:02:30.000 SV 04 Removed Suspicious GL: GS 06
1998 07 01 12:02:30.000 SV 04 Removed Suspicious GL: GS 05
1998 07 01 12:02:30.000 SV 04 Removed Suspicious GL: GS 04
1998 07 01 12:02:30.000 SV 04 Removed Suspicious GL: GS 03
1998 07 01 12:02:30.000 SV 04 More than 50 % Measurements Excluded
1998 07 01 12:02:30.000 SV 04 Check Result: NO GO
1998 07 01 12:02:30.000 SV 05 Removed Unhealthy SV ID 04
1998 07 01 12:02:30.000 SV 06 Removed Unhealthy SV ID 04
1998 07 01 12:02:30.000 SV 07 Removed Unhealthy SV ID 04
1998 07 01 12:02:30.000 SV 08 Removed Unhealthy SV ID 04
1998 07 01 12:02:30.000 SV 11 Removed Unhealthy SV ID 04
1998 07 01 12:02:30.000 SV 12 Removed Unhealthy SV ID 04
1998 07 01 12:02:30.000 SV 13 Removed Unhealthy SV ID 04
1998 07 01 12:02:30.000 SV 14 Removed Unhealthy SV ID 04
1998 07 01 12:02:30.000 SV 15 Removed Unhealthy SV ID 04
1998 07 01 12:02:30.000 SV 16 Removed Unhealthy SV ID 04
1998 07 01 12:02:30.000 SV 19 Removed Unhealthy SV ID 04
1998 07 01 12:02:30.000 SV 20 Removed Unhealthy SV ID 04
1998 07 01 12:02:30.000 SV 21 Removed Unhealthy SV ID 04
1998 07 01 12:02:30.000 SV 22 Removed Unhealthy SV ID 04
1998 07 01 12:02:30.000 SV 23 Removed Unhealthy SV ID 04
1998 07 01 12:02:30.000 SV 24 Removed Unhealthy SV ID 04
1998 07 01 12:02:30.000 SV 25 Removed Unhealthy SV ID 04
1998 07 01 12:02:30.000 SV 26 Removed Unhealthy SV ID 04
1998 07 01 12:02:30.000 SV 27 Removed Unhealthy SV ID 04
1998 07 01 12:02:30.000 SV 28 Removed Unhealthy SV ID 04
1998 07 01 12:02:30.000 SV 29 Removed Unhealthy SV ID 04
1998 07 01 12:02:30.000 SV 30 Removed Unhealthy SV ID 04
1998 07 01 12:02:30.000 SV 31 Removed Unhealthy SV ID 04
1998 07 01 12:02:30.000 SV 32 Removed Unhealthy SV ID 04
1998 07 01 12:02:31.000 SV 00 Removed Unhealthy SV ID 04
1998 07 01 12:02:31.000 SV 01 Removed Unhealthy SV ID 04
1998 07 01 12:02:31.000 SV 02 Removed Unhealthy SV ID 04
1998 07 01 12:02:31.000 SV 03 Removed Unhealthy SV ID 04
...
1998 07 01 12:02:31.000 SV 04 More than 50 % Measurements Excluded
1998 07 01 12:02:31.000 SV 04 Check Result: NO GO
...
1998 07 01 12:02:32.000 SV 04 More than 50 % Measurements Excluded
1998 07 01 12:02:32.000 SV 04 Check Result: NO GO
...
1998 07 01 12:02:33.000 SV 04 More than 50 % Measurements Excluded
1998 07 01 12:02:33.000 SV 04 Check Result: NO GO
...
1998 07 01 12:02:34.000 SV 04 More than 50 % Measurements Excluded
1998 07 01 12:02:34.000 SV 04 Check Result: NO GO
...
1998 07 01 12:02:35.000 SV 04 More than 50 % Measurements Excluded
1998 07 01 12:02:35.000 SV 04 Check Result: NO GO
...
1998 07 01 12:02:36.000 SV 04 More than 50 % Measurements Excluded
1998 07 01 12:02:36.000 SV 04 Check Result: NO GO
...
1998 07 01 12:02:37.000 SV 04 More than 50 % Measurements Excluded
R. Wolf
Page 187
Autonomous Onboard Processing
Inter Satellite Links
1998 07 01 12:02:37.000 SV 04 Check Result: NO GO
...
1998 07 01 12:02:38.000 SV 04 More than 50 % Measurements Excluded
1998 07 01 12:02:38.000 SV 04 Check Result: NO GO
...
1998 07 01 12:02:39.000 SV 04 More than 50 % Measurements Excluded
1998 07 01 12:02:39.000 SV 04 Check Result: NO GO
...
1998 07 01 12:02:40.000 SV 04 More than 50 % Measurements Excluded
1998 07 01 12:02:40.000 SV 04 Check Result: NO GO
1998 07 01 12:02:40.000 SV 04 Switched Off
The event takes place at 12:02:29. The other satellites immediately remove the observation to
SV 04 from their Kalman filter, due to a failed test of the a-priori residual. The onboard
processor of SV 04 also removes the observations to nearly all other satellites as well as the
ground links, due to a failed tests of the a-priori residuals. After excluding more than 50 % of
all observations, the onboard processor of SV 04 assumes a integrity problem, and raises the
NO GO flag. In the next epoch, the other satellites remove SV 04 due to the set NO GO flag,
as well as the user. Time to alarm: 1 second.
Note that the Chi Square test has raised no alarm, although the residuals are high. This is due
to the fact that by removing nearly all observations, the covariance matrix P has high values
values. These are used to normalise the a-posteriori residuals. The Chi Square test is only a
good detector, if enough measurements are available.
Due to the high elevation of SV 04, the clock jump of approximately 3 meters leads to a spike
in the altitude error of the user. But the overall impact on the user position error is negligible.
North
East
Up
0,8
0,6
Error [m]
0,4
0,2
0,0
-0,2
-0,4
12:01:29.000
12:01:59.000
12:02:29.000
Time[hour:min:sec]
Figure 7-22 User Error over Time (Spike of Altitude Error at T = 12:02:30)
Page 188
R. Wolf
Inter Satellite Links
References
8 CONCLUSION
8.1 Results and further Considerations
In the frame of this Ph.D. thesis, intersatellite links have been investigated as potential
observables for orbit determination. Introducing ISL's in an optimal way requires the states of
all satellites to be processed in one large filter. This is comparable to a geodetic network
adjustment, although the network points are orbiting instead of being fixed. Despite of the fact
that in the physical world one satellite is transmitting a ranging signal while another is taking
the measurement, they are both equivalent in a mathematical sense. There is no difference
between the measuring satellite and the target; both satellites states are improved in the
measurement update.
The correlation of the satellite states due to the ISL's provides an inherent capability for
bridging tracking gaps. Even if no ground station is in view, a satellite orbit can be observed
and determined if it is correlated via ISL with another satellite which is observed from
ground. This opens an interesting discussion: How far can the number of ground stations be
reduced? In one of the simulations in chapter six a global GEO/IGSO constellation is tracked
by a regional ground network of only four stations. This number can indeed be further
reduced down to one, however the accuracy of the realtime orbit estimation decreases.
Another interesting point is: what happens if the ground links are removed at all? The relative
positioning of the satellites would be ensured by the intersatellite links, but there would be a
slowly increasing decoupling from the earth's rotation. In the frame of the "Autonav"
capability of GPS Block IIR satellites simulations have been conducted concerning exactly
this issue. It was found that the position errors would increase up to 10 meters within 180
days.
It has already been mentioned that processing intersatellite links bears some operational and
technological problem, i.e. where to place the antennae on the S/V bus? How to get the
measurements to a central processing facility? Is it really worth the effort? Looking at the
results from chapter six reveals that the real time estimate of the orbit is indeed better,
especially in the off-radial components. However, the same accuracy can be achieved with
ground links by increasing the smoothing time. This reduces the advantage of ISL's over pure
ground links to a shortening of the required orbit arc. Nevertheless, this should not be
underestimated; after station keeping maneuvers of a satellite, the time the satellite becomes
available again depends exactly on the length of this minimum required orbit arc.
The main advantages of ISLs seem to be their observation accuracy: no troposheric delay,
modest ionospheric delay. Besides orbit determination there is another application for ISL,
integrity monitoring. Here, instantaneous observation accuracy cannot be so easily replaced
by a longer smoothing time. In combination with onboard processing, ISLs are perfectly
suited for integrity monitoring. The measurements are taken and processed aboard the
spacecraft. The integrity information is immediately available and can be broadcast to the
user. The system latency is extremely short, if any. For comparison: in a ground based
integrity monitoring system like WAAS or EGNOS data has to be collected by ground
stations, transmitted via wide area network to the central processing facility. The obtained
R. Wolf
Page 189
References
Inter Satellite Links
integrity result is then transmitted to an uplink station where it is uploaded to a spacecraft
where it can be broadcast to the user. System latency is at minimum four seconds.
Using ISLs for integrity monitoring demands a high technological effort. There is the issue of
the access method, for example: a Time Division Multiple Access (TDMA) method like for
the GPS Block IIR cross links will not be appropriate because of the time to alarm
requirement, which raises the demand for either Code Division Multiple Access (CDMA) or
Frequency Division Multiple Access (FDMA). Pure CDMA on one single frequency is not
feasible due to the near-far effect, which simply means a spacecraft can not receive on the
same frequency it is transmitting. A pure FDMA approach however raises the question of how
many frequencies will be needed? One per spacecraft? Frequencies are one of the very rare
resources in satellite navigation, thus it is unlikely that 30 frequencies will be allocated to
ISLs for Galileo. As a viable option appears the combination CDMA and FDMA. For
example, assuming a number of six frequencies and allowing each satellite to send on three
and to receive on the remaining three frequencies. For each satellite, the combination of send
and receive frequencies is different. Using this approach we would have
6
6!
720
=
=
= 20
3 (6 − 3)!⋅3! 36
possible combinations with only 6 frequencies needed, meaning that 20 bi-directional ISLs
can be established simultaneously with any combination providing one matching frequency
pair.
Even the question of antennae placement is solvable. There is no need to mount 30 antennae
on a single S/C bus. Phased array antennae, which use electronic beam steering to manipulate
the reception direction appear to be the right technology. Besides solving the antennae
placement problem they additionally provide SDMA (Space Division Multiple Access).
8.2 Recommendations for Galileo
While the system design phase for the next generation of satellite navigation systems GNSS 2
is already in progress, the results obtained in this Ph.D. thesis lead to several
recommendations for future satellite navigation systems. In the frame of Galileo ISL's have
been studied and evaluated with respect to their capability for orbit determination and
integrity monitoring. The technological effort has been found very high for orbit
determination, but worth further investigation with respect to integrity monitoring. With
integrity being the major design driver, ISL is still an option for Galileo today.
Although the use of intersatellite links places a high requirement on the space segment, i.e.
the satellites with respect to complexity, the gain could be worth the effort. The ISL provides
not only ranging capability, but also offers a communication channel between the satellites
which can be exploited to exchange status information as well as broadcast messages which
are dedicated to the user. For example, GPS Block IIR spacecraft are capable to use their
Page 190
R. Wolf
Inter Satellite Links
References
"cross-links" to disseminate the broadcast ephemeris of the entire constellation. This
overcomes the problem that ephemeris upload can only be done by the master control station,
which has rare contact (only twice a day) to each SV. This removes the necessity for the user
community to use orbit parameters computed already 24 hours ago, thus improving accuracy.
GPS Block IIR has also the capability for autonomous navigation, i.e. observing and
improving broadcast ephemeris parameters unaided from ground. The underlying TDMA
process with a period of 37 seconds, however, does not support integrity with respect to the
time-to-alarm requirement.
The effort of building complex space vehicles may be balanced by the reduction of (number
of) ground stations. Even if all monitoring and orbit determination is done on ground, the
additional orbit information obtained from the intersatellite ranging can bridge gaps in ground
network coverage.
Moreover, the benign geometry especially for higher orbit altitudes like MEO or GEO/IGSO
satellites, allows very rapid estimation of the orbits using shorter intervals of observation.
This leads to increased availability after manoeuvres, and also allows an increased rate of
broadcast ephemeris update rate. The communication capability of ISLs can also be used to
keep error due to ageing of broadcast ephemeris low. Keeping the accuracy goal of Galileo in
mind: this is an option to achieve it!
Combination of onboard autonomous processing and intersatellite links, although not feasible
in an optimal filter, is the most interesting option for autonomous integrity monitoring of the
future Galileo system. And last but not least: The two ephemeris models developed in the
frame of this work are a perfect match for the need of the Galileo system in terms of
flexibility and accuracy.
8.3 Achievements
Software ConAn (Constellation Analyser)
In the frame of this Ph.D. thesis, the theory of orbit determination and orbit computation has
been reviewed and a new approach for precise orbit and ephemeris determination using inter
satellite links has been developed. To investigate the achievable accuracy, the elaborated
models have been coded in a complex software package allowing system level performance
analysis as well as detailed evaluation of orbit computation and orbit estimation algorithms. It
includes several gravity models, precise planetary ephemeris (JPL DE200, see [STA-90]) and
orbit estimation in real time using Kalman filtering as well as conventional batch processing
of measurements. The simulations, which are a cornerstone of this Ph.D. thesis have all been
conducted using ConAn, as well as the comparison and visualisation of results.
Development of two new ephemeris models
The broadcast ephemeris model of both today's existing satellite navigation systems, GPS and
GLONASS have been investigated. It has been shown that superior performance of the GPS
model is mainly due to the number of parameters, or simply spoken, due to the degrees of
freedom provided by the model. Especially for short periods of validity, i.e. much shorter than
R. Wolf
Page 191
References
Inter Satellite Links
half a revolution, the non-Keplerian GLONASS model has been found superior to the Kepler
orbit based GPS model. Based on the GLONASS model, two new user ephemeris models,
one with 12, the other with 15 degrees of freedom have been developed and found to be a
viable option for MEO satellites, exceeding GPS as well as GLONASS models in terms of
model fitting error.
Development of an onboard integrity monitor
A conceptual design for an onboard integrity estimator has been proposed and investigated
with respect to the computational load. The necessary algorithms have been developed,
implemented and integrated in the ConAn software. The"onboard like" behaviour of the
algorithms has been ensured by
1. using only information which is available at a satellite
2. using it only at a time when it becomes available.
By simulating several types of non-integrity cases, it shown that the use of just one fault
detection mechanism is likely to be insufficient, because different detectors are triggered by
different events. A reasonable combination of fault detection mechanisms, covering different
fault cases, has been presented.
Page 192
R. Wolf
Inter Satellite Links
9
References
REFERENCES
[ABR-72]
Abramowitz, M. / Stegun, I (Editors): "Handbook of Mathematical Functions",
Dover Publication New York, 1972
[BIR-77]
Bierman G.J.: "Factorization Methods for Discrete Sequential Estimation",
Academic Press, San Diego – New York – Berkley – Boston – London – Sydney
– Tokyo – Toronto, 1977
[BLU-96]
Parkinson, B. / Spilker, J. / Axelrad, P / Enge, P.: "GPS – Theory and
Applications , Volumes I and II", AIAA Washington, 1996
[BOX-76]
Box G.E.P., Jenkins G.M.: "Time Series Analysis, Forecasting and Control",
Holden-Day, San Francisco – Düsseldorf – Johannesburg – London – Panama –
Singapore – Sydney – Toronto, 1976
[BRS-89]
Bronstein I.N., Semendjajew K.A:
"Taschenbuch der Mathematik", Verlag
Harry Deutsch, Thun und Frankfurt / Main, 24.Auflage , 1989
[BRW-92]
Brown R.G., Hwang P.Y.C.: "Introduction to Random Signals and Applied
Kalman Filtering", John Whiley and Sons, New York – Chichester – Brisbane –
Toronto – Singapore, Second Edition, 1992
[COL-81]
Colombo O. L., 1981: Numerical Methods for Harmonic Analysis on the Sphere,
Report No. 310, Department of Geodetic Science, The Ohio State University
1981.
[EHE-86]
Eissfeller, B. and G. W. Hein, 1986: A Contribution to 3D- Operational
Geodesy, Heft 17, Universitärer Studiengang Vermessungswesen
der
Universität der Bundeswehr München, 1986.
[ESC-65]
Escobal, P.R.: "Methods of Orbit determination" John Wiley and Sons, Inc. ,
New York – London – Sydney, 1965
[GID-95]
GLONASS Interface Control Document (Rev. 1995), Coordinational Scientific
Information Center of the Russian Space Forces, 1995
[GLB-81]
Gelb A.: "Applied Optimal Estimation", The M.I.T. Press, Cambridge –
Massachusetts – London, 1974 (Tenth printing, 1988)
[GPS-91]
ICD-GPS200, GPS Interface Control Document, Department of Defence, 1991
[GSC-76]
"Mathematical Theory of the Goddard Trajectory Determination System",
Goddard Space Filght Center, Greenbelt, Maryland, 1976
[GUT-94]
Guthmann, A. : "Einführung in die Himmelsmechanik und
Ephemeridenrechnung" B.I. Wissenschaftsverlag, Mannheim – Leipzig – Wien
– Zürich , 1994
[HKM-67]
Heiskanen,A.W. / Moritz, H: "Physical Geodesy" W. H. Freeman and Company,
San Francisco and London 1967
R. Wolf
Page 193
References
Inter Satellite Links
San Francisco and London, 1967
[HUB-68]
Huber P.J.: "Robust Statistics", John Whiley and Sons, New York – Chichester –
Brisbane – Toronto, 1981
[HWL-94]
Hofmann-Wellenhoff B. , Lichtenegger H. , Collins J.: "GPS – Theory and
Practice", 3rd revised Edition , Springerverlag, Wien – New York , 1994
[ITN-96]
IERS Conventions (1996) , IERS Technical Note 21
[JEN-68]
Jenkins G.M. , Watts D.G.: "Spectral Analysis and ist Applications", HoldenDay, San Francisco – Düsseldorf – Johannesburg – London – Panama –
Singapore – Sydney – Toronto, 1968
[KOC-80]
Koch K.-R.: "Parameterschätzung und Hypothesentests in linearen Modellen",
Dümmler, Bonn, 1980
[LEI-90]
Leick, Alfred: "GPS Satellite Surveying", John Wiley & Sons, New York 1990
[MAN-98]
Mansfeld, Werner: "Satelliten Ortung und Navigation", Friedrich Vieweg &
Sohn Verlagsgesellschaft, Braunschweig / Wiesbaden, 1998
[MOPS-98]
Minimum Operational Performance Standards for WAAS, RTCA Do 229 A
[NUM-99]
Numerical Recipes
[RIZ-79]
Rizos C. 1979: An Efficient Computer Technique for The Evaluation of
Geopotential From Spherical Harmonic Models, Aust. J. Geod. Photo. Surv. No.
31 December 1979.
[RIZ-85]
Rizos C. , Stolz A.: "Force Modelling for GPS Satellite Orbits", 1st Int.
Symposium Precise Positioning with GPS, Vol. 1 , P. 87 – 98, Rochville , USA
1985
[SOP-94]
Soop E. M., 1994: Handbook of Geostationary Orbits, European Space Agency
and Microcosm Inc., 1994.
[STA-90]
Astronomy & Astrophysics, vol. 114, pp. 297-302. Standish, E.M.: 1990, "The
Observational Basis for JPL's DE200, the planetary ephemeris of the
Astronomical Almanac", Astronomy & Astrophysics, vol. 233, pp. 252-271.
[STRA-97]
Strang, G. Borre.K: "Linear Algebra, Geodesy and GPS", Wellesley-Cambridge
Press, 1997
[TEU-98]
Teunissen, Peter / Kleusberg, Alfred : "GPS for Geodesy" 2nd Edition, Springer
Verlag Berlin, Heidelberg, New York, 1998
[WEZ-91]
Wertz, J.R. "Space Mission Analysis and Design", Space Technology Library,
Kluwer Academic Publishers, Dordrecht – Boston – London, 1991
Page 194
R. Wolf
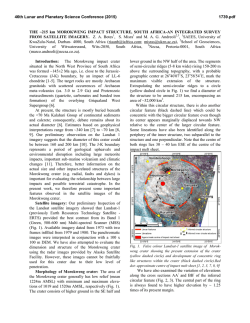

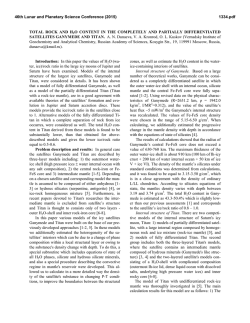
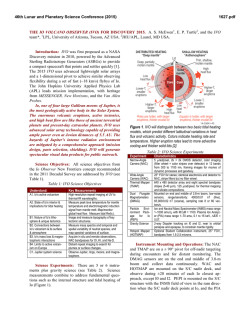
© Copyright 2026