
BRIGHTNESS TEMPERATURE OVER CRATER TYCHO
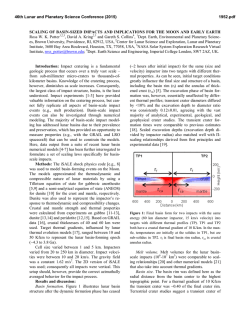
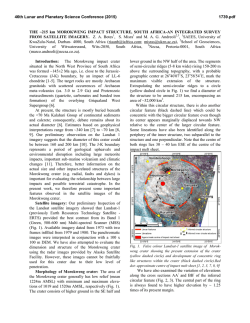
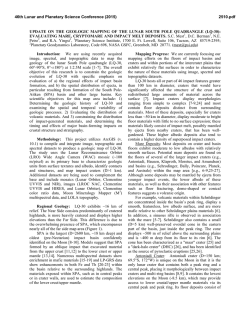
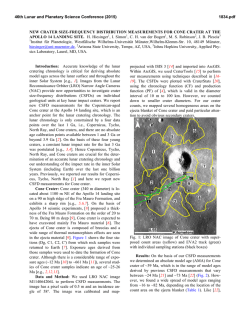
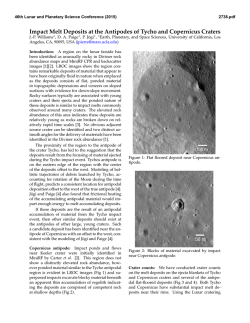
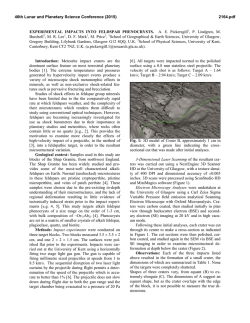
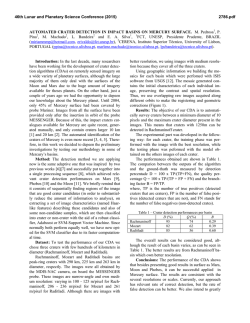
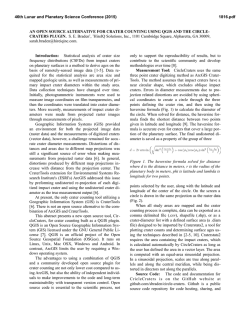
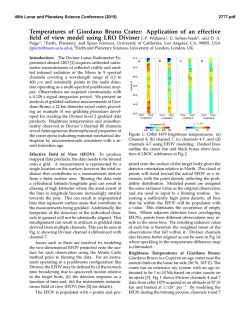
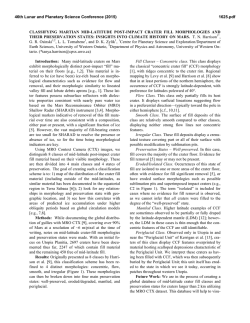
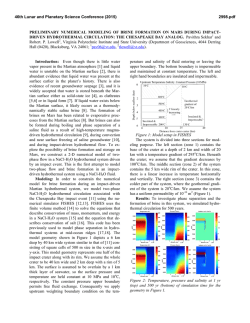
46th Lunar and Planetary Science Conference (2015)
1302.pdf
BRIGHTNESS TEMPERATURE OVER CRATER TYCHO : OBSERVATION AND SIMULATION G. P.
Hu1,2 ,Y. C. Zheng1,2,3*, A.A. Xu1,2, Z.S.Tang1,2
1
Space Science Institute, Macau University of Science and Technology, Avenida Wai Long, Taipa, Macau
2
Lunar Planetary Science Laboratory, Macau University of Science and Technology, Partner Laboratory of Lunar
and Deep Space Exploration, Chinese Academy of Sciences
Avenida Wai Long, Taipa, Macau
3
Key Laboratory of Lunar and Deep Space Exploration, National Astronomical Observatories, Chinese Academy of
Sciences, Beijing 100012, China
*
Email: [email protected]
diurnal difference over a crater; TBnight (K) is the
nighttime observation and TBday (K) is the daytime
observation from CE-1. Here the rock abundance is the
retrieved results from Diviner Lunar Radiometer Experiment data[6]. The curve shape of the diurnal TB difference and the average lunar rock profile display general similarities over the crater.
diunarl TB difference(K)
60
S(%)
5
RA content
TB differcence
0
-46
-45
-44
-43
-42
latitude(°) of observation dot over crater Tycho
-41
40
Fig. 1. Correlation between diurnal TB difference and rock abundance over crater Tycho.
Relation between Diurnal TB Difference and
Atitude Profile:The curve shape of the diurnal TB
difference and the altitude profile display general similarities over the crater, especially over regions inside
the crater. The altitude H is gotten by the formula H =
h-1737000 (m), where h (m) is from level 2B LAM
data.
-40
2000
0
-50
altitude (m)
diunarl TB difference(K)
Introduction: Multichannel (3.0-, 7.8-, 19.35-,
and 37-GHz) microwave radiometer (MRM) was
aboard Chang’E-1 (CE-1) and (CE-2) lunar exploration t, for measuring the brightness temperature (TB)
from the lunar surface, surveying the global distribution of lunar regolith thickness, and globally evaluating 3He content[1],[2]. The first global TB map of the
moon[3] was obtained from CE-1’s MRM, refelcting
lunar topographic signatures in the 37GHz TB maps,
such as the boundaries between mare and highland,
and the contour of craters. Some New features of crater Tycho from TB data are shown in a single track
view.
Data set observed by CE: The observed data applied here are level 2C microwave radiometer(MRM)
data, level 2C Charge Coupled Device (CCD) stereo
camera data, and level 2B laser altimeter (LAM) data
from CE-1 lunar orbiter, which comply with Planetary
Data System (PDS) standards for file formats and directory names, and are now publicly available:
http://159.226.88.59:7779/CE1OutENGWeb/ce1files.j
sp.The CE-1 MRM was calibrated onboard periodically (the calibration performs every 11.6s, i.e., once
every MRM measurement cycle) to assure its reliability and accuracy, using a two-point calibration method[4]. The nonlinearly error of the calibration is
within 1K at 37-GHz channel[4]. Detail description
about data calibration and data quality can be found in
the relevant literatures[3],[4],[5]. The definition of
MRM data at various levels of preprocessing was described before[3], and the definition of CCD camera
and LAM data at various levels of preprocessing is
similar to that of MRM data. 2763 tracks (orbit number from 0243 to 3005) of MRM data by CE-1 from
November 2007 to July 2008 are collected.
Relation between Diurnal TB Difference and
Rock Abundance: Due to the large rock abundance
preserved in the young craters[4], diurnal TB difference over crater Tycho (43.31°S 11.36°W) have been
chosen to compared with their altitude profile. The
diurnal
TB
difference
is
defined
as
∆TB = TBnight − TBday , where ∆TB (K) stands for the
-2000
-60
TB differcence
altitude
-46
-45
-44
-43
-42
latitude(°) of observation dot over crater Tycho
-41
-4000
Fig. 2. Correlation between diurnal TB difference and altitude profile over crater Tycho.
Simulation of Microwave Brightness Temperature over Lunar Surface:A detailed method(Fig.3) to
46th Lunar and Planetary Science Conference (2015)
1302.pdf
compute brightness temperature (TB) over a lunar crater is proposed, which incorporated the effect of surface tilts. The method improves the effective solar irradiance(ESI) model(Eq.1) of the lunar surface to obtain the temperature profile of the lunar crater [7].The
simulated behavior of TB across craters reproduces the
TB undulation observed by CE in a single swath. The
biggest difference between simulation and observation happens at the central peak of crater Tycho. And this may be
casued by the unconsidered fragment rock. Here the DEM
data are the LOLA reduced data record (RDR) [8].
(1)
Fig. 3. Microwave radiation transfer model for lunar crater surface.
Fig. 4. Comparison between simulated and observed TB over crater
Tycho.
Interpretation of TB Variation over Lunar crater:TB is the averaged radiometry of lunar surface
within a spatial resolution weighting with the MRM
antenna radiation pattern[4]. With the smaller penetra-
tion, the value of 37GHz TB along the profile of a
crater is determined by the average temperature within
a spatial resolution, i.e., the percentage of the cold and
warm areas, due to the effect of shadow and surface
tilts. As MRM scanning across the crater, the percentage of cold and warm areas inside a spatial resolution
varies, and TB shows an oscillatory behavior[7][9].
TB variation over a crater is proved to be significantly affected, through physical temperature, by the
crater shape described by DEM. The amplitude of the
TB oscillatory curves depends on the crater
shape[7][9].
Discussion: Seen from the TB observation of crater Tycho, the rock abudance is correlated with the
crater shape described by the DEM from LOLA. The
fact that the whole trend of simulated TB at 37GHz
over crater Tycho without rock abundance is consistent with that of the observation, may prove that the
crater shape determined the TB distribution. Thus, the
crater shape may determined the rock concentration.
References: [1] Ouyang Z.Y. et al. (2010) CJSS,
30(5), 392-403.[2] Zheng Y.C. et al. (2008) PSS. 56(7),
881-886. [3] Zheng Y.C. et al. (2012) Icarus, 219,
194-210.[4] Wang Z.Z. et al.(2010) Sci. China Ser. D
Sci., 53(9), 1392-1406. [5] Chan K.L.et al.(2010)
EPSL.295, 287-291.[6] Bandfield J.L. (2011) JGR,
116, E00H02.[7] Hu G.P. et al. (2014) IEEE TGRS
52(8), 4499 - 4510. [8] Smith D. E. et al. (2010) Space
Sci. Rev., 150, 209-241. [9] Hu G.P. et al. (2013) JARS
7(1), doi:10.1117/1.JRS.7.073469.
Acknowledgments: This work were jointly supported by grants from the Science and Technology
Development Fund of Macau (048/2012/A2 and
020/2014/A1) and NSFC program (41490633).
© Copyright 2026