
VOLCANIC EVENTS ON VENUS: OBSERVATIONS, MODELLING
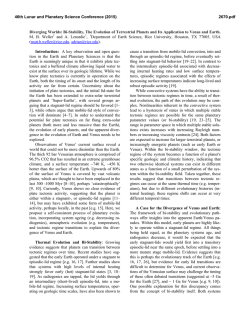
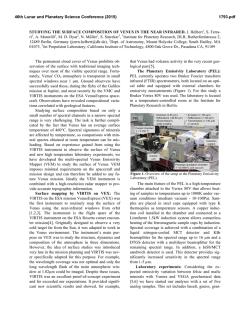
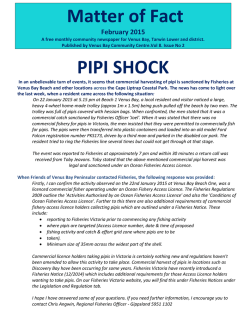
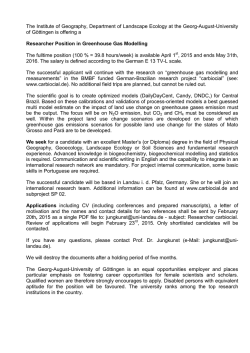
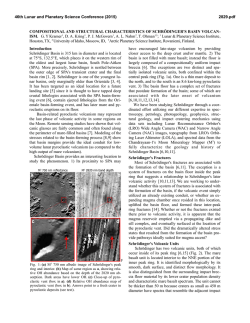
46th Lunar and Planetary Science Conference (2015)
1818.pdf
VOLCANIC EVENTS ON VENUS: OBSERVATIONS, MODELLING, AND DETECTION. M. W. Airey1,
T. A. Mather1, D. M. Pyle1, L. S. Glaze2, R. C. Ghail3, and C. F. Wilson4, 1Dept. of Earth Sciences, University of
Oxford, South Parks Road, Oxford, OX1 3AN, UK. (email: [email protected]), 2NASA Goddard Space
Flight Center (code 698), Greenbelt, MD 20771, USA., 3Dept. of Civil and Environmental Engineering, Skempton
Building, Imperial College London, South Kensington Campus, London, SW7 2AZ, UK., 4Atmospheric, Oceanic,
and Planetary Physics, Clarendon Laboratory, University of Oxford, Oxford, OX1 3PU, UK.
Introduction: There has long been indisputable
evidence for past volcanic activity on Venus (mainly
the observations in the SAR data recorded by NASA’s
Magellan mission) that has been described, classified,
and catalogued in great detail [e.g. 1, 2]. However, the
finer details of volcanic processes have remained harder to identify with the current paucity of direct observations and available geological and geochemical data
for Venus. Compositional and textural differences between volcanogenic deposits on Venus are also difficult to understand, as existing datasets require a certain
degree of individual interpretation when identifying
deposits. In this presentation we aim to use modelling
and comparative approaches with Earth observation in
order to make some preliminary investigations into the
finer details of Venusian volcanism pending extensive
new additional datasets.
Many factors influence how Venusian volcanism
will differ from terrestrial volcanism. Among them are
the atmospheric temperature and pressure, and the acceleration due to gravity, which we know, and the
magma composition/temperature/volatile content, conduit dimensions/structure, and local geology, which we
do not. In order to understand how volcanism occurs
on Venus it is necessary to use what information exists
along with analogy with terrestrial processes and modelling methods within estimated ranges of conditions.
Methods: The approach to this study was to use
theoretical modelling, along with radar analyses, in
order to identify the range of volcanic behaviour occurring on Venus.
Modelling. A campaign of volcanological numerical modelling was undertaken to explore the potential
range of styles of behaviour of volcanoes under Venusian conditions [3, 4]. The core of the modelling work
was the development of a steady-state, homogeneous
flow conduit code adapted from the original method of
[5]. Magma flow was simulated from the conduit base
to the vent, whereupon the final parameter values
could be used to infer the resulting style of eruption.
For each run, the volatile degassing behaviour (H2O
and/or CO2) was calculated using a basaltic magma of
a composition reflecting the Venera 14 lander analysis
[6], with the model of [7], which was subsequently
incorporated into the conduit model.
An existing subaerial plume model [8] (linked to
the conduit code via a decompressed jet model) was
also used in the study to investigate the likelihood of
plume buoyancy and predict plume heights. As a final
application of the model findings, case study regions
on Venus were compared with current detection limits
of H2O (from Venus Express) to explore whether or
not orbital detection of volcanic events may be plausible.
Radar observations. It is often assumed that virtually all volcanic deposits on Venus are the result of
effusive lava flows, and that explosive volcanism is
unable to occur due to the inferred outgassing and loss
to space of most of the planetary inventory of H2O [9,
10] (the chief magmatic volatile on Earth), and the
atmospheric pressure at Venus’ surface. However, recent evidence suggests that explosive volcanism may
indeed have occurred in the form of a proposed pyroclastic deposit, Scathach Fluctus, and may even be
more widespread than initially suspected [11].
In an attempt to differentiate between effusive and
explosive deposits on Venus, the most comparable data
for a number terrestrial deposits was inspected in order
to identify a method of distinguishing between lavas
and pyroclastics, with the findings then being applied
to Venus. As the roughness, backscatter, and emissivity/reflectivity datasets are all that can be systematically
investigated on Venus, comparable properties were
sought from ESA’s ASAR (Envisat) and NASA’s
MODIS (Terra/Aqua) datasets to best match the Magellan wavelengths, although this was not possible in
all cases.
Results: Through the modelling investigation, we
found that the addition of CO2 to an H2O-driven eruption increases the final pressure, velocity, and volume
fraction gas (Figure 1). Increasing vent elevation leads
to a greater degree of magma fragmentation, due to the
decrease in the final pressure at the vent, resulting in a
greater likelihood of explosive activity. Increasing the
magmatic temperature generates higher final pressures,
greater velocities, and lower final volume fraction gas
values with a correspondingly lower chance of explosive volcanism. Cross-sectionally smaller, and/or
deeper, conduits were more conducive to explosive
activity.
It was found that, for explosive activity to occur at
the location of Scathach Fluctus, the model suggests
that a magmatic H2O content of ~4.5%, or a combined
H2O/CO2 mix of ~6% would have been required to
46th Lunar and Planetary Science Conference (2015)
[11], which may then be used as further case studies
for the modelling procedure.
0.78
210
21
b Venus
20
0.77
200
0.76
190
0.75
180
0.74
170
0.73
160
0.72
150
19
17
16
15
14
Pressure (MPa)
18
Exit velocity (m s−1)
Volume fraction exsolved gas
form such a deposit. Very high values when the likely
low H2O inventory of Venus is considered, however
these values vary with the initial variable values. For
example, cross-sectionally smaller conduits and/or
higher-altitude vents require a smaller volatile content
for magma fragmentation to occur and accessory CO2
reduces the need for very high H2O concentrations.
Should explosive events occur, it was predicted by the
plume code that buoyant columns up to ~20 km above
the vent may potentially be achievable from highaltitude vents.
Model results also suggest that explosive activity at
Scathach Fluctus would result in an H2O flux of ~107
kg s-1. Were Scathach Fluctus emplaced in a single
event, our model suggests that it may have been emplaced in a period of ~15 days, supplying 1-2 × 10⁴ Mt
H2O to the atmosphere locally. A sustained eruption of
this scale might increase local atmospheric H2O abundance, which is generally spatially very invariable (30
[-5, +10] ppm [12]), by tens of ppm for long enough,
and over an area large enough, to be a detectable
anomaly by near-infrared nightside sounding using the
1.18 µm spectral window such as that carried out by
the Venus Express/VIRTIS spectrometer.
The result of the comparative analysis of radar
properties highlighted that, although possible pyroclastic deposits on Venus may have a narrow range of radar properties (Figure 2), pending further study, the
fact that successful large-scale differentiation of lavas
and pyroclastics using large radar datasets is not feasible and a solution remains elusive with the currently
available data. What remains potentially achievable
however, is the investigation of, as yet unidentified,
exceptional individual examples using the combination
of radar properties and field relationships as used in
1818.pdf
13
12
11
0.71
0
0.5
1
1.5
2
Additional CO2 (%)
2.5
3
10
Figure 1. The response of volume fraction gas (black, solid
curve), exit velocity (red, dot-dash curve), and pressure
(blue, dashed curve) to an increasing concentration of CO2
(0-3%) added to magma of constant H2O concentration (3%).
Values correspond to conditions at the volcanic vent of radius 25 m above a conduit of 5 km length, and a magmatic
temperature of 1200 K at Venus' MPR.
References: [1] Crumpler, L.S. and Aubele, J.C. (2000)
Volcanism on Venus, in Encyclopedia of volcanoes, H.
Sigurdsson, Editor. [2] Head, J.W., et al. (1992) Journal of
Geophysical Research-Planets, 97, E8, 13153-13197 [3]
Airey, M.W., et al. (2013) 44th LPSC [abstract #1282] [4]
Airey, M.W., et al. (in review) Planetary and Space Science
[5] Woods, A.W. (1995) Rev. Geophys., 33, 4, 495-530 [6]
Surkov, Y.A., et al. (1984) Journal of Geophysical Research,
89, 393-402402 [7] Witham, F., et al. (2012) Computers &
Geosciences, 45, 87-97 [8] Glaze, L.S., et al. (1997) J.
Geophys. Res.-Atmos., 102, D5, 6099-6108 [9] De Bergh, C.,
et al. (1991) Science, 251, 4993, 547-549 [10] Grinspoon,
D.H. (1993) Nature, 363, 6428, 428-431 [11] Ghail, R.C. and
Wilson, L. (2013) Geological Society, London, Special
Publications, 401 [12] Bézard, B., et al. (2011) Icarus, 216,
1, 173-183
Figure 2. Emissivity plotted against asperity (a measure of roughness corresponding to the wavelength of the ASAR radar for
comparative purposes). Two thirds of the possible Venus pyroclastic deposits plot within narrow boundaries (red square), although they remain indistinguishable from some lava flows.
© Copyright 2026